| Issue |
EPJ Nuclear Sci. Technol.
Volume 11, 2025
|
|
|---|---|---|
| Article Number | 22 | |
| Number of page(s) | 17 | |
| DOI | https://doi.org/10.1051/epjn/2025005 | |
| Published online | 04 June 2025 | |
https://doi.org/10.1051/epjn/2025005
Regular Article
Has natural radioactivity contributed to the evolution of living organisms? Validation of a dedicated calculation scheme (for isotopic concentrations and deposited energies) on Oklo's natural nuclear reactors
1
Former Director of Research at CEA France
2
Université Paris-Saclay, CEA, Service d’Études des Réacteurs et de Mathématiques Appliquées 91191 Gif-sur-Yvette France
* e-mail: This email address is being protected from spambots. You need JavaScript enabled to view it.
** e-mail: This email address is being protected from spambots. You need JavaScript enabled to view it.
*** e-mail: This email address is being protected from spambots. You need JavaScript enabled to view it.
Received:
30
May
2024
Received in final form:
27
February
2025
Accepted:
3
March
2025
Published online: 4 June 2025
Abstract
In October 2018, the French Society of Nuclear Energy (SFEN/PACA) organized a conference-debate entitled “What happened two billion years ago where present-day Gabon is located? Has Nuclear Power contributed to the development of Life on Earth?” Our contribution to this reflection concerns the possible impact of radiation emitted from radioactive media on the early evolution of living organisms and may also be useful for research on the storage of radioactive waste. This article concerns the qualification of a calculation scheme for isotopic concentrations and energy deposits in Oklo's natural nuclear reactors or any other naturally radioactive environment. Our work has been carried out using a calculation scheme involving the Monte Carlo software TRIPOLI-4® [TRIPOLI-4 R, CEA, EDF and AREVA reference Monte Carlo code, https://doi.org/10.1016/j.anucene.2014. 07.053; TRIPOLI-4 R, Version 4 Manuel de l’utilisateur. Rapport CEA-R-6170 (2008); in French] for the propagation of neutrons and gamma rays in matter and the MENDEL software [DARWIN: An Evolution Code System for a Large Range of Applications, CEA, https://doi.org/10.1080/00223131.2000.10875009; MENDEL depletion code, https://doi.org/10.1051/snamc/201402409] which deals with the evolution over time of the concentrations of nuclides formed in a material subjected to neutron irradiation. The precision achieved by our methodology will allow to carry out calculations of deposited energy to contribute to the debate on this possible effect of nuclear power on the evolution of Life.
Key words: OKLO / REACTORS / FISSION / URANIUM / MENDEL / TRIPOLI-4(R)
© J.-C. Nimal et al., Published by EDP Sciences, 2025
 This is an Open Access article distributed under the terms of the Creative Commons Attribution License (https://creativecommons.org/licenses/by/4.0), which permits unrestricted use, distribution, and reproduction in any medium, provided the original work is properly cited.
1. Introduction
1.1. Oklo: two totally improbable phenomena
Our final objective is to estimate irradiation levels in very old radioactive environments was triggered by the discovery of two totally improbable facts:
-
(a)
The existence, 2 billion years ago, of natural nuclear fission reactors was discovered in 1972 after a routine control of isotopic distribution for uranium [5] prior to the UF6 enrichment in 235U. The extracted uranium ore showed anomalies in isotopic distribution. The calculated isotopic distributions of neodymium and samarium [6, 7] allowed to demonstrate the existence of fissions and the possibility [8] of sustained chain reactions.
-
(b)
The discovery of very developed Life form fossils with regard to the age of the rocks (2 billion years) in almost the same place some forty years later after the discovery of natural nuclear reactors. This fossil discovery was first published in 2010 [9].
1.2. Brief history of natural nuclear reactors
The possibility of self-sustaining fission reactions on Earth had been considered before the discovery of Oklo's natural reactors. Kuroda showed in 1956 [10, 11] that sustained fission reactions had been possible on our planet. This author determined the volumes necessary to reach the critical condition at very ancient periods on Earth. Kuroda was inspired by the vulcanologist Noetzlin [12] who was trying to explain the origin of volcanic eruptions. According to Rutherford, the radioactive decay of certain isotopes (40K, 235U, 232Th) was responsible for the heat release in the Earth. The discovery of the fission phenomenon in 1939 attracted the attention of Noetzlin in connection with his research on volcanic eruptions. Noetzlin died without having demonstrated the existence of such chain reactions.
This demonstration only took place in 1972. Following isotopic controls on uranium ore, Bouzigues [5] showed the existence of an anomaly in the 235U content. The French Atomic Energy Commission (CEA) decided to measure [13] the concentrations of various fission products in many samples. As early as 1972, the use of software dedicated to the analysis of irradiated PWR (Pressurized Water Reactor) fuels allowed to demonstrate the existence of fissions and to provide some neutron1 characteristics [6].
Following these discoveries, the behavior of natural reactors has been the subject of numerous studies. It would be presumptuous to establish a list (far from being exhaustive). Our main information sources used come from the proceedings of the International Atomic Energy Agency (IAEA) conference (1978) and from the Naudet's book [14] published in 1991. More recently, let us cite the meeting organized in 2018 by the SFEN/PACA and the special session of the International Conference on High Level Environmental Radiation Areas (ICHLERA) conference (2022) devoted to on the fiftieth anniversary of the Oklo phenomenon discovery. This last conference was an opportunity to take stock of advances concerning geology [15], isotopic measurements [13] and associated calculations [16], reactor physics [17] and [18], questions of the evolution of Life [19] and that of waste storage [20]. All these studies concerning the functioning of natural reactors use the knowledge of several scientific disciplines (nuclear reactor physics, geology …). The reference [21] contains the first approach describing the operating kinetics of these natural reactors from the start-up to the extinction of nuclear reactions.
1.3. Appearance of elaborate life forms
A second revolution was brought on by A. El Albani in 2010 with the discovery of fossils [9]. The discovery took place in the vicinity of the nuclear reaction zones. The dating of the rocks containing these fossils is close to the start-up age of natural reactors: 2.1 billion years. The size of the fossils found by A. El Albani showed the existence of a highly developed form of Life at that time. It was commonly accepted that highly developed Life only appeared on Earth around 580 million years before our era.
Since A. El Albani publication in 2010, the international scientific community has brought these two Oklo phenomena closer together. It is now accepted that oxygen has played an essential role in the formation of uranium deposits with high content; the appearance of highly elaborate forms of Life is also linked to high oxygen content [22]. Geologists agree on the explanation for the creation of zones with high uranium content: this is the result of the Great Oxidation Event (GOE) [23–25], which occurred in the period from 2.45 to 2 billion years in the past. The oxidizing power of the run-off water allowed the uranium to migrate after dissolving. The contact of these waters with a reducing medium (Organic waste, hydrocarbons, presence of electropositive chemical species …) then caused the uranium precipitation. This occurrence created the zones with high uranium content. Concerning the Life appearance, A. El Albani has shown in several articles the existence of a correlation between a high content of oxygen and the existence of fossil evidence of elaborated Life. The “Gabonionta”, dating back 2.1 billion years, is the oldest manifestation of this elaborate Life. The next period, ranging from 1.8 to 0.6 billion years, is the so-called “boring period” for paleontologists: it corresponds to the absence of fossil observations during this period corresponding to a decrease in the oxygen content. It will be necessary to wait for this content increase to observe a new emergence of an elaborate Life. This reapearance will then occur during the Ediacaran period (from 635 to 538 million years ago). It seems very likely that the oxygen content may have constituted a common initiating event, thus correlating the two anomalies quoted above.
1.4. Our main objective
It is accepted that the oxygen peak (GOE) constitutes the event linked to the two phenomena mentioned above. A question remains: “could radiation due to the radioactivity of uranium have participated in the early evolution of Life?” We therefore propose the calculation of possible levels of irradiation in very old radioactive environments likely to have contained microorganisms. This hypothesis seems conceivable for the following reasons. A large number of specialists agree to situate the development of Life in lagoon environments [26, 27]. Moreover, the long possible irradiation durations (of the order of hundreds of millions of years) and the dispersion of the irradiation intensities may have favored the multiplicity of mutations (or not) and thus allowed the complexification and the diversification of living organisms.
Our objective is thus to determine the level of irradiation in such naturally radioactive lagoon environments. We used software developed for radiation shielding studies of current power reactors. The characteristics of the lagoon environments envisaged are very different from those encountered today in our reactors. These differences relate to the time and running durations. These differences require extending the qualification of the software used for current reactors.
2. Ionizing radiation and life
2.1. The effects of ionizing radiation on life forms
Direct or indirect ionizing radiation can act on living organisms [28] with various consequences. Radiation can constitute an additional energy contribution allowing the synthesis of organic building blocks from (C, H, O, N). Radiation can have harmful effects on Life forms and can also cause damage to the structural materials of nuclear power plants. For example, damage to DNA double or single strand break (a DNA strand) can lead to apoptosis or necrosis of the cell. This damage may or may not result in mutations that can be repaired; if they can be repaired and adapted to the environment, radiation can contribute to the evolution of living organisms. The adaptation of living organisms to radiation is the subject of many studies [29–31]. In this context, these include the actions of the ALLIANCE group [28].
2.2. Existence of life on Earth in hostile environments and/or of uranium-rich mines
A key question is “Have we ever observed similar phenomena involving natural fission reactors or the influence of radioactivity on living forms?”
Some forms of life on Earth cohabit with a radioactive environment [29] that can sometimes hostile, examples include the black mushrooms at Chernobyl [32], the adaptation of diatoms (algae) to the radioactivity of water in the Limousin region [30], and the Variovorax (bacteria) observed in the OSIRIS nuclear reactor [33, 34]. Studies on the use of radiation to sterilize bacteria in the medical and food sectors are also worth mentioning.
As far as the existence of high-grade uranium veins is concerned, the Gabon deposit (Franceville) is not unique. The Canadian deposits of CIGAR LAKE and McARTHUR RIVER in Saskatchewan and the OLYMPIC DAM deposit in Australia [35] are worth mentioning. Nevertheless, the question must be asked: “Have traces of organic matter ever been observed in such places as in the uranium mines in Gabon?” To the best of our knowledge, the contribution of nuclear energy to the evolution of life discussed at the SFEN/PACA conference has not yet been reported outside of Gabon.
2.3. Quantifying biological effects
Quantifying irradiation and the associated biological effects can be dealt with both microscopic and/or macroscopic approaches respectively:
-
A sophisticated approach based on nanobiology computations such as that developed in references [36, 37] using the GEANT4-DNA software [38].
-
An approach used by radiation protectionists that is more global: biological effects are quantified through an evaluation of the energy deposited in matter by radiations, a specific harmfulness being attributed to each type of radiation.
We have adopted the second approach. In this frame, we calculate the energy deposition values by classifying them by type of radiation. We are aware that these quantities are very imperfect for characterizing genetic mutation probabilities. This remark justifies our use of the expression “irradiation level”.
3. Calculation scheme
3.1. Software used
The calculation scheme used includes two functionalities: particle transport and the temporal evolution of compositions. These functionalities are provided by two software developed for shielding studies of current nuclear reactors: TRIPOLI-4® [1, 2] and MENDEL [3, 4]. For current power reactors, the temporal evolution of concentrations requires the use of alternating transport and evolution (nuclide generation/depletion) calculations. This procedure takes into account temporal variations of isotopic concentrations and neutron spectra. The use of a single calculation pair (transport/evolution) leads to a neutron spectrum constant over time. This simplification is acceptable when the neutron fluence values are sufficiently low.
MENDEL [3, 4] software deals with the temporal evolution of isotope concentrations, stable or not, sometimes under the action of neutron fluxes (fission, absorption, other nuclear reactions). These evolution calculations use fluxes and cross-sections represented by 172 energy groups and determined by the transport calculations. The nuclear data used for the evolution calculations are generated from the JEFF-3.1.1 library [39].
TRIPOLI-4® [1, 2] processes the transport of various radiations (n, β, γ …) using a Monte-Carlo method. Particle energy fluxes (spectra) are derived from these calculations. The neutron cross sections are represented punctually with a Doppler broadening corresponding to 574° K. The nuclear data are derived from the JEFF-3.1.1 library [39] and from EEDL for electrons [40]. Knowledge of reaction rates and neutron spectra with an energy distribution in 172 groups allows the calculation of self-shielded cross sections in energy structures with 1 or 172 groups. Use of self-shielding is essential for representing the cross-sections of fissile isotopes (235U, 238U, 239Pu …). Transport calculations are carried out according to the two possible source emission modes: critical or subcritical depending on the phenomenon under study.
3.2. Calculated physical quantities
TRIPOLI-4® and MENDEL software can be used to calculate the following physical quantities:
-
Energy deposits over the ages with their distributions by energies and types of radiation (α, β, γ). These distributions enable biological effects to be quantified [41].
-
Energy distributions of particle currents entering through a surface modelized a possible life form.
-
Conventional neutron fluxes per unit of lethargy enabling a posteriori determination of the activity of various elements ingested or located in the vicinity of a possible living organism (using Westcott's formalism [42]).
-
Temporal variations of around 1800 concentrations of stable or unstable isotopes: fission products (FP), subsidiary products (PL) of fissile isotopes and isotopes (PA) produced by nuclear transmutation of rock elements.
The first three above mentioned quantities are intended for radiation geneticists to assess the possibility of viable mutations.
Determining the four above quantities requires modeling the system (the radioactive medium studied) before the nuclear reactions (Sect. 3.3) then providing information on the intensity and temporal variations of these reactions (Sect. 3.4).
3.3. The initial state
The initial state of the system is defined by its geometry, its compositions and the age of the uranium contained (see Appendix A). When the initial state is correctly defined, a perfect transport/evolution calculation should provide characteristics of the system in a final state very close to the state observed today by physicists.
For natural reactors, the initial state is described by the isotopic compositions of the media involved. Chemical compositions other than uranium come from current observations and measurements by geologists and physicists [14, 23, 25]. Several publications [14, 27] contain compositions of sandstone media used in the case of natural reactors or in similar cases we plan to study. We deduced the initial 238U concentration (at the initial state) from the isotopic measurements taken today [43, 44]. This initial value takes only into account the half-life of this isotope (4.47 billion years). We therefore neglect the disappearance of this initial isotope during nuclear reactions. A posteriori, our evolution calculations show an effect of 0.84%. The value of the initial 235U concentration is obtained from the initial 238U concentration using the natural value of the 235U/238U ratio just before the nuclear phenomenon. Appendix A provides an example definition of an initial state for the ore sample studied in this article.
For the lagoon environments currently being studied, we impose the initial state a priori. To define the characteristics of these hypothetical radioactive environments we mainly use the information published in the references [26, 27] (see Appendix B).
The definition of this initial state makes it possible to carry out a transport calculation using the TRIPOLI-4® software. This calculation gives access to the initial neutron spectrum as well as the self-shielded cross sections of the various materials. Appendix A shows an example of the data and main results for the ore sample considered in paragraph 4.
3.4. Intensity and temporal variations of the nuclear phenomenon
As with power reactors, calculating the temporal evolution of isotopic concentrations requires knowing the neutron flux at all times. This flux is expressed in neutrons per units of time and area. The nonlinearity of the differential evolution equations requires the definition of the neutron flux in absolute value. The case of natural reactors and that of radioactive lagoon environments constitute different, even opposing, situations. The treatment of their time evolutions is therefore very different (see Appendix B).
3.4.1. Neutron fluence and neutron flux determinations in lagoon environments
The temporal flux variations and the fluence are calculated directly from the initial isotopic concentrations of the lagoon environment. These variations are deterministic: they follow the exponential laws of radioactive filiations. The transport/evolution calculations, carried out with the TRIPOLI-4® and MENDEL software, directly allow the absolute determination of all quantities of interest.
3.4.2. Temporal variations for the natural nuclear reactors
We show in Appendix B the large differences between the time variations of radioactivity in a lagoon environment and those existing in a natural nuclear reactor. In the case of the Oklo natural reactors, the determination of all the quantities integrated over the duration of the nuclear phenomenon can be done by two methods.
Used since 1972 [6], the first consists of dividing each isotopic concentration measured by the corresponding fission yield [45]. This directly gives the total number of fissions sought. Access to fluence and the energy released by fission is immediate and precise (see Appendix B).
The second method is based only on the value measured today of the 235U lack compared to the natural value. Knowledge of self-shielded cross sections condensed to one group (see Appendix A) gives access to the associated fluence.
For these two methods and in the case of natural reactors, it is difficult or even impossible to determine the quantities at any time using the values integrated over the all duration of the phenomenon. This results from the erratic nature of these reactors (see Appendix B). Knowledge of the average value of the irradiation level over the entire phenomenon duration does not prejudge the short irradiation of a possible form of Life.
The purpose of this first article (another is in preparation) is the qualification of a method for calculating the irradiation level in old radioactive environments. This qualification must use available measurements by placing ourselves in the hypothetical situation of lagoon environments. The choice of samples taken at Oklo therefore prevailed but with the condition of imposing the initial 235U concentration. It is clear that this choice will probably degrade the quality of the results since the measured values of fission product concentrations are ignored. Qualification therefore consists of comparing the calculated concentration values with the corresponding values issued from the measurements. The isotopes concerned are the fission products and possibly other measurable isotopes (see Sect. 4.7).
With these assumptions, the neutron fluence, denoted τ, is obtained by the relation (1) below:
 (1)
(1)
In expression (1), σabs, 5 designates the one-group microscopic absorption cross section of 235U associated with the neutron fluence τ. The  ratio measures the anomaly measured today on the 235U concentration. This ratio is invariable over time. All the microscopic cross sections (fissile elements, structural materials, etc.) come from a transport calculation carried out with the TRIPOLI-4® software. They are condensed into one energy group with self-shielding. A first flaw appears with the use of the absorption cross section value in the initial state. This assumption neglects the variations of the neutron spectrum during the duration of the nuclear phenomenon.
Our blind approach has a second more important flaw. The very long duration of nuclear reactions will lead to a restitution of the 235U. This restitution takes place during fission chain reactions. The relation (1) does not take into account this process. As for power reactors, 239Pu comes from neutron capture on 238U. This production follows the decay of two short-lived isotopes 239U (half-life: 23.5 minutes) and 239Np (2355 days). The nuclear systems envisaged evolve over very long-time scales, different from those encountered in current power reactors. The alpha decay of 239Pu (half-life 24 100 years) thus formed leads to the regeneration of 235U.
To take into account this mode of 235U formation, NAUDET [14] modified relation (1). He introduced a restitution factor, which he called C*. This factor measures the quantity of 235U formed per unit of 235U consumed. In expression (2) C* is a global factor on the fission reaction duration.
 (2)
(2)
As an example, temporal variations of the coefficient C* are given in paragraph 4.11. At each time t, the restitution factor C* is obtained by calculating the ratio between the formation of 235U by α decay of 239Pu and its disappearance by neutron absorption.
Since the summer of 1972, the restitution of 235U has been the subject of discussion. At that time, some isotopic measurements showed contents higher than the natural value (0.72%). The migration of 239Pu followed by its precipitation constituted an explanation of this anomaly. The existence of contents greater than 0.720% observed on some rare measurements was therefore proof of the formation of 239Pu. Such remark made Vendryes say “that Nature designed the first breeder reactor”. Naudet [15 page 60] estimates that these rare values above 0.720% result from measurement uncertainties. In this reference, Naudet cites that outside the reaction zones, more than 95% of the measurements led to 235U contents between 0.7198% and 0.7204%. The formation of 239Pu was repeatedly demonstrated by analyzing the isotopic distributions of fission products (see Appendix B).
3.5. CALCONC: a simplified software for sensitivity studies
For nuclear system the characteristics of the initial state and the operating conditions present uncertainties of various origins. The CALCONC software has being designed to evaluate the effects on irradiation levels resulting from uncertainties in the physical characteristics used (compositions, reaction times, power, etc.). This software solves the differential equations linking the concentrations of fissile species. It uses the cross-sections at one energy group determined by a brief TRIPOLI-4® calculation.
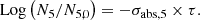
We have considered three fissile species: 235U, 239Pu and 238U for fast neutrons. These isotopes are respectively identified by the index m with: m=5, 9 or 8. Each of these three isotope concentrations decrease by radioactivity and by absorption. We take into account the disappearance of 239Pu by neutron absorption which competes with radioactive decay. The concentration at time t of isotope numbered m is denoted by Nm(t) (generally expressed in (atom/cm3)). With these hypotheses, the three differential equations linking the concentrations Nm(t) can be written:
 (3)
(3)
 (4)
(4)
 (5)
(5)
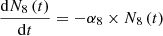 (6)
(6)
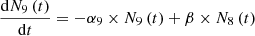 (7)
(7)
 (8)
(8)
The four quantities σabs, m;σn, γ, m;φ;λm designate respectively for each isotope denoted by m: the total absorption cross sections, the radiative capture cross section (cm2/atom), the neutron flux (n/(cm2.s)), the radioactive decay constants (s−1).  designates the α decay constant for 239Pu.
The disappearance of 239Pu is characterized in the coefficient α9. This coefficient contains two terms which clearly show the competition between neutron absorption and radioactive decay. This competition depends on the intensity of the neutron flux. The ratio  represents the value φlim separating two domains for the flux φ. First for φ<φlim radioactive decay is predominant and second pour φ>φlim absorption predominates.
An indirect mode of formation of 235U from 238U is important in the case of natural reactors. We will later show that it is low or even negligible in lagoon environments. As an example, and for the neutron spectrum corresponding to sample 402 (see paragraph 4), the value of the ratio  is 8.075 109 n/(cm2 × s).
Solving the differential equations leads to expressing the temporal concentrations variations of fissile isotopes in the form of a sum of exponentials. The concentration values of certain fission products are then obtained by analytical integration of the fission densities. Such a calculation procedure is possible following the independence of the neutron spectrum as a function of time. An extension of the CALCONC software is planned to process several time steps with different cross sections and fluxes.
3.6. Representativeness of current measurements in the Oklo site
The validation of our calculation scheme is based on the interpretation of current isotope measurements. The question arises as to whether measurements taken in the present day provide a faithful and representative picture of an ancient nuclear phenomena? For each isotope, the concentration measured has two origins: the contribution of the nuclear phenomenon and that of the natural element present before or added over time. The depollution (cleaning up) of the measurements consists in recovering the values of the isotopic concentrations characterizing the nuclear phenomenon. The measurements mainly concern the concentrations of fission products together with those of fissile elements. The 238U concentration was used as a reference in the results published by Dozol [43] and Naudet [44].
The importance of this depollution depends on the intensity of the nuclear phenomenon studied (see Appendix C). In the case of Oklo's natural reactors, the depollution corrections are of the order of a few percent [43]. Their influence is therefore weak on the calculation/measurement ratios.
The cleaning up is easier when:
-
The element under analysis has a large number of stable isotopes (example Nd, a contrario: Eu).
-
The isotopic vector of the natural element and the nuclear vector are very different (for example Nd with 142Nd).
Table 1 reproduces the isotopic distributions of natural neodymium and neodymium produced by the fission of 235U by thermal neutrons [45].
Distribution of stable isotopes of neodymium.
Cleaning up becomes difficult and not significant when the concentration of the element resulting from the nuclear phenomenon is low compared to the concentration of the natural element.
Some physicochemical phenomena, such as the migration of chemical species by leaching or displacement, interfere with the measurements. In a first approximation, migration does not alter the isotopic distributions within the same element. Displacement can lead to inconsistencies between the absolute values of isotope concentrations obtained for different elements. The findings [6] of coherence observed in reaction zones (RZ) earned Oklo the term of fossils.
Note that the TRIPOLI-4®-MENDEL calculations could take into account the evolution of a natural element which could have been present before the phenomenon.
4. Validation using measurements on natural reactors
4.1. Modeling used
The case of Oklo's natural reactors corresponds to a high power in a critical environment. The geometric model used consists of a layer of ore, with a thickness to be defined, that situated between two layers of clay. The present-day composition of the ore corresponds to that of the sample numbered 402 selected from the 700 isotope measurements published by Dozol [43] and Naudet [44]. These 700 measurements reveal a large spatial dispersion of isotopic concentration values from one sample to another. We chose sample marked 402 since it currently corresponds to a significant anomaly in 235U (235U/U = 0.544%). In addition, samples taken nearby show similar combustion rates, which justifies our modeling based on a homogeneous core. The elemental compositions are taken from Naudet's publication [14] which is a reference for studies of Oklo natural nuclear reactors. For the total water content of the clay gangue, we considered the two extreme values given by Naudet: 9.1% (calculation referenced 402-02) and 13.4% (calculations referenced 402-10 and 402-11). In case 402-11, the total number of chain reactions was increased by 30%. This fictitious increase only allows access to the sensitivity of the results during a variation in the total number of fissions. The thickness chosen for the uranium layer results from a criticality search using the TRIPOLI-4® software (63 cm and 24 cm depending on the water content chosen (selected). Appendix A describes the data used for the transport/criticality calculation. The essential results appear in this appendix. For the definition of the initial state, 235U and 238U concentrations have been deduced from the age of onset of chain reactions.
Let us recall the fundamental assumptions made for all calculations. The fluence is determined from the lack measured on the isotope 235U without taking into account the restitution factor. Another simplification was introduced: the use of a neutron spectrum constant over time. These approximations and their impact are presented in Appendix B. Table 2 brings together the main results obtained by the transport calculation carried out from the conditions of the initial state.
Main TRIPOLI-4® results.
Remember that fluence and neutron flux have been condensed to one energy group. The self-shielded cross-sections are in agreement with these fluencies. The conventional fluence is obtained by dividing the absorption reaction rate by the thermal cross section at 2200 m/s.
4.2. Neutron spectrum from TRIPOLI-4® calculations
Figure 1 shows the neutron spectrum in a homogeneous critical core corresponding to sample 402-02.
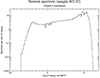 |
Fig. 1. Neutron spectrum calculated with TRIPOLI-4® software. |
4.3. Results for the main fission products
The following comparisons concern the calculation/measurement ratios for 3 elements: neodymium, samarium and europium. These elements were retained because their isotopic concentrations are accessible in absolute terms for a given sample. References [43, 44] and knowledge of the density of the sample provide access to isotopic concentrations. Reference [14] allowed us to estimate the value of this ore density. Several steps are then necessary to arrive at the desired concentration values. The sequence of operations is given below.
For the 700 samples analyzed, Naudet [44] gives the contents and isotopic distributions of uranium. In reference [43], Dozol reproduces the measured values of the ratios between the concentrations of a selected fission product and the isotope 238 of uranium. The 3 selected isotopes are isotope 148 for neodymium, isotope 147 for samarium and isotope 153 for europium. These ratios are determined for around twenty samples in the case of neodymium and in the other two cases for around ten samples. These ratios provide access to the absolute values of the concentrations for three isotopes: 148Nd, 147Sm and 153Eu. The transition to the concentrations of all other stable isotopes was carried out using the relative distributions of isotopic concentrations measured by Dozol [43]. In particular, knowing the concentration of 142Nd allows to carry out reliable cleaning up for neodymium (see Appendix C). In reference [43], Dozol describes the principles of depollution of measurements for the samarium; the depollution of measures on europium is very difficult because this element only has two stable isotopes [43].
Measurements of the isotopic distribution of some other fission products provide access to the WESTCOTT parameter and the fast fission rate on 238U.
Tables 3–5 show the ratio between calculated and measured values for the isotopic concentrations of these three emblematic fission products (FP): neodymium, samarium and europium; the ‘M’ measurements were not subject to depollution corrections, estimated to be in the order of percent [43].
Neodymium isotopic concentrations: MENDEL results/raw measurements (M).
Samarium isotopic concentrations: MENDEL results/raw measurements (M).
Europium isotopic concentrations: MENDEL results/raw measurements (M).
We applied the procedure described in Appendix C to clean up the measurements taken on neodymium. The pollution rate γ of neodymium is equal to 6.63%. Table 6 reproduces the ratios between the calculated values and the corrected measured values.
Neodymium isotopic concentrations: MENDEL results/cleaned up measurements.
4.4. A simplified calculation to deal with variation problems
Table 7 shows an example of the degree of validity of the simplified CALCONC software in the case of Neodymium isotopic measurements. Note that, the advantage of using the sum of the isotopic concentrations for two pairs (143Nd + 144Nd) and (145Nd + 146Nd) in preference to concentrations taken separately (reduced sensitivity to neutron capture, see Appendix B). For each concentration, the CALCONC software gives access to the contributions of each fissile isotopes, which facilitating analysis of the fission distribution between these fissile species.
Neodymium isotopic concentrations: values from CALCONC/raw measurements (M).
In Table 7, the ratios in brackets refer only to the calculated contributions of the fission on the isotopes 235U and 238U. The values indicated after the brackets correspond to all of the 3 fissile species therefore including fissions on 239Pu. (In the case of sample 402-11, the contribution of the fissile isotope 239Pu was not taken into account).
4.5. Testing the validity of the initial model with simplified calculations
The construction of the initial model may require a few iterations: its validity is obtained when the values of current isotopic concentrations derived from the calculations correspond well with the measured values. Table 8 shows an example of a comparison between the simplified “CALCONC” software and the MENDEL reference for fissile isotope; the concentration of 235U is sensitive to the neutron capture defect on 238U and to the restitution factor C*. An excess of 238U is due to a neutron capture defect on this isotope, resulting in a lack of 235U formation.
MENDEL and CALCONC calculations of isotopic concentrations; ‘discrepancy’ is the difference between the CALCONC and the MENDEL reference values.
4.6. An example: fluence sensitivity study (using CALCONC software)
Figure 2 concerns the variations in C/M quotients between the calculation value of isotopic concentration noted C and measurement value of isotopic concentration noted M. This figure represents the variations in the C/M ratios for the neodymium isotopes and for the 235U and 238U isotopes when the latter undergo fission of variable durations with a constant neutron flux.
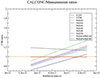 |
Fig. 2. Evolution of C/M ratios related to isotopic concentrations as a function of irradiation time (with constant neutron flux). |
Reminder: fissions on the 238U isotope are only caused by fast neutrons. In this example, 201 evolution calculations were performed using only a few minutes of computer time.
4.7. Research to be developed: study of isotopic vector perturbations
A nuclear phenomenon creates isotopes and/or modifies the isotopic distributions of natural elements. The extent of these disturbances depends on the intensity of the phenomenon and the effective cross-sections involved. In the case of natural reactors, measurements of the isotopic concentrations of fission products have made it possible to determine the characteristics of fission chain reactions [6, 14] (see Appendix B). Isotope analyses of constituent elements or traces of elements included in a medium can be used as a marker of nuclear phenomena. We illustrate this point with results deduced from MENDEL calculations for three gangue elements: Fe, H, and K. The variations in isotopic concentrations for the sample numbered 402 compared with the initial state for 57Fe, 2H, and 40K reach 3.54%, 66% and 117% respectively, but the perturbations calculated for each isotopic ratio are limited: 0. 074%, 0. 01% and 0. 014%. Disturbances are masked due to the low proportion of the isotope concerned in the natural element. The list of interesting tracers can be obtained from the evolution calculations performed with the MENDEL software. These include lithium and boron.
4.8. Decay heat comparisons: Oklo ore with and without fissions
At the end of fission chain reactions, a so-called decay heat is released by the active fission products created during the fission reactions. As an example, using the characteristics of the sample denoted M, studied in 1972, for 0.2 kg of ore with a metal content equal to 50%, the power emitted by fission varies from 0.0471 W to 0.0225 W between the start and the end of the fission chain reactions (with a constant neutron flux). One tenth of a second after the chain reactions have stopped, the residual power reaches 1.649 10−3 W, while at the same instant the same quantity of unirradiated ore emits 4.416 10−6 W. In modern times, i.e. 2 billion years later, the two previous quantities reach 6.851 10−6 W and 7.006 10−6 W respectively [16].
4.9. Interest of the 236U isotope
As early as 1972, the observation [5] of the absence of the uranium isotope 236 in ore confirmed the age of nuclear reactions (period = 23.42 million years). Measurement of the 236U/238U ratio shows or disproves the existence of late fission, with perhaps of low intensity (see Tab. 9).
Concentrations of 236U and 238U as a function of time after the end of the chain reactions.
4.10. Orders of magnitude and energy deposition distributions (natural reactors)
With our assumptions, the energy deposited as a result of fission, expressed in watts/kg in a homogeneous core, is between 0.2 W/kg and 0.1 W/kg. 86% of this power is deposited in situ (except for migration by leaching) since it comes from fission fragments. The distances covered by other radiation range from micrometers for α-radiation to tens of centimeters for fast neutrons. The classification of radiation by particle gives access to biological effects [41]. The study presented in reference [37] gives an example of nanobiology. The values of the conventional fluxes (see Sect. 3.2 item 3) associated with the nuclear constants [42] give a posteriori access to doses received by ingestion in a living organism (using the WESTCOTT formalism).
4.11. Restitution factor
The definition of the restitution factor C* is given in paragraph 3.4.2. This factor was introduced by Naudet [14]. Figure 3 represents its evolution as a function of time counted from the start of the chain reactions. This factor was determined from the analytical expressions of the concentrations of 235U and 239Pu as a function of time. The numerical applications use the CALCONC software (see Sect. 3.5).
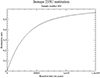 |
Fig. 3. Restitution factor (sample number 402). |
Remember that these values of the parameter C* correspond to the initial composition given in Appendix A (sample 402). The depletion of 235U greatly contributes to the increase in these values as a function of time. Naudet [14] studied the influence of the reactor characteristics (235U anomaly, water and poison contents, etc.) on all neutron parameters. In particular, the values of the parameter C* vary between 0.45 and 0.6.
4.12. Critical analysis of our qualification process
We summarize below the main uncertainties and approximations which impact our results.
We have chosen to access the absolute values of the quantities linked to irradiation levels starting from an initial state defined a priori. We qualify our calculations based on measured values of isotopic concentrations. These absolute values are obtained using the local density of the ore sampled. Our concentration values therefore present an uncertainty concerning this density. The calculation/measurement ratio requires cleaning up the raw measurements to eliminate the contribution of the natural element. This operation is simple and reliable for neodymium analyses. It becomes more complicated for samarium and even impossible for europium. The origins of the cleaning up difficulties are discussed in Appendix C.
Our calculations include several simplifying assumptions which contribute to degrading the quality of the results. The first hypothesis is the absence of taking into account the restitution factor C* to calculate the neutron fluence. This leads to underestimating this quantity during the duration of fission reactions. This fluence value is used for the evolution calculations carried out by the MENDEL software. This calculation takes into account all nuclear reactions including the restitution phenomenon of 235U. Such inconsistency leads to overestimating the final concentration of this 235U isotope. We note this disagreement. A value of the restitution factor C* could be estimated at the end of this first transport/evolution calculation. By estimating the fluence with this restitution value, it would be possible to correct this inconsistency. This new estimation is only justified in the absence of other imperfections.
A second approximation concerns the existence of a time-independent neutron spectrum. To remedy this defect, we are considering coupled transport/evolution calculations (see our Conclusion). In the frame of this study, a difficulty linked to the modeling of the system will appear. Carrying out such calculations requires knowledge at any time of the neutron flux or the power released by fissions. Various hypotheses can be considered in connection with models of partially erratic operation of the reaction zones [18, 21].
Analysis of the density of fissions produced in sample 402 allows us to assess the precision of our calculations. Table 10 represents a comparison between the measured values and the calculated values for the fission density. The measured values (Columns C1 and C2) are obtained using the depolluted concentrations of neodymium isotopes and the corresponding fission yields. Column C1 corresponds to 8.2% fission by fast neutrons of 238U. In column C2, we assumed that all the fissions were 235U fissions by thermal neutrons. Column C3 corresponds to the results of the calculation carried out with the MENDEL software. In column C4, the calculated value was obtained using the fission cross section and the associated fluence (Appendix A and Tab. 2).
Density of fissions in ore per cm3 (in 1019 fissions/cm3).
The accuracy achieved on today's state with this blind calculation is of the magnitude order of 20% starting from the initial state of the ore.
5. Conclusions
Our objective was to show the possibility of calculating the values characterizing the irradiation levels in environments similar to the Oklo reaction zones. The analysis of the calculation/measurement ratios allowed to estimate the uncertainties on these quantities calculated in absolute values. These uncertainties are the order of 20% or even lower. We consider that this accuracy is acceptable to feed the debate on the problem: ‘could nuclear radiation affect the evolution of Life forms?’
The qualification of the calculations was obtained by interpreting isotopic measurements blindly on an extreme case: that of the Oklo, Gabon reaction zones. Moreover, we plan to examine the situations corresponding to low radioactive lagoon environments. In these hypothetical situations the fluences are lower than those encountered in natural reactors.
Furthermore, for our qualification we impose a priori the initial state of these environments. In the case of natural reactors, power variations are complex. Two hypotheses degrade the precision of our calculations: the use of a constant neutron spectrum during the reactions and the definition of a constant flux associated with the initial state. The value of this flux is obtained by concealing the significant effect of restitution of the 235U. This effect is specific to Oklo's natural nuclear reactors. This particularity is due to the intensity, the age and the duration of the fission chain reactions. To obtain better accuracy, it is necessary to take into account the isotopic measurements carried out today on integrator fission products. Such measurements, like those relating to Neodymium, characterize the number of fissions released throughout the duration of the phenomenon. The isotope concentrations resulting from the calculations can then be adjusted in absolute values. This principle had been used since 1972 to characterize the Oklo phenomenon.
At the end of this first article, several developments are possible. The numerical processes implemented in the MENDEL software allow the calculation of isotopic concentrations with time scales ranging from seconds to a billion years. Furthermore, measurements of isotopic concentrations have now acquired great sensitivity, allowing access to any isotopic anomaly. These two qualities can be used to characterize nuclear phenomena of human or other origin (pollution, contamination, etc.) by analyzing the isotopic vectors of certain markers.
We have shown the importance of the restitution phenomenon of the 235U. This phenomenon is linked to the age and concentration of the uranium deposit in the Oklo reaction zones. This restitution contributes to the release of energy during geological periods. Staying within the context of natural reactors, the high values of neutron fluences encountered (beyond 1020 n/cm2) require taking into account the temporal evolutions of the neutron spectra. This work is in progress with the use of version V12 of the TRIPOLI-4® software. It is then possible to directly access the absolute values of all isotopic concentrations. We thus have a tool capable of determining the material assessment in a nuclear reaction zone. These assessments can be useful for the second topic which arose during the conference/debate organized by SFEN/PACA: “Can the Oklo reaction zones (RZ) be useful for studies of radioactive waste storage?”
It seems interesting to us to continue reflection on the effectiveness of this cleaning-up of isotopic measurements. We had studied an (overly) theoretical approach based on the search for maximum likelihood. This approach comes up against a lack of knowledge on the covariances of quantities resulting from measurements and/or calculations. A simpler solution is currently being studied. It uses the notion of “distance” between the two vectors characterizing first for the natural isotopy and second for the isotopy of the element produced by nuclear reaction.
To return to our initial topic, knowledge of energy deposits (classified by types of radiation) can stimulate debates with radiation geneticists. This involves estimating the probability of mutation of Life forms following these irradiations, the intensity of which would result from the type of calculations that we are proposing. These calculations require information on the nature of the environments. Knowledge of hydrogenated materials (water, organic matter, etc.), the concentration of uranium and for neutron absorption elements (boron, rare earths, etc.) is important for neutronic reasons. The involvement of geologists [23, 25, 27] and physicists [17, 21] is thus essential to define the initial characteristics of radioactive environments likely to contain traces of past life forms. To sustain the debate with radiation geneticists and following various discussions [35, 46] we are in the process of estimating irradiation levels in lagoon radioactive environments and in river deposits.
We must also consider the use of other less direct techniques, such as thermoluminescence used in paleontology (see December 1972 meeting with the DP (CEA/FAR at the time) and Tazieff).
Acknowledgments
We would like to thank: Cheikh Diop (CEA, Direction of Energies) for numerous discussions and proofreading, Frank Carré (CEA, Direction of Energies), Akiviadis Gourgiotis (IRSN, Radioactive Waste and Geosphere Transfer Service), Benoît Gall (University of Strasbourg CNRS, IPHC UMR 7178), Laurence Blanchard (CEA, Direction of Fundamental Research), Loïc Le Noir de Carlan (CEA, Direction of Energies), the TRIPOLI-4® staff (CEA, Direction of Energies), Fadhel Malouch (CEA, Direction of Energies), Éric Dumonteil (CEA, Direction of Fundamental Research) for their fruitful exchanges, Jean-Philippe Girard for organizing the SFEN/PACA meeting, Laurence Lebaron-Jacob (CEA, Direction of Fundamental Research) for sending many references and Thérèse Vergnaud for all her relevant proofreading. I don’t forget my wife's patience. The initial translation was edited, corrected and proofread by Elizabeth Couvert, whom we thank.
Funding
This research did not receive any specific funding.
Conflicts of interest
The authors declare that they have no competing interests to report.
Data availability statement
This article has no associated data generated and/or analysed/Data associated with this article cannot be disclosed due to legal/ethical/other reason.
Author contribution statement
Jean-Claude Nimal wrote this version of the paper, designed the CALCONC software and performed the transport/criticality calculations with the TRIPOLI-4® software. Tan Dat Huynh and Aimé Tsilanizara performed the evolution calculations with the MENDEL software. All authors discussed the results and contributed to the final manuscript.
Appendix A
This appendix contains the values of the isotopic concentrations used in the transport/criticality calculation relating to sample 402-02. They are expressed in 1024 atoms per cubic centimeter in Tables A-1 and A-2. These values are those of the ore just before the period of fission chain reactions (initial state).
Isotopic composition of ore (sample 402-02) in 1024 atoms per cubic centimeter.
Isotopic composition of gangue in 1024 atoms per cubic centimeter.
The concentration values (between brackets) correspond to three isotopes present in trace amounts (10B, 232Th and 239Pu). Their low concentration does not perturb transport calculations. Their presence allows to obtain, after condensation, the cross sections in the desired energy structures.
The geometric model used is described in paragraph 4 in the main text. The thickness of the uranium vein, i.e. 63 cm, was obtained after a search for the critical state.
The transport/criticality calculation makes it possible to obtain the cross sections and the neutron fluxes using two energy structures: with 172 energy groups and one group (see Sect. 3.1). Table A-3 reproduces the main values of microscopic cross sections in the one-group structure (sample numbered 402, case 402-02).
Cross sections of isotopes undergoing fissions.
This calculation also gives access to the microscopic cross sections for capturing stable or unstable isotopes of three elements produced by fission: neodymium, samarium, europium. These one-group cross section values allow a simple calculation of the isotopic concentrations of these three elements produced by fission. The percentage of fast neutron fissions caused on the 238U isotope is 8.2% (neutron spectrum at initial state).
The cross sections are independent of the neutron source intensity since the solution of the transport equation is linear with respect to the sources. Appendix B describes the process used to estimate the fluence and then flux values necessary to calculate the time evolution of isotopic concentrations. Apart from the uncertainties relating to the chemical compositions, the initial model includes an approximation: the initial value of the 238U concentration that we use is deduced from today's value assuming that this has not been modified by the nuclear phenomenon. The evolution calculations carried out with the MENDEL software give the decrease factor during nuclear reactions: 0.9916. This value is only attributable to neutron absorption reactions (the duration of nuclear reactions is negligible compared to the half-life of 238U).
Appendix B
Appendix B presents an analysis of the differences between natural nuclear reactors and very ancient radioactive lagoon environments (Sect. B.1). These differences impact the processes for calculating the neutron fluence and the energy released during nuclear reactions (Sect. B.2).
Two approaches allow to determine the fluence in a reaction zone. The first is classic: it uses the knowledge acquired today, that of the so-called final state. The second imagines a mode of temporal variation of the phenomenon starting from the initial state 2 billion years ago. It is the only one usable for a hypothetical radioactive environment.
B.1. Two modes of time evolution for the nuclear phenomenon
For radioactive lagoon environments, the power and intensity of the radiation emitted simply depend on the initial uranium concentrations in this environment. The age of uranium affects the distribution between 235U and 238U. On a macroscopic scale, these radiations are emitted in a deterministic way: emissions follow the exponential laws of radioactive decay. Induced fissions correlated with the reactions (α,n) are added to these emissions. The importance of these last two reactions depends on the composition of the medium. For the lagoon environments that we are studying, all the radiation sources are deterministic and can be calculated when the initial state of the environment is known or imposed. From these particle sources, transport calculations provide access to the absolute values of all quantities, in particular for energy deposits at any time.
The situation is very different, even opposite, in the case of natural nuclear reactors. Our aim here is not to explain the operating modes of these nuclear reaction zones. Geologists [23–25] and neutronics [14, 17, 18, 21] have studied these very complex phenomena. Following the oxygenation peak (GOE), a period of uranium dissolution allowed the uranium to migrate. This element was then deposited deep within environments containing reducing agents such as organic matter. The local presence of hydrogenated matter and rare earths allowed the triggering and then the control of fission chain reactions. The consumption of rare earths played the role of consumable poisons during the decrease in uranium concentration. At the end of this period of fairly regular power, a more erratic regime took place. Changes in chemical compositions and variations in temperatures and pressures contributed to this complex regime. With such a situation, it would be illusory to define the temporal variations of the neutron flux and the power variations for a given ore sample.
B.2. Estimation of fluence in a reaction zone (RZ)
Despite the operating mode of the natural reactors, it is possible to access the fluence and the power integrated over the entire duration of the chain reactions. Time evolution calculations can use two origins for the necessary information: either from the final state or from the initial state.
B.2.1. An estimation based on final state
This first procedure is based on the analysis of the final state, that is to say on today's state. Measurements of isotopic concentrations of certain stable fission products meet this requirement. After the cleaning-up of the measurements, the value of the fission number integrated over the duration of the phenomenon and that of the fluence are reliable. With this procedure, the absolute values of all the calculated quantities are consistent with each other; they are normalized on the measurements.
This first approach is simple and precise provided that isotopes whose formation is not very sensitive to the temporal distribution of fissions are retained.
This approach was used in 1972 to prove the existence of fission reactions and then to quantify the number of fissions having taken place in an ore sample. In August 1972, G. Vendryes [6, 7] and myself determined this fission rate using the results of isotopic concentration measurements (Nd, Eu, Sm) carried out by Dozol [43]. After correction of these measurements (see Sect. 3.6 of the main text) for their pollution by the natural element, the use of fission yields immediately gives access to the fission rate. This simple procedure does not require any neutron transport calculations. An improvement consists of considering the concentrations of two pairs of isotopes: [143Nd + 144Nd] and [145Nd + 146Nd]. Additional information is provided with the measurement of the 148Nd concentration. The latter is commonly used for studies of spent fuel in PWRs (Pressurized Water Reactors). The concentration of 148Nd and those of the two pairs of Neodymium isotopes are not very sensitive to neutron fluence for a fixed number of fissions. This property results from the values of the capture cross sections and of the resonance integrals of these isotopes (see Tab. B-1). The transfer by neutron capture of odd isotopes to even isotopes is the origin of this property.
Thermal neutron absorption cross sections (at 2200 m/s, barn/atom) and resonance integrals (barn/atom).
An improvement to this procedure consists of taking into account the distribution of fissions among the three fissile species: 235U, 239Pu and 238U (the latter isotope having only fission with fast neutrons). This distribution can be obtained either by transport calculations or directly by interpretation of certain particular isotopic ratios. In the case of the element neodymium, the isotope 150Nd makes it possible to appreciate the importance of fissions on 238U by fast neutrons. For example, taking into account 8% of fissions by fast neutrons on 238U (value from our calculations) leads to variations of –0.12% and +8.3% on the concentrations of the isotopes 145Nd and 150Nd. Table B-2 [45] gives the yields on the 3 species.
Fission yields for induced fission on several isotopes (235U, 238U and 239Pu).
More generally, any particularity of an isotope concerning the values of nuclear data (resonance integral, fission yield, etc.) provides access to neutron characteristics (fast neutron importance, fission distribution, etc.). This information can be used without the participation of transport calculations.
B.2.2. An estimation based on initial state
This first procedure that we have just described requires having measurements of isotopic concentrations currently carried out. It is therefore inapplicable for any hypothetical situations such as radioactive lagoon environments. An alternative procedure consists of defining an initial state and associating a neutron fluence to this initial state. This is the procedure that can be used for a radioactive lagoon environment. The fluence is deducted from the 235U lack measured today (see Sect. 3.4.2). The phenomenon of restitution of this isotope constitutes the first difficulty. The second difficulty encountered is the transition from the fluence to its temporal distribution (i.e. the neutron flux).
Nevertheless, we chose this second procedure because it corresponds to the lagoon situations that we are going to deal with. This qualification therefore consists of analyzing the calculation/measurement ratios available for a given ore sample. This procedure has the disadvantages which have been pointed out above.
Appendix C
The chemical components in a sample being measured have two origins. The first origin is the nuclear phenomenon itself. The second origin results from the presence of natural elements existing before the nuclear phenomenon or brought during or after it. The depollution phase consists of eliminating the contribution of the natural element from the raw measurements. These cleaned up values constitute the current witnesses of the nuclear phenomenon studied. They allow physicists to describe the characteristics of the nuclear phenomenon such as its power, its duration, its age or even the neutron spectrum.
Cleaning up methods require some simplifying assumptions. Firstly, the isotopic distribution measured today has not been modified over time by other nuclear or chemical phenomena. In particular, we assume that the isotopy of the natural element has not been disturbed by the nuclear phenomenon. Calculations carried out with the MENDEL software could take into account possible pollution prior to the phenomenon. In this case, it is essential to know the composition of the chemical species present before the phenomenon.
We consider a sample subjected to isotopic measurements. These measurements relate to an element comprising Nk isotopes, each isotope is identified by an index k. We define the following partial concentrations expressed in nuclei per unit volume:
-
Ck is the unknown concentration of the isotope numbered k and formed by the nuclear reaction.
-
C0 is the total number of nuclei of the element formed by the nuclear reaction.
-
Mk is the measured number of nuclei of the isotope “k”.
-
M0 denotes the total number of nuclei of this element.
-
γ is the proportion of the natural element present in the measured sample, this parameter measures pollution.
-
fk proportion of the isotope “k” in the natural element.
-
mk proportion of the isotope “k” obtained by the measurement.
-
ck proportion of the isotope “k” in the element produced by the nuclear phenomenon.
The proportion of the isotope “k” obtained by the measurement is written in the form (C-1):
 (C-1)
(C-1)
Without knowing the value of the concentration C0, we assume that the proportion ck of the isotope numbered k is known (a simple approximation consists of using the distribution of fission yields for 235U). If all of the measured quantities Mk did not present uncertainties, it would be possible to obtain a single value for the quantity γ (the quantity fk is assumed to be well known). This is the relation (C-2):
 (C-2)
(C-2)
The concentration of nuclei marked k and produced from the nuclear reaction would be obtained by the relation (C-3):
 (C-3)
(C-3)
Examining the relationship (C-2) allows us to confirm two intuitive properties:
-
When the isotopic distribution of the natural element is close to that of the element resulting from nuclear reactions then the measurement must tend towards the common isotopic distribution. In this case the relationship (C-2) is indeterminate. It becomes very sensitive to all uncertainties.
-
Consider the important case of a significant differentiation between the natural isotopic distribution and the distribution of the element resulting from nuclear reactions. In this case, when the measurement approaches the nuclear isotopic distribution, then the depollution is low.
This relation (C-2) shows the interest of isotopic measurements carried out on neodymium. The absence of the isotope 142 in the fission products (see Appendix B, Tab. B-2) and the high proportion of this isotope (27.13%) in the natural element lead to a precise value of pollution parameter γ. This property was used in 1972 [5, 6] to demonstrate the existence of fissions. Dozol and Naudet have extended this type of evaluation to samarium and europium.
The relation (C-2), useful for mathematical studies, hides a much more complex reality: by applying this relation (C-2) to the Nk isotopes we would obtain Nk values of γ since the measurements and calculations present uncertainties. A possible approach consists of considering the pollution parameter γ as a random variable for which we would have Nk correlated observations γk. It is then possible to define a better estimate of γ using the linear combination (C-4) with a weight normalization condition.
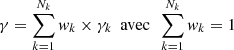 (C-4)
(C-4)
where wk is the weight associated with the observation γk.
In software currently under development, the weights wk are obtained by minimizing the variance estimated on γ. This optimization, based on simulated annealing, was not successful due to lack of covariance data on the measured or calculated quantities.
We previously mentioned the vague notion of differentiation between two isotopic distributions: that of the natural element and that of the element produced by nuclear reactions. We propose to introduce the notion of distance between these two distributions. This distance D can be defined by the expression (C-5):
 (C-5)
(C-5)
In this relation (C-5), it is essential to take into account the normalization to unity of the two isotopic distributions. With this condition, the relation (C-6) can be deduced
 (C-6)
(C-6)
References
- TRIPOLI-4®, CEA, EDF and AREVA reference Monte Carlo code, https://doi.org/10.1016/j.anucene.2014.07.053 [Google Scholar]
- TRIPOLI-4®, Version 4 Manuel de l’utilisateur. Rapport CEA-R-6170 (2008); in French [Google Scholar]
- DARWIN: An Evolution Code System for a Large Range of Applications, CEA, https://doi.org/10.1080/00223131.2000.10875009 [Google Scholar]
- MENDEL depletion code, https://doi.org/10.1051/snamc/201402409 [Google Scholar]
- R. Bodu, H. Bouzigues, N. Morrin, J.P. Pfiffelmann, Sur l’existence d’anomalies isotopiques rencontrées dans l’uranium du Gabon, C. R. Acad. Sci., Paris 275, 1731 (1972) [Google Scholar]
- J.-C. Nimal, CEA, Septembre 1972; in French (unpublished internal report) [Google Scholar]
- G. Vendryes, Le “père” des réacteurs à neutrons rapides; préface de Y. Brechet. Textes rassemblés sous la direction de C. Clouet d’Orval. Collection: Les grands acteurs du CEA. Un chapitre est consacré au phénomène d’Oklo [Google Scholar]
- J.-L. Nigon, CEA, Septembre 1972; in French (unpublished internal report) [Google Scholar]
- A. El Albani et al., Large colonial organisms with coordinated growth in oxygenated environments 2.1 Gyr ago, Nature 466, 100 (2010), https://doi.org/10.1038/nature09166 [CrossRef] [Google Scholar]
- P.K. Kuroda, On the Nuclear Physical Stability of the Uranium Minerals, J. Chem. Phys. 25, 781 (1956) [CrossRef] [Google Scholar]
- P.K. Kuroda, On the Infinite Multiplication Constant and the Age of the Uranium Minerals, J. Chem. Phys. 25, 1295 (1956) [CrossRef] [Google Scholar]
- J. Noetzlin, Volcanisme et chimie nucléaire, C. R. Acad. Sci. 208, 1100 (1939)(séance du 27 mars 1939) [Google Scholar]
- J.F. Dozol Ichlera, (Strasbourg June 2022) From routine sample measurements in CEA to the Oklo phenomenon. Radiation Protection Dosimetry, Vol. 199, Issue 18, November 2023, pp. 2258–2261, https://doi.org/10.1093/rpd/ncad014 [Google Scholar]
- R. Naudet, Oklo: des réacteurs nucléaires fossiles – étude physique, Paris, Éditions Eyrolles, Série Synthèses, 1991; in French [Google Scholar]
- F. Gauthier Lafaye Ichlera, (Strasbourg June 2022) The Oklo phenomenon, first questions, first answers. Radiation Protection Dosimetry, Vol. 199, Issue 18, November 2023, pp. 2251–2257, https://doi.org/10.1093/rpd/ncad044 [CrossRef] [Google Scholar]
- J.C. Nimal Ichlera, (Strasbourg June 2022) Historical simulations of Oklo cores. Radiation Protection Dosimetry, Vol. 199, Issue 18, November 2023, pp. 2262–2268, https://doi.org/10.1093/rpd/ncad043 [CrossRef] [Google Scholar]
- S.E. Bentridi Ichlera, (Strasbourg June 2022) The Influence of some rare earth elements as neutron absorbers on the inception of Oklo natural reactors. Radiation Protection Dosimetry, Vol. 199, Issue 18, November 2023, pp. 2269–2274, https://doi.org/10.1093/rpd/ncad048 [CrossRef] [Google Scholar]
- B.J.P. Gall Ichlera, (Strasbourg June 2022) Parallel between natural Oklo cores and industrial reactors operating. Radiation Protection Dosimetry, Vol. 199, Issue 18, November 2023, pp. 2279–2287, https://doi.org/10.1093/rpd/ncad034 [CrossRef] [Google Scholar]
- A. El Albani Ichlera, (Strasbourg June 2022) The Gabonionta: great Oxidation Event, reactors and life. Special session Oklo’50 Anniversary, 10th International Conference on High Level Environmental Radiation Areas, Strasbourg, 27–30 June 2022, https://indico.in2p3.fr/event/19295/attachments/54322/102387/programme%20ICHLERA%2020220627-Chair.pdf [Google Scholar]
- D. Louvat Ichlera (Strasbourg June 2022) Oklo natural analogue of radioactive waste disposal, summary of European Commission projects’results. Special session Oklo’50 Anniversary, 10th International Conference on High Level Environmental Radiation Areas, Strasbourg, 27–30 June 2022, https://indico.in2p3.fr/event/19295/attachments/54322/102387/programme%20ICHLERA%2020220627-Chair.pdf [Google Scholar]
- S.-E. Bentridi, B. Gall, F. Gauthiet-Lafaye, A. Seghour, D.E. Medjadi, Inception and evolution of Oklo natural reactors, C. R. Geosci. 343, 738 (2011) [CrossRef] [Google Scholar]
- P. Girard, Compte rendu: SFEN CR Conf 17-10-2018-MRS; in French [Google Scholar]
- F. Weber, Une série précambrienne du Gabon: le Francevillien, sédimentologie, géochimie, relations avec les minéraux associés Thèse soutenue le 9 Octobre 1969. Rapport CEA-R-4054 (1971); in French [Google Scholar]
- F. Gauthier-Lafaye, F. Weber, Natural nuclear fission reactors: time constraints for occurrence, and their relation to uranium and manganese deposits and to the evolution of the atmosphere, Precamb. Res. 120, 81 (2003) [CrossRef] [Google Scholar]
- F. Gauthier-Lafaye, F. Weber, Natural nuclear fission reactors: time constraints for occurrence, and their relation to uranium and manganese deposits and to the evolution of the atmosphere Centre de Géochimie de la Surface, EOST-UMR7517, CNRS-ULP, 1, rue Blessig, 67084 Strasbourg Cedex, France [Google Scholar]
- A. El Albani, R. Macchiarelli, A. Meunier, Aux origines de la Vie. Une nouvelle histoire de l’Evolution. Dunod 2016 [Google Scholar]
- A. El Albani, R. Macchiarelli, A. Meunier, Comment tout a commencé sur la Terre. Le récit d’une incroyable découverte Editions humen Sciences/Humensis, 2019 (dessins par ADELINAA) [Google Scholar]
- L. Blanchard, CEA/DRF (private communications) [Google Scholar]
- S. Lim, J.-H. Jung, L. Blanchard, A. De groot, FEMS Microbiol. Rev. 43, 19 (2019); in French. Communiqué de presse CNRS/INSB et CEA/DRF: Les ressources insoupçonnées de la nature pour résister aux radiations [CrossRef] [Google Scholar]
- A. Beauger, S. Larrue, GEOLAB-CNRS/Université Clermont Auvergne/Université Limoges. Effet de la radioactivité naturelle sur les diatomées des sources minérales; in French, https://inee.cnrs.fr/fr/cnrsinfo/leffet-de-la-radioactivite-naturelle-sur-les-diatomees-des-sources-minerales [Google Scholar]
- F. Millan, A. Beauger et al., The effect of natural radioactivity on diatom communities in mineral springs, Bot. Lett. 167, 95 (2020), https://doi.org/10.1080/23818107.2019.1691051 [CrossRef] [Google Scholar]
- E. Dumonteil, CEA/DRF/IRFU/DPhN) (private communication) [Google Scholar]
- P.C.M. Petit, C. Rivasseau et al., Incroyable découverte: Variovorax, une bactérie qui vit au cœur d’un réacteur nucléaire en fonctionnement! (réacteur OSIRIS), https://joliot.cea.fr/drf/joliot/Pages/Actualites/Scientifiques/2020/Variovorax-bacterie-vivant-c%C5%93ur-reacteur-nucleaire.aspx [Google Scholar]
- Direct Meta-Analyses Reveal Unexpected Microbial Life in the Highly Radioactive Water of an Operating Nuclear Reactor Core, Microorganisms, 2020, 8, 1857; https://doi.org/10.3390/microorganisms8121857 [CrossRef] [Google Scholar]
- A. Gourgiotis, IRSN/PSE-ENV/SEDRE/LELI (private communication) [Google Scholar]
- C. Villagrasa, et coll, Geant4-DNA simulation of DNA damage caused by direct and indirect effects and comparison with biological data. ICRS-13 & RPSD-2016 conference [Google Scholar]
- S. Meylan, Développement d’un outil de simulation multi-échelle au calcul des dommages radio-induits précoces dans des cellules exposées à des irradiations d’ions légers (proton et alpha) Thèse soutenue le 21 octobre 2016; in French [Google Scholar]
- S. Agostinelli et al., Geant4 – A simulation toolkit, Nucl. Instrum. Methods Phys. Res. A: Accel. Spectrom. Detect. Assoc. Equip. 506, 250 (2003) [CrossRef] [Google Scholar]
- A. Santamarina, D. Bernard, P. Blaise et al., The JEFF-3.1. 1 nuclear data library, JEFF Rep. 22, 2 (2009) [Google Scholar]
- S.T. Perkins, D.E. Cullen, S.M. Selzer, Tables and Graphs of Electron-Interaction Cross Section from 10 eV to 100 GeV Derived from the LLNL Evaluated Electron Data Library (EEDL), Z=1−100, Lawrence Livermore National Laboratory, USA, UCRL-50400, Vol. 31, November 1991; DOI: 10.2172/5691165 [Google Scholar]
- H. Metivier, coordinateur, Radioprotection et ingénierie nucléaire; collection Génie Atomique; INSTN (EDP sciences); in French [Google Scholar]
- B. Pritychenko, S.F. Mughabghab, Neutron Thermal Cross Sections, Westcott Factors, Resonance Integrals, Maxwellian Averaged Cross Sections and Astrophysical Reaction Rates Calculated from the ENDF/B-VII.1, JEFF-3.1.2, JENDL-4.0, ROSFOND-2010, CENDL-3.1 and EAF-2010 Evaluated Data Libraries, Nucl. Data Sheets 113, 3120 (2012) [CrossRef] [Google Scholar]
- J.F. Dozol, M. Neuilly, Analyse isotopique des terres rares contenues dans le minerai d’OKLO Rapport IAEA-SM-204/29 (Libreville 1975); in French [Google Scholar]
- R. Naudet, C. Renson, Résultats des analyses de teneurs isotopiques de l’Uranium. Rapport IAEA-SM-204/23 (Libreville 1975) [Google Scholar]
- IAEA.org fission yields. Source JEFF 3.1.1 [Google Scholar]
- B. Gall (University of Strasbourg CNRS, IPHC UMR 7178) (private communication) [Google Scholar]
Cite this article as: Jean-Claude Nimal, Tan-Dat Huynh, Aimé Tsilanizara. Has natural radioactivity contributed to the evolution of living organisms? Validation of a dedicated calculation scheme (for isotopic concentrations and deposited energies) on Oklo's natural nuclear reactors, EPJ Nuclear Sci. Technol. 11, 22 (2025). https://doi.org/10.1051/epjn/2025005
All Tables
MENDEL and CALCONC calculations of isotopic concentrations; ‘discrepancy’ is the difference between the CALCONC and the MENDEL reference values.
Concentrations of 236U and 238U as a function of time after the end of the chain reactions.
Isotopic composition of ore (sample 402-02) in 1024 atoms per cubic centimeter.
Thermal neutron absorption cross sections (at 2200 m/s, barn/atom) and resonance integrals (barn/atom).
Fission yields for induced fission on several isotopes (235U, 238U and 239Pu).
All Figures
|
Fig. 1. Neutron spectrum calculated with TRIPOLI-4® software. |
| In the text | |
|
Fig. 2. Evolution of C/M ratios related to isotopic concentrations as a function of irradiation time (with constant neutron flux). |
| In the text | |
|
Fig. 3. Restitution factor (sample number 402). |
| In the text | |
Current usage metrics show cumulative count of Article Views (full-text article views including HTML views, PDF and ePub downloads, according to the available data) and Abstracts Views on Vision4Press platform.
Data correspond to usage on the plateform after 2015. The current usage metrics is available 48-96 hours after online publication and is updated daily on week days.
Initial download of the metrics may take a while.