| Issue |
EPJ Nuclear Sci. Technol.
Volume 12, 2026
|
|
|---|---|---|
| Article Number | 12 | |
| Number of page(s) | 13 | |
| DOI | https://doi.org/10.1051/epjn/2026007 | |
| Published online | 13 May 2026 | |
https://doi.org/10.1051/epjn/2026007
Regular Article
Micro-scale characterization of brittle fracture in UO2 nuclear fuel: finite element methodology for 2D and 3D simulation
1
CEA, DES, IRESNE, DEC, Cadarache, 13108, St Paul Lez Durance, France
2
Univ. Lyon, INSA Lyon, Université Claude Bernard Lyon 1, CNRS, MATEIS, UMR5510, 69621 Villeurbanne, France
* e-mail: This email address is being protected from spambots. You need JavaScript enabled to view it.
Received:
30
July
2025
Received in final form:
10
April
2026
Accepted:
10
April
2026
Published online: 13 May 2026
Abstract
This work is conducted within the framework of nuclear fuel safety analyses involving multiscale modelling of UO2 fuel pellet fragmentation process. In this paper, a Finite Element (FE) methodology is proposed in order to enable 2D and 3D simulation of brittle fracture in micro-scale specimens used for the characterization of irradiated nuclear fuel. More specifically, these developments address Finite Element simulations using Cohesive Zone Modelling with complex shape of defects, where a direct application of Griffith’s criterion with the fracture mechanics approach is not always possible. In the case of UO2 ceramic material, the mesh refinement needed for the FE simulation of brittle fracture requires a specific attention due to the fact that the damage process zone has a characteristic size smaller than 10 nm. The main objectives are first to discuss the questions related to mesh convergence in the case of stress singularity, and secondly to enable the use of coarser meshes while maintaining accuracy compared to the converged mesh solution. The mesh convergence analysis and coarse mesh approach, established on a 2D configuration, are based on a Cohesive Zone Model (CZM) using two parameters: the critical cohesive stress σc, and the fracture energy Gc. The coarse mesh approach introduces a numerical critical cohesive stress, σc*, replacing the physical one, σc. Thanks to this approach, the relative mesh size can be increased by a ratio of ten with a deviation of the fracture load assessment smaller than 1% compared to the Griffith’s solution. The FE methodology and the coarse mesh approach are then tested with 2D and 3D simulations of a micro-cantilever bending test on a notched specimen. The simulation results are consistent with the experiment where the parameter Gc controls the fracture load. The critical stress, σc, ahead of the notch tip, can vary in the range 5–20 GPa with no effect on the fracture load. The coarse mesh approach is validated with a deviation lower than 2% compared to the fine converged mesh.
© H. Mensi et al., Published by EDP Sciences, 2026
 This is an Open Access article distributed under the terms of the Creative Commons Attribution License (https://creativecommons.org/licenses/by/4.0), which permits unrestricted use, distribution, and reproduction in any medium, provided the original work is properly cited.
1. Introduction
Nuclear fuel fracture properties are studied in the framework of safety analyses involving fuel element behavior in Pressurized Water nuclear Reactors [1]. The fuel pellet fragmentation process, under different type of loading conditions [2–4], has to be considered at various scales [5] in link with safety requirements for the structural integrity of the cladding, which is the first barrier for radioactive fission products.
The main objective of this work is to propose a robust Finite Element methodology for micro-mechanical modelling of unstable brittle fracture in UO2 in order to address questions related to the scale effect on brittle fracture properties [6, 7]. The research approach is based on experimental fracture tests, at the microstructure and engineering scales, coupled with a cohesive zone modelling approach [8, 9] for the fracture load assessment. In this paper the focus is on the Finite Element methodology needed for a 3D simulation of micro-cantilever bending tests as proposed for UO2 in [10–12].
Nomenclature
Name: Comment
FE: Finite Element
CZM: Cohesive Zone Model
 :
Remote tensile displacement on the 2D study case
:
Remote tensile displacement on the 2D study case
σ∞ : Remote tensile stress on the 2D study case
 :
Remote fracture stress on the 2D study case
:
Remote fracture stress on the 2D study case
σR: Engineering fracture stress
u1imp: Bending displacement on the micro-cantilever test
Fb: Bending load on the micro-cantilever test
G: Elastic energy release rate
Gc : Critical energy release rate or Fracture Energy
we : Elastic strain energy density
Γε : Integration path centered on the crack tip for G computation
nj : Components of the outside normal to the integration path Γε
ui : Components of the displacement field along Γε
Kn : Elastic stiffness of the cohesive law
E: Young’s modulus of the bulk material
ν: Poisson ratio of the bulk material
h: Size of the finite element, connected to the cohesive element, in the perpendicular direction to the CZM plane
k∞ : Ratio between the displacement variation in the finite element and the displacement jump in the cohesive element
δ: Jump displacement in the cohesive element
σc : Physical critical stress of the cohesive law
δc : Critical Jump displacement of the cohesive element
KI : Mode I stress intensity factor
r: Distance from the crack tip
lIrwin : Irwin’s characteristic length
σc*: Numerical critical stress of the cohesive law
In order to describe crack initiation from an existing defect in a micro-cantilever bending sample we have to consider the fracture properties relevant of the atomic scale with a pure cleavage mechanism. For this we propose to refer to UO2 atomic scale computations reported in [5, 13, 14], where the critical stress σc and the critical energy release rate (ERR) Gc are derived from molecular dynamic simulation of a tensile fracture test on a single crystal periodic cell. The critical stress, defined as the maximal stress of the tensile test for a perfect crystal in [13], is in the range 10–30 GPa for UO2 bulk. In reference [14], the fracture energy, derived from simulation of mode I crack propagation with the introduction of an initial notch in the periodic cell, is around 10 J/m2 for UO2 bulk. For UO2 grain boundaries, critical stress and fracture energies, derived from a traction separation curve in reference [15], are in the range 5–9 GPa and 2 to 5 J/m2. These high values of the critical stress result in strong mesh refinement requirement in order to be able to describe the stress singularity or concentration near the defect where crack initiation occurs. The required mesh size can be quantified with respect to the Irwin’s length lIrwin = EGc/σc2 (with E the Young’s modulus) which is a relevant parameter to analyze the size of the process zone needed for an accurate description of crack initiation. Based on the fracture properties mentioned above for UO2 bulk and grain boundaries the order of magnitude of the Irwin’s length is 10 nm.
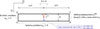 |
Fig. 1. Double Edge Notched Tension DENT geometry for the study of a perfect crack. |
This question of mesh refinement has been addressed in the literature for different type of fracture models. For example, in phase-field (PF) fracture approaches, several elements are required to correctly describe the damaged zone whose extent is proportional to the Irwin’s length. Moreover, an effective numerical critical ERR has to be used to compensate the localization error introduced by the discrete representation of the damaged zone [16–19]. The use of a PF model to represent brittle failure size effect may also be questioned when the Irwin’s length becomes in the order of magnitude or smaller than the specimen dimensions, since the PF model no longer represents the crack as a discontinuity but rather acts as a damage model where the stiffness degradation occurs within a diffused region [20].
The mesh refinement requirements also hold for models considering a discrete localized crack, such as the coupled criterion (CC) [21–23]. For instance, reference [24] recommends a mesh size lower than lIrwin/40 for the application of the CC to accurately capture the initiation length when describing crack initiation at a V-notch. In the case of cohesive zone models (CZM), a minimum mesh refinement is required ahead of the crack tip to describe the process zone. The latter size depends on the local stress state, and is generally proportional to the Irwin’s length [25–28].
In our case lIrwin is in the range of 2–20 nm, which means that the mesh size should be at least 104 or 105 smaller than the micro-cantilever bending specimen size. This mesh refinement requirement seems impossible to fulfil for a 3D model without a multilevel mesh refinement technique and large High-Performance Computing capabilities.
For this reason, the work presented in this paper proposes to analyze in detail the questions related to mesh convergence in the case of a stress singularity, and secondly to enable the use of coarser meshes while maintaining accuracy compared to the converged mesh solution. The mesh convergence analysis and coarse mesh approach are first established on a 2D configuration with a reference solution based on Griffith’s criterion for a Double Edge Notched Tension specimen. The coarser mesh approach is compared with the refined mesh solution itself validated with a convergence study and the Linear Elastic Fracture Mechanics solution. In a second part, the FE methodology, including the coarse mesh approach, is validated with a micro-cantilever bending test on a notched specimen, and the sensitivity to the critical stress σc is discussed. In a last part, a 3D simulation using the coarse mesh technique is presented for a micro-cantilever bending test with an initial crack.
2. Coarse mesh technique for a 2D DENT configuration
In order to develop the FE methodology a simplified configuration of a 2D Double Edge Notched Tension (DENT) specimen is used in order to represent a situation where crack initiation occurs mainly under mode I tensile stress state as expected in the micro-cantilever bending tests carried out on UO2.
2.1. Input data
The 2D plane strain study case is based on a Double Edge Notched Tension (DENT) specimen as represented in Figure 1. A symmetry boundary condition is used along the line AB in order to represent one half of the specimen. The tension loading is prescribed through uniform displacement boundary condition on lines DA (ux2
= 0) and BC ( ) and the corresponding mean tensile stress is named σ∞. The crack extension expected under mode I loading start from the tip along the
  direction.
Geometrical parameters of the 2D sharp crack study.
In order to define the apparent fracture stress  , corresponding to the critical value of the prescribed displacement
  , the Griffith’s criterion is used with the critical energy release rate Gc given in Table 1. The elastic energy release rate G in equation (1) is computed, on a mesh of the DENT without cohesive elements, with the crack virtual extension method using the G-theta method [29] available in the Cast3M finite element code [30].
 (1)
(1)
where G is the energy release rate for a crack extension in direction i = 1, we is the elastic strain energy density, Γε is the integration path centered on the crack tip, nj are the components of the outside normal to Γε, ui are the components of the displacement field, x1 is the spatial coordinates along the direction i = 1, dx2 is an infinitesimal length along the direction i = 2 and ds is an infinitesimal length along the integration path Γε.
The geometrical and material characteristics defined in Table 1 lead to an unstable fracture representative of the experimental results obtained for the UO2 micro-cantilever bending tests at room temperature. The tensile fracture stress σR derived from the Griffith’s criterion is equal to 1.07 GPa, the corresponding energy release rate computed with the G-Theta method is equal to 10 J/m2 (see critical value in Tab. 1). The mesh refinement used for the computation is shown in Figure 2, the energy release rate computed with the virtual extension method has a low sensitivity to the mesh size (variation smaller than 0.05% for a mesh size in the range [h = 1, D = 60] to [h = 10, D = 300]).
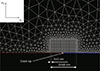 |
Fig. 2. Mesh refinement at tip of the crack for the DENT specimen (isoparametric Finite Element with linear interpolation functions and full integration). |
2.2. Unstable brittle fracture simulation with a Cohesive Zone Model (CZM)
In order to simulate the mechanical problem given in Figure 1 with a CZM, the cohesive elements are defined on the expected crack path as illustrated in the same figure. The first objective is to define the mesh refinement needed to have a converged assessment of the tensile fracture stress with the CZM, and secondly to compare this result with the Griffith’s criterion in order to verify that Linear Elastic Fracture Mechanics analysis is appropriate for this DENT study case.
The cohesive model used in our simulation, see Figure 3, is based on a bilinear traction-separation profile where the total displacement jump is equal to the sum of the elastic and inelastic contributions. The elastic displacement jump has to be as small as possible in order to be equivalent to a perfect interface in the elastic regime. To ensure this, the elastic stiffness Kn acts as a penalty factor with a value much larger than the elastic stiffness of 2D elements connected to the cohesive elements. In order to define this penalty factor independently of the mesh refinement, the parameter Kn is computed with equation (2), where E is the Young’s modulus of the bulk material, h is the size of the finite element, connected to the cohesive element, in the perpendicular direction to the CZM plane and k∞ is the ratio between the elastic displacement variation in the finite element and the elastic displacement jump in the cohesive element. equation (2) is based on an elastic model illustrated in Figure 4. In the application the ratio K∞ is equal to 1000 in agreement with a convergence study on the parameter Kn.In comparison with the calibration method proposed for the elastic normal stiffness of cohesive element in reference [31], using a mesh with cohesive elements on all the internal finite element boundaries, the parameter Kn(CN in [31]) is also a linear function of the ratio between the material Young’s Modulus and the mesh characteristic size.
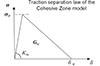 |
Fig. 3. Cohesive law for UO2: σ is the cohesive stress and δ is the displacement jump between the nodes of the cohesive element. |
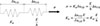 |
Fig. 4. Elastic stiffness Kn of the cohesive element: δuCE is the elastic displacement jump in the cohesive element and ΔuFE is the displacement variation in the finite element connected to the cohesive element. |
The inelastic displacement jump in the cohesive law is controlled by the critical stress σc, giving the initiation of damage and softening, and the fracture energy Gc dissipated by the fracture process. The critical displacement jump δc = 2Gc/σc corresponds to the crack opening leading to a complete fracture of the cohesive element. For the DENT application of Figure 1 the parameter Gc is equal to 10 J/m2 and the critical stress σc is defined at 15 Pa in order to have a reasonable mesh refinement constraint and to be representative of the fluorite crystal structure composing the bulk of UO2.
 (2)
(2)
The assessment of the tensile fracture stress of the DENT is derived from the load-displacement curve including the description of the unstable brittle fracture. As detailed in reference [32], the simulation of crack propagation under unstable conditions requires a specific attention to the question of convergence. The fictive path algorithm, described in [32], is used for the simulation of unstable fracture with the Cast3M finite element code according a quasi-static mechanical description. The main idea of the fictive path algorithm is to do virtual steps when a non-convergence of the Newton algorithm is detected. During these virtual steps an update of the displacements, stresses and state variables is possible according an explicit assumption. The update continue until the static equilibrium criterion is verified at the end of the “non static” phase of the fracture. Thanks to this approach, we can describe the load-displacement curve before and after the maximal load. An automatic time step refinement gives the failure load with a good precision (relative error of 10−3 compare to the maximal load) and the virtual path method enables us to follow the crack propagation during the instability.
An illustration of the FE solution obtained during the instability is given in Figure 5. On the latter, one can observe that the size of the process zone, where cohesive elements are already damaged, just before the maximal load (step 8 in Fig. 5) is approximately equal to the Irwin’s length of 8.9 nm for our material. This result confirms what is expected in this case of a sharp crack controlled by the Griffith’s criterion. The sudden crack opening, under a constant displacement loading from step 8 to step 9, is linked to the unstable crack extension induced by the elastic strain energy stored in the DENT at maximal load σ∞. This elastic energy stored at step 8 is ten times greater than the total energy needed to propagate the crack on the whole thickness of the specimen.
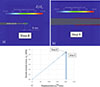 |
Fig. 5. Simulation of the unstable fracture for a DENT specimen: a) crack opening and δ/δc before instability, b) crack opening and δ/δc after instability, c) load-displacement curve. |
2.3. Mesh sensitivity analysis for the tensile fracture stress computation
The results of the mesh sensitivity analysis are given in Figure 6, where the tensile fracture stress assessed by the CZM (legend “CZM with critical stress = 15 GPa”) is compared with the Griffith’s criterion solution given in Section 2.1 (legend “Griffith’s criterion”). The mesh convergence is obtained when the mesh size near the crack tip is lower than 5 nm. The converged fracture stress is close to Griffith’s solution (relative deviation of 3%), which confirms that for our material and a sharp crack the fracture stress  is controlled by the energy release rate parameter. This analysis confirms that the mesh size has to be lower than the Irwin’s length, equal to 8.9 nm in this case.
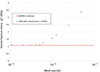 |
Fig. 6. Tensile fracture stress assessment for the DENT specimen: mesh sensitivity. |
In order to analyze the singular stress field ahead of the crack tip, the elastic cohesive stress σel, tensile stress component along the direction  , is computed with a pure elastic CZM for a loading equal to the Griffith’s tensile fracture stress of the DENT specimen. In addition, this elastic tensile stress is computed with the analytical solution σWilliams of equation (3) corresponding to the Williams singular elastic stress field for a plane strain state. These two stress assessments are compared in Figure 7, one can observe that the elastic cohesive stress computed by the pure elastic CZM is close to the Williams solution for r > 0 up to a distance of 100 nm from the crack tip. The elastic cohesive stress computed at the crack tip, with the 2 nodes of the cohesive element, has a finite value and cannot be compared directly to the Williams solution. This finite value is also proportional to the mesh size according to the
  scale effect of the Williams solution. An interesting output of Figure 7 is that for a mesh size larger than the converged mesh size (see the log scale in Fig. 7) the elastic cohesive stress, of the nodes located at r > 0, is still in agreement with the Williams solution.
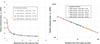 |
Fig. 7. Elastic cohesive stress concentration at the crack tip for the DENT specimen submitted to the Griffith’s tensile fracture stress. Linear scale (left), Log scale (right). |
 (3)
(3)
where σWilliams is the tensile stress in the  direction and r the distance from the crack tip in the
  direction.
2.4. Coarse mesh technique for the tensile fracture stress assessment
The proposed method follows an idea proposed in reference [27] with an artificial decrease of the critical stress of the material while keeping the fracture energy Gc constant. The assessment of the DENT tensile fracture stress with different values of reduced critical stresses are presented in Figure 8. In the latter, one can observed that the use of a larger mesh size enables a reasonable assessment of the Griffith’s tensile fracture stress (error lower than 4%) if the mesh size is lower than half of the Irwin’s length derived from the reduced critical stress. This mesh size effect is consistent with the results of the mesh sensitivity analysis described in the previous section. As commented with the results of Figure 6, one can observe that the fracture load is converged for a mesh size smaller than 5 nm approximately equal to half of the Irwin’s length for UO2. Based on this the coarse mesh technique proposes to use the numerical critical cohesive stress σc* defined with equation (4). In the latter, lEF is the size of the finite element connected to the crack tip, and the characteristic length used in the numerical calibration is taken equal to 2lEF. This value is an empirical numerical criterion identified from Figure 8 and should not be interpreted as a physical Irwin length. This approach, devoted to the simulation with a CZM of fracture controlled by the ERR parameter, is valid if the numerical critical cohesive stress σc* is high enough to ensure that the tensile fracture stress depends only on the critical energy parameter Gc. For this a lower bound value of the numerical critical cohesive stress σc* is defined with equation (5). This lower bound value  , giving the maximal acceptable mesh size, can be simply approximate by a sensitivity analysis to the numerical critical stress. For instance, with the results of Figure 8 it can be confirmed that for a mesh size of 50 nm a value of σc* greater than 3 GPa is consistent with a tensile fracture stress controlled by the Gc parameter. For practical use, it is recommended to start with two mesh refinements lEF1 < lEF2, and to test, first the mesh sensitivity with LIrwin = 2LEF2, secondly the critical stress sensitivity with the smallest mesh size lEF1 and two Irwin’s lengths equal respectively to 2lEF1 and 2lEF2.
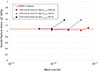 |
Fig. 8. Tensile fracture stress assessment for the DENT specimen: coarse mesh assumption. |
 (4)
(4)
 (5)
(5)
An illustration of the unstable fracture assessed with the mesh size equal to 50 nm, and a numerical fracture stress of 4.5 GPa, is given in Figure 9. The maximal displacement jump δ is lower than the critical value δc up to the maximum load, as it was the case for the finer mesh refinement presented in Figure 5. However, with the coarser mesh of 50 nm, there is only one damaged element before the onset of instability. Then after the maximum load, the displacement jump is greater than the critical value all along the crack path with a sudden drop of the remote tensile stress σ∞. In Figure 9, after step 5 the ratio δ/δc continue to increase in the element connected to the crack tip with a negligeable increase of the resulting load. When the ratio δ/δc is equal to 1, unstable crack extension starts as illustrated at the beginning of the load drop at step 8. The fact that only one element is damaged before instability reveals an important aspect of the method, namely that using the CZM with a coarse mesh is equivalent to calculating the Energy Release Rate at the crack tip in 2D or along the initial crack front in a 3D simulation. The main advantage of the method is that it overcomes the limitations of the classical ERR computational method (G − θ method or other) for a 3D analysis of crack initiation and propagation from complex sharp defects in brittle materials.
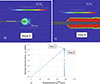 |
Fig. 9. Simulation of the unstable fracture for a mesh size of 50 nm and the numerical critical cohesive stress σc* = 4.6 GPa : a) crack opening and δ/δc before instability, b) crack opening and δ/δc after instability, c) load-displacement curve. |
These simulations confirm that, thanks to the use of the numerical critical stress σc*, the fracture stress  is still controlled by the energy release rate parameter up to a mesh size of 50 nm. This result is also consistent with the plot in Figure 7, where it can be observed that the elastic cohesive stress is in agreement with the Williams analytical solution for a mesh size up to 100 nm, which is at least 20 times greater than the maximal converged mesh size.
3. Results and discussion
3.1. Numerical validation for a 2D simulation of a micro-cantilever bending test
The objective of this section is to test the method defined in Section 2 for a DENT specimen on the micro-cantilever bending configuration. For the verification a “numerical validation” is proposed in order to compare the fracture bending load assessment obtained respectively with the CZM and the Griffith’s criterion.
3.1.1. Input data
The FE methodology is validated for UO2 with some of the experimental results obtained in reference [10] on micro-cantilever bending tests. Among the results, one notched specimen already used in reference [33] is analysed in order to test our method in a situation where the size of the defect at the origin of crack initiation is well known. The main characteristics of the micro-cantilever notched specimen are given in Figure 10. The sample corresponds to a single crystal with a rupture located on a {100} plane of the crystal basis, with a normal oriented along the direction  of the sample (see Fig. 10). The elastic properties of UO2 single crystal given on Figure 10 are extracted from reference [34]. The objective is to use a 2D plane strain simulation similar to the one used for the DENT test in order to compare the FE simulation to the experimental bending fracture load FRb. The geometrical simplifications are detailed in Figure 11 with a fixed end beam on the left. The bending load is applied with a uniform axial displacement on the right end, and the bending force is computed with the sum of the axial nodal forces associated to this displacement boundary condition. The notch is considered as a sharp crack and the cohesive element are located from the crack tip along the
  direction to simulate the experimental crack propagation. The FE mesh refinement is similar to the type of mesh used for the DENT specimen in Section 2.1 (see Fig. 2).
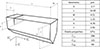 |
Fig. 10. Input data of the micro-cantilever bending test of a notched specimen. |
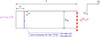 |
Fig. 11. Micro-cantilever bending test: 2D representation an boundary conditions. |
The fracture energy Gc to use with this 2D model is derived from the experimental bending fracture load and the energy release rate computed with the G_THETA method of the Cast3M code as presented in Section 2.1 for the DENT specimen. This leads to a fracture energy of 12.9 J/m2 corresponding to a fracture bending load of 0.83 mN as given in Table 2 of reference [33]. The value of Gc obtained with this 2D model seems to be a little bit greater than the maximal value of 11.7 J/m2 proposed in the Table 7 of reference [33] for fresh UO2 specimens. This deviation is probably linked to the different computational methods used for the energy release rate, crack virtual extension in this work, incremental energy release rate in [33]. This 10% difference is not an issue for our objective focused on the FE methodology needed to establish the conditions for a mesh-independent solution of the cohesive zone model, consistent with the solution of the Griffith criterion.
Mesh sensitivity analysis for the 3D study case.
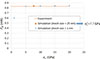 |
Fig. 12. Fracture bending load of a micro-cantilever notched specimen: sensitivity analysis of the 2D simulation to the critical cohesive stress. |
3.1.2. Validation of the FE methodology
The FE methodology is first validated with a refined mesh in order to ensure the convergence of the fracture bending load assessment. The smaller mesh size of 1 nm, tested in Section 2.3, was chosen. As the critical cohesive stress σc to be used in this notched specimen configuration is not exactly known a priori, a sensitivity analysis was performed. Values in the range 1–20 GPa were tested, in order to have some bounds representative of the bending fracture stress measured on un-notched micro-cantilever beam (< 5 GPa), and of the critical stress derived from atomic scale simulations (> 15 GPa). The simulation results are presented in Figure 12 with the experimental measure of the fracture bending load equal to 0.83 mN. As expected, there is low sensitivity to the critical cohesive stress in this configuration with a sharp crack where the fracture is driven by the ERR criterion. In Figure 12, it can be observed that the fracture bending load is underestimated for a critical cohesive stress lower than 5 GPa. This confirms that the local critical cohesive stress, near the crack tip, seems to be greater than the fracture bending stress usually measured on un-notched specimens. The sensitivity analysis provides also a possible justification for the scale effect observed between the critical cohesive stress derived from the atomistic simulation (> 15 GPa) and the fracture bending stress measured on un-notched specimens (< 5 GPa). Such a scale effect could be explained by the fact that in an un-notched micro- cantilever specimen, the local critical cohesive stress, near the crack tip, is larger than the fracture bending stress derived from the bending load. This assumption could be confirmed by experimental examinations coupled with simulation in order to assess the fracture bending load with a detailed description of the defect at the origin of the fracture. Before this, it is recommended to be careful when using the fracture bending stresses measured on micro-cantilever un-notched specimens (see Ref. [10]).
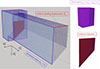 |
Fig. 13. Geometry of the 3D study case of unstable brittle fracture. |
In the second step the coarse mesh approach using equation (4) has been tested with a mesh size of 25 nm and a corresponding numerical critical cohesive stress σc* of 7.7 GPa. In order to compute σc* in the case of the anisotropic elastic behavior of UO2 single crystal, an orientation-average value Eeff = 223 GPa derived from the elastic constant given in Section 3.1.1 is used as numerical approximation in equation (4). In this case the numerical approximation enables the coarse mesh formulation to reproduce the fracture load obtained from the fully anisotropic simulation. Concerning the anisotropy of UO2, it is important to be aware that the 2D simulation result presented in Figure 12 (mesh size of 1 nm and σc > 5 GPa) and used to validate the coarse mesh approach is obtained with the anisotropic elastic behavior of UO2 described by its cubic elastic constants (see input data in Fig. 10). It means that, the reference fracture load takes into account the anisotropy of UO2 in the computation of the ERR as the results is not critical stress dependent for brittle rupture.
The coarse mesh solution is similar to the converged mesh size one ( , confirming that the numerical critical cohesive stress enables the use of sizes greater than the Irwin length without losing accuracy. In both cases, the FE methodology leads to a fracture bending load of the cohesive zone model that is consistent with the Griffith solution, based on the fracture energy Gc associated with the considered crack plane and derived from the experimental result. The coarse mesh FE approach can now be used in more complex 3D configurations where the computation of the energy release rate, needed for the Griffith’s criterion, is not always possible.
3.2. Coarse mesh method for 3D simulation of unstable fracture
The objective of this 3D application is to illustrate a practical study case of the fracture load assessment using the cohesive zone model and the coarse mesh FE method presented in the previous sections. For this, the 3D study case is based on the same input data as the one used in Section 3.1.1 with a micro-cantilever notched specimen. The mesh and the boundary conditions used for the description of the notched specimen are given in Figure 13. A constant mesh refinement is used for the cohesive elements and the mesh near the fracture plane.
Two mesh sizes of 25 and 50 nm have been tested with numerical Irwin’s length in the range 50–100 nm. The results, presented in Table 2 with corresponding numerical critical cohesive stresses, show a low sensitivity of the fracture bending load to the mesh size and to the numerical critical cohesive stress σc*. First, the results with σc* = 5.44 GPa and lEF equal 25 or 50 nm are consistent with equation (4) ensuring a converged mesh size solution. Secondly, the results with lEF = 25 nm and σc* equal 5.44 or 7.69 GPa show that the fracture load is controlled by Gc with very small effect of the critical stress in agreement with equation (5). These 3D results are also close to the 2D simulation results adjusted with the experimental fracture load in Section 3.1.
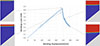 |
Fig. 14. 3D simulation results: load-displacement curve and crack propagation during the unstable fracture. |
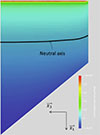 |
Fig. 15. 3D elastic analysis of the micro-cantilever bending test of a notch specimen: bending stress and neutral axis. |
The load displacement curve and crack propagation are given in Figure 14. As observed in the latter the damage along the crack front is almost uniform with very little boundary effect of the stress-free surface in the plane  . This low 3D effect is confirmed by the elastic analysis of Figure 15, where the neutral axis of the bending stress σx2x2
is almost parallel to top surface of the specimen. According the 3D simulation results, crack propagation starts on all the thickness of the specimen at the maximal bending load around 0.83 mN. The crack front shape is almost similar to the bending stress neutral axis shape. At the beginning crack propagation is unstable for approximately 260 nm, after this, the drop of the bending load continues with a decreasing slop as a function of the bending displacement, showing a transition toward a stable crack propagation. This result confirms that the fracture energy Gc = 13.3 J/m2, identified with 2D modelling, is appropriate for 3D simulation. Indeed, 2D and 3D are almost equivalent for the interpretation of a micro-cantilever bending test with a notched specimen.
. This low 3D effect is confirmed by the elastic analysis of Figure 15, where the neutral axis of the bending stress σx2x2
is almost parallel to top surface of the specimen. According the 3D simulation results, crack propagation starts on all the thickness of the specimen at the maximal bending load around 0.83 mN. The crack front shape is almost similar to the bending stress neutral axis shape. At the beginning crack propagation is unstable for approximately 260 nm, after this, the drop of the bending load continues with a decreasing slop as a function of the bending displacement, showing a transition toward a stable crack propagation. This result confirms that the fracture energy Gc = 13.3 J/m2, identified with 2D modelling, is appropriate for 3D simulation. Indeed, 2D and 3D are almost equivalent for the interpretation of a micro-cantilever bending test with a notched specimen.
4. Conclusion
The work presented in this paper proposes a FE methodology to enable 2D and 3D simulation of brittle fracture for micro-cantilever specimen with materials requiring a strong mesh refinement compare to the specimen dimension. A specific application has been presented for UO2 nuclear fuel, a ceramic materials with an Irwin’s length lower than 10 nm.
A CZM, using two parameters (critical cohesive stress σc, and the fracture energy Gc) has been used for the interpretation of unstable fracture of DENT specimen. The mesh convergence analysis has confirmed that the converged mesh size, needed for a sharp crack and stress singularity, is lower than half of the Irwin’s length. In order to reduce the computation time a coarse mesh approach has been proposed with a numerical critical cohesive stress σc*, derived from the Irwin’s length equation, replacing the physical one σc. The relative mesh size can be increased by a ratio of ten with a variation of the fracture load assessment smaller than 1% compare to the Griffith’s solution.
The FE methodology and the coarse mesh approach have been tested with a 2D simulation of a micro-cantilever bending experiment on a notched UO2 specimen. A sensitivity analysis, conducted with the converged mesh size of 1 nm, of the fracture bending load to the critical cohesive stress has been proposed. Simulation results are consistent with the experimental results if the critical cohesive stress of the UO2 crystal is in the range 5–20 GPa. This expected low sensitivity to the critical cohesive stress is consistent with the stress singularity configuration where the fracture load is controlled by the ERR parameter (with a fracture energy of 13.3 J/m2 given by the Griffith’s criterion and 2D model). The lower bound of 5 GPa is greater than the fracture bending stress usually measured on micro-cantilever UO2 un-notched specimens. This confirms that this fracture bending stress lower than 5 GPa is not a physical parameter of the UO2 crystal, and can probably not be considered directly as material data for microscopic scale as it depends on the size of the specific defect initiating the rupture in the un-notched specimen. The coarse mesh approach has been verified on this 2D configuration and the fracture bending load assessment agrees with converged mesh study and the experimental results.
Finally, the coarse mesh approach has been tested with a 3D simulation of the micro-cantilever bending test of the notched specimen used for the validation of the 2D FE methodology. The 3D results for two different mesh sizes are close to the 2D simulations and experimental fracture bending load (less than 2% deviation). This confirms the applicability of the coarse mesh approach with 3D simulation and a suitable accuracy. These new 3D results enabled us to analyze crack initiation and growth in the micro-cantilever notched specimen and to comfort the validity of a 2D model for this configuration.
This coarse mesh method is of broader interest for fracture assessment of brittle materials. More specifically when a Finite Element method using CZM is required because a direct application of the Griffith criterion with the fracture mechanics approach is not possible. In the case of UO2, the method will be used for a complementary interpretation of the micro-cantilever bending experiments. The 3D approach will enable a detailed understanding of the defects at the origin the fracture in un-notched specimen, which is essential to progress in the use of these microscopic scale fracture properties in engineering applications.
Funding
This work was achieved in the framework of a Ph-D fund by the CEA.
Conflicts of interest
The authors have no conflicts of interest to disclose.
Data availability statement
All the input data supporting results are given in the manuscript. The main simulation results are presented in the manuscript. Complementary Finite Element simulation results are available at CEA and can be provided if required.
Author contribution statement
Conceptualization, All.; Methodology, H.M., A.D., JMG and B.M.; Software, H.M. and B.M.; Validation, All; Formal Analysis, All; Investigation, All.; Resources, J.M.G. and B.M.; Data Curation, H.M. and I.Z.A.; Writing – Original Draft Preparation, H.M. B.M.; Writing – Review & Editing, All; Visualization, H.M. and B.M.; Supervision, J.M.G., A.D. and B.M.; Project Administration, J.M.G. and B.M.; Funding Acquisition, J.M.G. and B.M.
Acknowledgments
The authors would like to thank Pascal Bros as the leader of the project supporting this research activity.
References
- C. Introïni, I. Ramière, J. Sercombe, B. Michel, T. Helfer, J. Fauque, ALCYONE: the fuel performance code of the PLEIADES platform dedicated to PWR fuel rods behavior, Ann. Nucl. Energy 207, 110711 (2024), https://doi.org/10.1016/j.anucene.2024.110711 [Google Scholar]
- B. Michel, J. Sercombe, G. Thouvenin, R. Chatelet, 3D fuel cracking modelling in pellet cladding mechanical interaction, in Engineering Fracture Mechanics, Local Approach to Fracture (1986-2006): Selected papers from the 9th European Mechanics of Materials Conference (2008), Vol. 75, pp. 3581–3598, https://doi.org/10.1016/j.engfracmech.2006.12.014 [Google Scholar]
- L.O. Jernkvist, A review of analytical criteria for fission gas induced fragmentation of oxide fuel in accident conditions, Prog. Nucl. Energy 119, 103188 (2020), https://doi.org/10.1016/j.pnucene.2019.103188 [Google Scholar]
- K. Kulacsy, Mechanistic model for the fragmentation of the high-burnup structure during LOCA, J. Nucl. Mater. 466, 409 (2015), https://doi.org/10.1016/j.jnucmat.2015.08.015 [Google Scholar]
- B. Michel, M. Welland, N. Ofori-Opoku, L. Vanbrutzel, K. Kulacsy, M.R. Tonks, P.-G. Vincent, F. Ribeiro, A. Jelea, G. Pastore, D.A. Anderson, J. Gatt, R. Madec, J.-P. Crocombette, State of the art of fuel micro-mechanical modelling: From atomic scale to engineering laws in fuel performance codes, J. Nucl. Mater. 572, 154034 (2022), https://doi.org/10.1016/j.jnucmat.2022.154034 [Google Scholar]
- A.A. Griffith, The phenomena of rupture and flow in solids, Phil. Trans. R. Soc. Lond. A 221, 163 (1921), https://doi.org/10.1098/rsta.1921.0006 [Google Scholar]
- Z.P. Bazant, Size effect, Int. J. Solids Struct. 37, 69 (2000), https://doi.org/10.1016/S0020-7683(99)00077-3 [Google Scholar]
- G.I. Barenblatt, The formation of equilibrium cracks during brittle fracture. General ideas and hypotheses. Axially-symmetric cracks, J. Appl. Math. Mech. 23, 622 (1959), https://doi.org/10.1016/0021-8928(59)90157-1 [Google Scholar]
- D.S. Dugdale, Yielding of steel sheets containing slits, J. Mech. Phys. Solids 8, 100 (1960), https://doi.org/10.1016/0022-5096(60)90013-2 [Google Scholar]
- R. Henry, I. Zacharie-Aubrun, T. Blay, S. Chalal, J.-M. Gatt, C. Langlois, S. Meille, Fracture properties of an irradiated PWR UO2 fuel evaluated by micro-cantilever bending tests, J. Nucl. Mater. 538, 152209 (2020), https://doi.org/10.1016/j.jnucmat.2020.152209 [Google Scholar]
- R. Henry, I. Zacharie-Aubrun, T. Blay, N. Tarisien, S. Chalal, X. Iltis, J.-M. Gatt, C. Langlois, S. Meille, Irradiation effects on the fracture properties of UO2 fuels studied by micro-mechanical testing, J. Nucl. Mater. 536, 152179 (2020), https://doi.org/10.1016/j.jnucmat.2020.152179 [Google Scholar]
- B. Gong, D. Frazer, B. Shaffer, H.C. Lim, P. Hosemann, P. Peralta, Micro-cantilever beam experiments and modeling in porous polycrystalline UO2, J. Nucl. Mater. 557, 153210 (2021), https://doi.org/10.1016/j.jnucmat.2021.153210 [Google Scholar]
- H. Balboa, L. Van Brutzel, A. Chartier, Y. Le Bouar, Assessment of empirical potential for MOX nuclear fuels and thermomechanical properties, J. Nucl. Mater. 495, 67 (2017), https://doi.org/10.1016/j.jnucmat.2017.07.067 [Google Scholar]
- Y. Zhang, X.-Y. Liu, P.C. Millett, M. Tonks, D.A. Andersson, B. Biner, Crack tip plasticity in single crystal UO2: Atomistic simulations, J. Nucl. Mater. 430, 96 (2012), https://doi.org/10.1016/j.jnucmat.2012.06.044 [Google Scholar]
- Z.A. Manorosoa, A. Chrysochoos, A. Jelea, Y. Monerie, F. Perales, Atomistic study of the properties and behavior under uniaxial tensile stress of some representative UO2 grain boundaries, Comput. Mater. Sci. 228, 11231 (2023), https://doi.org/10.1016/j.commatsci.2023.112314 [Google Scholar]
- B. Bourdin, G.A. Francfort, J.-J. Marigo, The Variational Approach to Fracture (Springer Netherlands, 2008) [Google Scholar]
- T. Linse, P. Hennig, M. Kästner, R. de Borst, A convergence study of phase-field models for brittle fracture, Eng. Fract. Mech. 184, 307 (2017) [Google Scholar]
- E. Tanne, T. Li, B. Bourdin, J.-J. Marigo, C. Maurini, Crack nucleation in variational phase-field models of brittle fracture. J. Mech. Phys. Solids 110, 80 (2018) [Google Scholar]
- G. Molnar, A. Doitrand, A. Jaccon, B. Prabel, A. Gravouil, Thermodynamically consistent linear-gradient damage model in Abaqus. Eng. Fract. Mech. 266, 108390 (2022) [Google Scholar]
- S. Jiménez-Alfaro, D. Leguillon, C. Maurini, J. Reinoso, A dialogue between Finite Fracture Mechanics and Phase Field approaches to fracture for predicting crack nucleation at the microscale, Int. J. Fract. 249, 13 (2025), https://doi.org/10.1007/s10704-024-00819-x [Google Scholar]
- D. Leguillon, Strength or toughness? A criterion for crack onset at a notch, European JMech. 21, 61 (2002), https://doi.org/10.1016/S0997-7538(01)01184-6 [Google Scholar]
- P. Weißgraeber, D. Leguillon, W. Becker, A review of finite fracture mechanics: crack initiation at singular and nonsingular stress raisers, Arch. Appl. Mech. 86, 375 (2016) [Google Scholar]
- A. Doitrand, T. Duminy, H. Girard, X. Chen, A review of the coupled criterion. J. Theor. Comput. Appl. Mech. (2024), https://doi.org/10.46298/jtcam.11072 [Google Scholar]
- A. Doitrand, E. Martin, D. Leguillon, Numerical implementation of the coupled criterion: Matched asymptotic and full finite element approaches, Finite Elements Anal. Design 168, 103344 (2020), https://doi.org/10.1016/j.finel.2019.103344 [Google Scholar]
- V. Acary, Y. Monerie, Nonsmooth fracture dynamics using a cohesive zone approach, Research Report RR-6032, INRIA, 2006 [Google Scholar]
- E. Martin, T. Vandellos, D. Leguillon, N. Carrere, Initiation of edge debonding: coupled criterion versus cohesive zone model, Int. J. Fract. 199, 157 (2016) [Google Scholar]
- A. Turon, C. G. Dávila, P. P. Camanho, J. Costa, An engineering solution for mesh size effects in the simulation of delamination using cohesive zone models. Engineering Fracture Mechanics, 74, 1665 (2007), https://doi.org/10.1016/j.engfracmech.2006.08.025 [Google Scholar]
- A. Doitrand, R. Estevez, D. Leguillon, Comparison between cohesive zone and coupled criterion modeling of crack initiation in rhombus hole specimens under quasi-static compression, Theor. Appl. Fract. Mech. 99, 51 (2019) [Google Scholar]
- T.L. Anderson, Fracture Mechanics: Fundamentals and Applications, 4th edn. (CRC Press, 2017) [Google Scholar]
- Cast3M Finite Element code, G_THETA : The crack virtual extension procedure, https://www-cast3m.cea.fr/ [Google Scholar]
- N. Blal, L. Daridon, Y. Monerie, S. Pagano, Micromechanical-based criteria for the calibration of cohesive zone parameters, J. Comput. Appl. Math., Fifth International Conference on Advanced COmputational Methods in ENgineering (ACOMEN 2011) 246, 206 (2013), https://doi.org/10.1016/j.cam.2012.10.031 [Google Scholar]
- B. Michel, T. Helfer, I. Ramiere, C. Esnoul, A new numerical methodology for simulation of unstable crack growth in time independent brittle materials, Eng. Fract. Mech. 188, 126 (2018), https://doi.org/10.1016/j.engfracmech.2017.08.009 [Google Scholar]
- A. Doitrand, R. Henry, I. Zacharie-Aubrun, J.-M. Gatt, S. Meille, UO2 micron scale specimen fracture: Parameter identification and influence of porosities, Theor. Appl. Fract. Mech. 108, 102665 (2020), https://doi.org/10.1016/j.tafmec.2020.102665 [Google Scholar]
- J.B. Wachtman, M.L. Wheat, H.J. Anderson, J.L. Bates, Elastic constants of single crystal UO2 at 25°C, J. Nucl. Mater. 16, 39 (1965), https://doi.org/10.1016/0022-3115(65)90089-9 [Google Scholar]
Cite this article as: Hela Mensi, Aurelien Doitrand, Isabelle Zacharie-Aubrun, Jean-Marie Gatt, Bruno Michel. Micro-scale characterization of brittle fracture in UO2 nuclear fuel: finite element methodology for 2D and 3D simulation. 12, 12 (2026). https://doi.org/10.1051/epjn/2026007
All Tables
All Figures
|
Fig. 1. Double Edge Notched Tension DENT geometry for the study of a perfect crack. |
| In the text | |
|
Fig. 2. Mesh refinement at tip of the crack for the DENT specimen (isoparametric Finite Element with linear interpolation functions and full integration). |
| In the text | |
|
Fig. 3. Cohesive law for UO2: σ is the cohesive stress and δ is the displacement jump between the nodes of the cohesive element. |
| In the text | |
|
Fig. 4. Elastic stiffness Kn of the cohesive element: δuCE is the elastic displacement jump in the cohesive element and ΔuFE is the displacement variation in the finite element connected to the cohesive element. |
| In the text | |
|
Fig. 5. Simulation of the unstable fracture for a DENT specimen: a) crack opening and δ/δc before instability, b) crack opening and δ/δc after instability, c) load-displacement curve. |
| In the text | |
|
Fig. 6. Tensile fracture stress assessment for the DENT specimen: mesh sensitivity. |
| In the text | |
|
Fig. 7. Elastic cohesive stress concentration at the crack tip for the DENT specimen submitted to the Griffith’s tensile fracture stress. Linear scale (left), Log scale (right). |
| In the text | |
|
Fig. 8. Tensile fracture stress assessment for the DENT specimen: coarse mesh assumption. |
| In the text | |
|
Fig. 9. Simulation of the unstable fracture for a mesh size of 50 nm and the numerical critical cohesive stress σc* = 4.6 GPa : a) crack opening and δ/δc before instability, b) crack opening and δ/δc after instability, c) load-displacement curve. |
| In the text | |
|
Fig. 10. Input data of the micro-cantilever bending test of a notched specimen. |
| In the text | |
|
Fig. 11. Micro-cantilever bending test: 2D representation an boundary conditions. |
| In the text | |
|
Fig. 12. Fracture bending load of a micro-cantilever notched specimen: sensitivity analysis of the 2D simulation to the critical cohesive stress. |
| In the text | |
|
Fig. 13. Geometry of the 3D study case of unstable brittle fracture. |
| In the text | |
|
Fig. 14. 3D simulation results: load-displacement curve and crack propagation during the unstable fracture. |
| In the text | |
|
Fig. 15. 3D elastic analysis of the micro-cantilever bending test of a notch specimen: bending stress and neutral axis. |
| In the text | |
Current usage metrics show cumulative count of Article Views (full-text article views including HTML views, PDF and ePub downloads, according to the available data) and Abstracts Views on Vision4Press platform.
Data correspond to usage on the plateform after 2015. The current usage metrics is available 48-96 hours after online publication and is updated daily on week days.
Initial download of the metrics may take a while.