| Issue |
EPJ Nuclear Sci. Technol.
Volume 12, 2026
Euratom Research and Training in 2025: ‘Challenges, achievements and future perspectives’, edited by Roger Garbil, Seif Ben Hadj Hassine, Patrick Blaise, and Christophe Girold
|
|
|---|---|---|
| Article Number | 11 | |
| Number of page(s) | 8 | |
| DOI | https://doi.org/10.1051/epjn/2026002 | |
| Published online | 06 May 2026 | |
https://doi.org/10.1051/epjn/2026002
Regular Article
The COMOS system – An innovative monitoring system for containment atmosphere in severe accident
1
ASNR, PSN-RES/SAM, BP17, F-92262 Fontenay-aux-Roses, France
2
Université Paris-Saclay, CEA, List, F-91120 Palaiseau, France
3
ASNR, PSN-RES/SCA, BP68, F-91400 Saclay, France
* e-mail: This email address is being protected from spambots. You need JavaScript enabled to view it.
Received:
25
March
2025
Received in final form:
22
September
2025
Accepted:
2
January
2026
Published online: 6 May 2026
Abstract
In the event of a severe accident in a light water nuclear reactor, substantial amounts of hydrogen may be produced and released into the containment due to reactor core degradation. Additionally, if molten corium interacts with concrete, further combustible gases, such as hydrogen and carbon monoxide, may be emitted. As demonstrated during the Fukushima Daichi accident, the combustion of H2 and CO can generate high-pressure peaks, potentially compromising the integrity of the reactor containment. To mitigate the formation of combustible gas mixtures, many European countries have implemented safety measures, including the use of Passive Autocatalytic Recombiners (PARs) or igniters, which help consume H2 and CO upon release. However, studies indicates that even with these systems in place, completely preventing the formation of combustible mixtures remains challenging. This could lead to localized combustion, flame acceleration, and ultimately poses a risk to the integrity of containment structures and safety components. To safeguard containment integrity, severe accident management guidelines (SAMG) recommend strategies such as activating spray systems or emergency core cooling, which may inadvertently increase the risk of gas explosions. Therefore, an effective gas monitoring system is of strong interest for supporting decision-making and implementing SAMG measures. In response to this need, the COMOS system – a fiber-coupled nuclearized gas probe prototype utilizing optical Raman technology – was developed under the French MITHYGENE Project. This system aims to enhance the management of combustible gases during severe accidents in water-cooled reactors, including Small Modular Reactors (SMRs), offering an innovative approach to improving nuclear safety.
© A. Bentaïb et al., Published by EDP Sciences, 2026
 This is an Open Access article distributed under the terms of the Creative Commons Attribution License (https://creativecommons.org/licenses/by/4.0), which permits unrestricted use, distribution, and reproduction in any medium, provided the original work is properly cited.
1. Introduction
During a severe accident (SA) in a Light Water Reactor (LWR), substantial amounts of hydrogen (H2) gas are expected to be generated and released into the containment due to core degradation, creating a potential combustion hazard. Additionally, if Molten Corium/Concrete Interaction (MCCI) occurs, further flammable gases, including hydrogen (H2) and carbon monoxide (CO), may be released. If ignited, these gases could cause rapid pressure and temperature spikes, threatening the integrity of the containment structure and essential safety components.
To mitigate the risk of combustible gas mixtures forming, several European countries have adopted safety measures such as Passive Autocatalytic Recombiners (PARs) or igniters, which help to consume H2 and CO upon release. Additional precautions are taken to prevent reactor building failure due to overpressure, including water spray injection and controlled venting of gases into the atmosphere (either filtered or unfiltered). However, some of these safety strategies can introduce new risks, such as promotion of flame acceleration in case of spray activation in some conditions [1].
To assist reactor operators and safety authorities (e.g., emergency response centers) in managing explosion hazards during severe accidents, safety guidelines were developed in the 90’s. These severe accident management guidelines (SAMG) provide recommendations on the adequate safety strategies during the accident with the aim to preserve the containment integrity. When implemented, the monitoring of combustible gas concentrations is a key aspect of these guidelines and plays a crucial role in decision-making. Typically, fewer than ten sensors are placed in various containment areas to track gas concentrations. Operators rely on these data to make critical decisions, such as delaying spray activation or opening venting lines [3].
Two primary measurement techniques are mainly employed in nuclear power plants (NPPs) to monitor containment atmosphere during a severe accident. They are based on gas sampling and catalytic reaction-based detection. In catalytic reaction-based measurement systems, hydrogen concentration is inferred by measuring the temperature increase induced by catalytic reactions on Pt/Pd sensors. This method is used in nuclear plants such as Beznau (Switzerland), Doel units 3 and 4 (Belgium), and Kozloduy (Bulgaria) [2]. However, these systems do not effectively work in the later phases of a severe accident when oxygen is lacking, and carbon monoxide is present. The reduction of oxygen content reduces the catalytic reaction, thereby limiting the temperature increase. Moreover, the simultaneous presence of hydrogen and carbon monoxide makes more difficult the accurate determination of their respective concentrations using temperature measurements.
The second widely used hydrogen measurement technique is gas sampling. In this approach, gas samples are extracted through sampling lines and analyzed outside the containment using either a mass spectrometer or a thermal conductivity detector. This method is employed in several NPPs in Germany and Japan, providing long-term monitoring capability during severe accidents, as the hydrogen sensors remain outside the containment and are not exposed to the harsh internal environment [2].
However, gas sampling has several disadvantages [2] such as:
-
The need for containment penetration, increasing the risk of leakage.
-
The potential dilution of hydrogen during the sampling process, as pressure differences between the pipe inlet and outlet can affect measurement accuracy.
-
The time delays due to sample extraction and analysis.
-
The necessity to shield external sampling systems to protect personnel from radiation exposure.
-
The possible adsorption on pipe walls of certain species such as H2O.
To address these limitations, the COMOS fiber-coupled nuclearized gas prototype was developed under the French MITHYGENE project (PIA-RSNR1) [4]. This technology enables in situ, real-time monitoring of gas mixtures (H2, O2, N2, steam, CO, CO2) at multiple containment locations, ensuring sufficient coverage throughout all phases of a severe accident in LWRs.
The Technological Readiness Level (TRL) of COMOS is estimated between 5 and 6, and its development has led to three patent applications. Additionally, data-driven algorithms, applied to a database of CFD simulation results from accidental scenarios, have been used to optimize sensor placement inside the containment. A summary of the development and qualification of this system is provided in the following sections.
2. Description of the COMOS system (COntainment Monitoring System)
COMOS utilizes Raman spectrometry for in situ gas monitoring, covering both in-vessel and ex-vessel phases of severe accidents. It partially relies upon temperature and pressure data provided by the control-command of the NPP. It simultaneously measures six key gases (H2, O2, CO, CO2, steam, and N2), providing essential information for Severe Accident Management and Emergency Planning, including:
-
Quantification of hydrogen released into the containment, supporting the assessment of core degradation level.
-
Distribution of hydrogen and steam within the containment.
-
Detection of MCCI.
-
Measurement of carbon monoxide and carbon dioxide released during MCCI providing information on the concrete ablation.
-
Identification of potential flammable gas mixtures for both In-vessel and Ex-vessel conditions.
-
Recognition of conditions favorable for rapid combustion.
-
Assessment of Passive Autocatalytic Recombiners (PARs) efficiency in reducing hydrogen concentration.
-
Observation of global convection phenomena based on the measurement provided by several probes located in the containment.
This monitoring technique offers several key advantages, including chemical-selective, distributed, and highly localized gas measurements (down to cm3 resolution) with near real-time data acquisition (response time under 10 minutes). The optoelectronics unit is positioned outside the radiological zone and connected to probes via several meter-long optical fiber cables through optical penetration assemblies (see Fig. 1). Additionally, it can be powered by emergency power supplies to ensure functionality during power outages, as experienced during the Fukushima Daiichi accident.
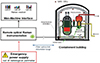 |
Fig. 1. Illustration of optical measurement implementation in a nuclear power plant. |
The gas measurements performed using COMOS help drawing a picture of gas distribution inside the containment and assessing the risk of flammable clouds formation inside the containment during the accident. This information can be then provided to the operators and emergency centers in the form of the Shapiro-Moffette ternary diagrams below (Fig. 2).
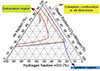 |
Fig. 2. Ternary diagram representing flammability limits, flame acceleration limits and detonation limits [2]2. |
Raman spectroscopy is extensively used for material characterization and chemical analysis across various fields. However, to the best of our knowledge, COMOS marks the first application of a fiber-coupled nuclearized Raman probe specifically designed for use in a NPP. The deployment of Raman spectroscopy in nuclear environments faces significant challenges, particularly due to the radiation-induced Cerenkov effect in fibers, which interferes with Raman signals, especially under severe accident conditions for which dose rates can reach 1 kGy/h. Additionally, cumulative radiation exposure can reach several MGy, and Radiation-Induced Attenuation (RIA) along fiber optic links restricts the use of a narrow range of near-infrared wavelengths for laser interrogation (typically in the range [730–750 nm]).
Another challenge arises from the release of airborne particles within the containment, including aerosols composed of soot (from burning plastic sheaths), fission products, metallic and nuclear fuel residues (from core degradation), as well as sodium, potassium, magnesium, silicium and calcium compounds generated during MCCI. Preventing the accumulation of these aerosols on optical components is crucial. Lastly, water condensation on optical windows scatters light, reducing collection efficiency.
To overcome these four key challenges, the development of COMOS followed a step-by-step approach [6]:
-
Step 1: Identifying the constraints imposed by the harsh containment environment during a severe accident, establishing the requirements the prototype must meet.
-
Step 2: Defining relevant standards and preparing test matrices for prototype qualification.
-
Step 3: Exploring technical solutions to ensure compliance with the identified requirements.
-
Step 4: Designing the nuclearized Raman probe prototype and conducting qualification tests, including metrological and radiative assessments.
-
Step 5: Developing numerical algorithms to optimize sensor placement within the containment and generate key performance metrics to aid plant operators and emergency response teams in analysing measurement data.
The COMOS probe was then tailored to withstand accidental conditions, i.e. it is sealed (IP69K) to prevent aerosol pollution of inner parts and temperature- and radiation-resistant [5]. The Raman analysis of gas mixtures is challenging because the gas density is typically 3 orders of magnitude lower than for solids or liquids. Raman analysis of gas mixtures is even more challenging in nuclear accidental conditions. The Raman signals from all gases of interest (O2, N2, H2, H2O, CO and CO2) are discriminated against Cerenkov light stemming out from the exposed fiber links with the help of two algorithms based on background subtraction and polarization-correction that rely upon Raman signal modulation with tuning both laser light polarization and power. Laser interrogation in the red part of the optical spectrum helps minimizing Radiation-Induced Attenuation (RIA).
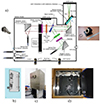 |
Fig. 3. Scheme of the COMOS prototype. |
The COMOS prototype then designed is presented in the following figure (Fig. 3):
All optical devices are mounted onto a base plate, itself mounted inside a sealed case (IP69K) in order to prevent the inner optical parts from contamination by aerosols. The probe is equipped with two optical penetration assemblies allowing for laser input (laser fiber) and Raman signal output (Raman collection fiber). 20-meter long low-OH multimode (MM) fibers were used as laser and Raman fibers respectively. The fibers are inserted into crush-resistant stainless steel sheathes. Two additional electrical penetrations are also installed in order to transmit both heating current and electric command for polarizer rotation through silicone-coated wires.
Since the State of Polarization (SoP) is not maintained in a MM fiber, the laser light entering from the laser fiber (400 μm diameter) is first polarized through a polarization beam splitter (PBS) cube. At the output of the PBS, the electric vector of the laser light is aligned parallel to the support base. Afterwards, the laser light is low-pass filtered in order to remove unwanted light contribution in the Raman band. All filters exhibit seven orders of magnitude attenuation in the stop band. Then, after being reflected by a beamsplitter (BS) plate set at 20° incidence, it is focused with the help of a parabolic mirror. Both laser and Raman lights are transmitted through a single Brewster-oriented UV-grade silica window. The focal point is located 15 mm away from the external surface of the window.
The Raman light generated at the focus point is collected by the same parabolic mirror and sent back to the internal part of the probe. It propagates through the BS plate, a low-pass filter removing excess laser light, a rotating polarizer, and is eventually focused into the Raman collection fiber (600 μm diameter). Although the dominant contribution of the Raman light comes out from the focus point, a lesser part stems from scattering along the beam line inside the probe that may be filled with a reference gas. Raman spectra start from 772 nm, up to 1050 nm.
All gas of interest are light molecules having large Raman Stokes shifts, ranging typically from 587 cm−1 (H2) up to 3657 cm−1 (H2O), making discrimination easier with compact grating-based spectrometers or conventional bandpass filters. Figure 4 (left) shows a reconstructed Raman spectrum for all gases of interest in this study. All transitions are vibrational in nature, except H2 (S1) which is rotational. We used a Continuous-Wave (CW) laser emitting 3W at 750 nm. recorded the Raman spectra with a scientific Charge-Coupled-Device (CCD) low-noise silicium detector. The vibrational line of H2 falls outside the spectral domain of silicium (beyond 1050 nm) and is thus not detected. The 2D CCD detector may be separated in several parts (typically four) allocated to several Raman probes (multitrack capability). Finally, the use of a CW laser complies with ATEX recommendation because the laser intensity at focus is nine orders of magnitude lower than the intensity required for laser-triggering H2 explosion.
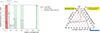 |
Fig. 4. (left) Example of reconstructed Raman spectrum gathering all gases of interest (right) example of illustration of the measurements in the ternary diagram for H2-risk assessment (Shapiro-Moffette). |
All Raman peaks are well separated from each other; no interference is observed between species. It is worthwhile noticing that water vapor (a ubiquitous interfering gas in FTIR spectrometry) is well discriminated against the other gases. Partial pressures require monitoring the temperature of the gas mixture, near the focus point. Consequently, each probe must incorporate a SA-qualified temperature sensor close to the focus point. The relative concentration may then be determined by normalizing the partial pressure to the total pressure given by the control-command of the NPP. Figure 4 right shows the ternary diagram H2-air-H2O upon which H2-risk assessment is done.
COMOS is designed to accommodate an anti-fogging-anti-aerosol device (AF-AA) that is Joule-heated to prevent condensation. The feasibility of aerosol filtration was evaluated theoretically by the use of a cascade impactor filter connected to the probe head. The AF-AA module has additional functions of blocking external light (light labyrinth) and ensuring eye safety.
3. COMOS qualification
To ensure the COMOS operability under representative severe accidents conditions, the French RCC-E standard3 [7] was considered within the following specifications: (1) pressure up to 9 bar, (2) temperature peak up to 170° C, (3) radiation annual dose and dose rate up to 2 MGy/1 kGy/h, (4) saturated water vapor condition (RH = 100%), (5) presence of aerosols, (6) shock/vibrations (Design Basis Earthquake – DBE), (7) design and beyond-design basis.
During the MITHYGENE project, the COMOS probe was developed in stages to gradually improve its performance qualified hardware: standalone during entire operational lifetime and MTTF of several months after the onset of the accident. Thus, qualification tests were performed on several facilities as shown in Figure 5.
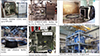 |
Fig. 5. Overview of facilities used for qualification. |
Several experimental campaigns were then conducted on these facilities demonstrating the performance of the COMOS system considering conditions as specified in the French RCC-E standard4 [7].
As the Cerenkov effect was the principal challenge to overcome, we limit in the following the results presentation to the radiation performed tests. The Raman probe was tested in the IRMA irradiation facility to check both the RIA influence and the algorithms for Cerenkov removal (Fig. 6). Several cobalt sources were used to achieve four dose rates (250 Gy/h, 500 Gy/h, 844 Gy/h and 1000 Gy/h). In accidental conditions, under a dose rate as high as 1 kGy/h, the most detrimental phenomenon appears to be the Cerenkov light stemming out from the fiber used for Raman collection. The Cerenkov light that superimposes over the useful Raman is typically 2–3 orders of magnitude larger, thus degrading both Signal-to-Noise Ratios (SNRs) and Limits of Detection (LoDs). It illustrates how challenging the Cerenkov correction may be in accidental conditions. We applied two algorithms to discriminate Raman signals out of Cerenkov perturbations: Background Subtraction (BS) and Polarization Correction (PC). The BS algorithm consists in interpolating a baseline from two reference datapoints or segments located close to the Raman band of interest. The PC algorithm consists in recording two spectra, one for each state of polarization (SoP) of the Raman light. A monitoring cycle consists of 4 spectra (Cerenkov 0° and 90° , Raman + Cerenkov 0° and 90°). The PC algorithm does not rely upon baseline correction and is thus inherently more stable than the BS algorithm because it self-compensates both Cerenkov and laser-induced fluorescence. The PC algorithm pertains to O2, N2, CO, CO2 and H2O monitoring on account on their low depolarization ratio (several percents). Conversely, the BS algorithm was used for the monitoring of the rotational band of H2, granted its high depolarization ratio (75%). Limits of Detection (LoDs at SNR = 3) of the order to several percents are obtained for a 10-minute integration time and a laser power of 160 mW at focus.
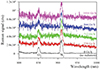 |
Fig. 6. View of Raman spectra of ambient air corrected from Cerenkov light for several dose rates (curves are shifted up for sake of clarity). |
The probe was tested in gamma irradiation cell (IRMA, IRSN (now ASNR), Saclay, France) in ambient air and onto H2-N2 mixture samples (TEDLAR bags). The wavelength-dependent RIA-induced penalty in fiber transmission lies between 2 dB and 3.5 dB for a total dose of 1.6 MGy and a total exposed length of 10 meters. Cerenkov light is typically about two orders of magnitude stronger than the Raman signal from air, making Raman gas monitoring under accident conditions particularly challenging. However, because the Cerenkov signal is proportional to the dose rate, it can also be used to monitor nuclear activity inside the containment.
Finally, the prototype probe (equipped with its Brewster window, its AF-AA module and a temperature sensor) should be tested representatively, with a dedicated readout unit, into a large, dedicated gas cell in which gas mixtures are flown at required partial pressures. Such test is likely to be performed at the very end when the probe has suffered all previous tests (temperature, irradiation, shock/vibrations) in observance with a conservative approach.
4. Application to nuclear power plants
Experiences from past accidents have shown that managing severe scenarios can be hindered by a lack of available information. This may result from missing relevant instrumentation (e.g., RPV liquid level measurement in TMI2), loss of instrumentation (e.g., loss of DC power as in Fukushima Daïchi), instrumentation failure due to design-exceeding loads (e.g., RPV liquid level measurement in Fukushima Daïchi), or exceeding the measurement range of the instruments. Regarding the risk of combustion, quantifying the combustibility of the containment atmosphere during a severe accident within the SAMG presents two distinct challenges: technical limitations of the hydrogen monitoring system and physical difficulties in inferring the containment state from the available information. The technical limitations had been overcome using the COMOS set-up.
To answer the second challenge and considering the French PWR 1300 MWe reactor type, a first investigation of the optimal sensors location inside the containment had been conducted based on the large database originating from CFD simulations of several accidental scenarios.
Using the adopted algorithms based on the data provided by the CFD analysis of several accident scenarios, it was possible to optimize the sensors’ location and their numbers leading to comparable results as those obtained with CFD analysis. Figure 7 presents, for a small break loss of coolant scenario, the comparison between CFD results and sensors measurement interpolation results considering 11 and 19 sensors. Each sensor, identified by a circle in the figure, is allocated to a dedicated volume considered as homogeneous.
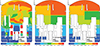 |
Fig. 7. Comparison CFD (left) with interpolated sensor measurements (middle and right) of molar hydrogen fractions (white areas indicate regions where hydrogen is absent or not detected by the sensors.) |
As shown in Figure 7, it is important to note that the information provided by the sensor measurements qualitatively aligns with the data obtained from the CFD results. The composition of the gaseous atmosphere inside the containment, determined from the measurements, allows for the assessment of flammability conditions and flame acceleration in the event of combustion, as illustrated in the ternary diagram in Figure 4.
To provide relevant information to operators and emergency centers, both the sensor measurements and CFD results were processed to highlight flammable zones, inert zones, and areas where flame acceleration could occur. Figure 8 presents the post-processing results at 5990 seconds of the considered scenario.
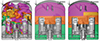 |
Fig. 8. : Results for 5900s, risk scale field from the different limits (green: inert atmosphere, orange: flammable mixture, purple: mixture satisfying flame acceleration criteria [2, 3]). Left from CFD calculation - Center from 11 sensors - Right from 19 sensors. |
It should be noted that the flammability status of the containment atmosphere can be continuously updated based on the sensors measurement throughout the accident including the In- and Ex-vessel phases.
5. Conclusions
The survey conducted at the beginning of the MITHYGENE project highlighted the limitations of current commercial gas monitoring systems in handling the extreme conditions expected during a severe accident, considering both the In- and Ex-Vessel phases. Additionally, French regulations, which prohibit the extraction of gas to maintain the containment’s integrity, rule out the use of gas samples for analysis outside the containment. However, gas monitoring systems are essential to provide crucial information that allows operators and emergency teams to take appropriate actions, such as delaying the activation of the spray or safety injection, thus preventing the combustion of H2/CO. The COMOS prototype addresses this need and can be applied in both existing and future power plants. A second application involves decommissioning and dismantling, such as monitoring H2 during corium cutting (e.g., at Fukushima Daichi’s primary containment vessel).
The COMOS prototype has a TRL of 5–6 and requires further development before it can be industrialized. To this end, commercial photomultipliers could be used to replace the CCD detector, which would improve the overall robustness of the system and facilitate obtaining hardware and software nuclear certification. Emergency power supplies may potentially power this unit, in case of power outage (as it happened during the Fukushima Daiichi’s accident). The energy consumption is estimated to be about 15 kWh (3-hour intense Joule heating followed by 3-day continuous operation), representative of a conventional Li-ion battery for electric car. SA-qualified optical penetrations assemblies are commercially available (IST/Mirion in France (ex-Auxitrol), Schott in Germany, to name a few) and may be implemented in substitution to existing electrical ones. Fibers would be deployed through steel ducts to prevent them being ripped off and crushed. The industrial transfer of this innovative development to a French/European manufacturer will strengthen European Nuclear industry and will contribute to stay ahead of the competition with foreign countries.
In addition, the COMOS development has been awarded the 1st Nuclear Innovation Prize in the category ‘Reactor Safety Systems’ (RSS) during the 11th European Commission Conference on EURATOM Research and Training in Reactor Safety & Radioactive waste Management (FISA-EURADWASTE) in Warsaw (Poland), May 12-16, 2025.
Funding
The authors gratefully acknowledge the ANR (Agence Nationale de la recherche), the PIA RSNR (Programme d’Investissement d’Avenir, Recherche en Sûreté Nucléaire et Radioprotection) of the French government and the sponsors for their financial support.
Conflicts of interest
The present work had been performed in the framework of the MITHYGENE project.
Data availability statement
This article has no associated data generated and/or analyzed/Data associated with this article cannot be disclosed due to confidential reason.
Author contribution statement
The contribution of the authors to this work is as follows:
– Sylvain Magne, Mathieu Leroy, Emmanuel Porcheron and Ahmed Bentaib contributed to the conceptualization and the methodology of the development of the COMOS system; they are owners of the corresponding patents.
– Alexandre Bleyer contributes to the numerical investigations to optimize the sensors’ locations.
– Ahmed Bentaib, Sylvain Magne and Emmanuel Porcheron contributed to the writing of the article.
Acknowledgments
The authors would like to acknowledge the contribution of Stéphane Poirier and Hortense Desjonquères (ASNR) for their help in conducting the IRMA experiment, Etienne Studer (CEA) for his help in conducting MISTRA tests, Nabiha Chaumeix, Mahmoud Idir and Sharat Nagaraju (CNRS-ICARE) for operating the NC2V gas cell and Audrey Ruffien-Ciszak and Julien Dhote (ARCYS) for their support during shock and seismic tests. The COMOS development has been awarded the 1st Nuclear Innovation Prize in the category ‘Reactor Safety Systems’ (RSS) during the 11th European Commission Conference on EURATOM Research and Training in Reactor Safety & Radioactive waste Management (FISA-EURADWASTE) in Warsaw (Poland), May 12–16, 2025.
References
- R. Caruso, Analyse de propagation de flammes hydrogène/air/vapeur en présence de gouttes d’eau, thèse de l’Université d’Orléans, 2019 (in french) [Google Scholar]
- Hydrogen Phenomena during Severe Accidents in Water Cooled Reactors, IAEA TRAINING COURSE SERIES 72 [Google Scholar]
- Developments in the Analysis and Management of Combustible Gases in Severe Accidents in Water Cooled Reactors following the Fukushima Daiichi Accident, IAEA-TECDOC-1939 [Google Scholar]
- A. Bentaib, E. Studer, N. Chaumeix, S. Magne, E.-A. Reinecke, D. Pinet, (2014). MITHYGENE project: Towards the improvement of hydrogen risk assessment models and safety management procedures. Contribution to the proceedings of the International Workshop on Nuclear Safety and Severe Accident (NUSSA-2014), Chiba, Japan, 3-5 September 2014. [Google Scholar]
- S. Magne, S. Nehr, X. Buet, A. Bentaïb, E. Porcheron, R. Grosseuvres, E. Studer, R. Scarpa, D. Abdo, J.-L. Widloecher, O. Norvez, N. Chaumeix, J. Dhote, M. Freyssinier, A. Ruffien-Ciszak, In situ gas monitoring by fiber-coupled Raman spectrometry for H2-risk management in nuclear containment during a severe nuclear accident, IEEE Trans. Nucl. Sci. 67, 617 (2020) [Google Scholar]
- S. Magne, M. Leroy, A. Bentaïb, E. Porcheron, E. Studer, N. Chaumeix, A. Ruffien-Ciszak, J. Dhote, Fiber-coupled nuclearized Raman probe for remote gas monitoring in nuclear containment: proof-of-concept for H2-risk management of design & beyond-design accidents, Specialist Workshop on Advanced Instrumentation and Measurement Techniques for Nuclear Reactor Thermal Hydraulics and Severe Accidents, SWINTH-2024-#001 Dresden, Germany, 17–20 June 2024 [Google Scholar]
- B. Willey, Qualification of electrical equipment according to RCC-E, SNETP (https://snetp.eu/wp-content/uploads/2022/06/SNETP_Forum_2022_TS2_p5_RCCE_v2.pdf [Google Scholar]
Programme d’Investissement d’Avenir- Recherche en matière de Sureté Nucléaire et de Radioprotection (RSNR)
This diagram will be updated based on the results gained recently from the European project AMHYCO.
The RCC-E code provides a series of rules applicable to the electrical and I&C systems and equipment in order to guarantee safety of a PWR plant or other facilities, including EPR2 and SMR.
RCC-E (Règles de Conception et de Construction des Matériels Électriques des îlots nucléaires) provides technical rules for the design, construction, installation, qualification, inspection, and maintenance of electrical and I&C (Instrumentation & Control) systems in pressurized water reactor (PWR) nuclear power plants. It covers equipment and systems under both normal operating and accident conditions (temperature, pressure, radiation, seismic loads, etc.).
Cite this article as: Ahmed Bentaïb, Alexandre Bleyer, Sylvain Magne, Matthieu Leroy, Emmanuel Porcheron. The COMOS system – An innovative monitoring system for containment atmosphere in severe accident, EPJ Nuclear Sci. Technol. 12, 11 (2026). https://doi.org/10.1051/epjn/2026002
All Figures
|
Fig. 1. Illustration of optical measurement implementation in a nuclear power plant. |
| In the text | |
|
Fig. 2. Ternary diagram representing flammability limits, flame acceleration limits and detonation limits [2]2. |
| In the text | |
|
Fig. 3. Scheme of the COMOS prototype. |
| In the text | |
|
Fig. 4. (left) Example of reconstructed Raman spectrum gathering all gases of interest (right) example of illustration of the measurements in the ternary diagram for H2-risk assessment (Shapiro-Moffette). |
| In the text | |
|
Fig. 5. Overview of facilities used for qualification. |
| In the text | |
|
Fig. 6. View of Raman spectra of ambient air corrected from Cerenkov light for several dose rates (curves are shifted up for sake of clarity). |
| In the text | |
|
Fig. 7. Comparison CFD (left) with interpolated sensor measurements (middle and right) of molar hydrogen fractions (white areas indicate regions where hydrogen is absent or not detected by the sensors.) |
| In the text | |
|
Fig. 8. : Results for 5900s, risk scale field from the different limits (green: inert atmosphere, orange: flammable mixture, purple: mixture satisfying flame acceleration criteria [2, 3]). Left from CFD calculation - Center from 11 sensors - Right from 19 sensors. |
| In the text | |
Current usage metrics show cumulative count of Article Views (full-text article views including HTML views, PDF and ePub downloads, according to the available data) and Abstracts Views on Vision4Press platform.
Data correspond to usage on the plateform after 2015. The current usage metrics is available 48-96 hours after online publication and is updated daily on week days.
Initial download of the metrics may take a while.