| Issue |
EPJ Nuclear Sci. Technol.
Volume 6, 2020
|
|
|---|---|---|
| Article Number | 8 | |
| Number of page(s) | 9 | |
| DOI | https://doi.org/10.1051/epjn/2020003 | |
| Published online | 08 April 2020 | |
https://doi.org/10.1051/epjn/2020003
Regular Article
Uncertainty propagation based on correlated sampling technique for nuclear data applications
1
Laboratory for Reactor Physics and Systems behaviour (LRS), Ecole Polytechnique Fédérale de Lausanne (EPFL), 1015 Lausanne, Switzerland
2
Laboratory for Reactor Physics and Thermal Hydraulics (LRT), Paul Scherrer Institut (PSI), 5232 Villigen, Switzerland
3
Nuclear Energy and Safety Research Division (NES), Paul Scherrer Institut (PSI), 5232 Villigen, Switzerland
* e-mail: This email address is being protected from spambots. You need JavaScript enabled to view it.
Received:
2
September
2019
Received in final form:
15
November
2019
Accepted:
16
January
2020
Published online: 8 April 2020
Abstract
A correlated sampling technique has been implemented to estimate the impact of cross section modifications on the neutron transport and in Monte Carlo simulations in one single calculation. This implementation has been coupled to a Total Monte Carlo approach which consists in propagating nuclear data uncertainties with random cross section files. The TMC-CS (Total Monte Carlo with Correlated Sampling) approach offers an interesting speed-up of the associated computation time. This methodology is detailed in this paper, together with two application cases to validate and illustrate the gain provided by this technique: the highly enriched uranium/iron metal core reflected by a stainless-steel reflector HMI-001 benchmark, and the PETALE experimental programme in the CROCUS zero-power light water reactor.
© A. Laureau et al., published by EDP Sciences, 2020
 This is an Open Access article distributed under the terms of the Creative Commons Attribution License (https://creativecommons.org/licenses/by/4.0), which permits unrestricted use, distribution, and reproduction in any medium, provided the original work is properly cited.
1 Introduction
Reactor studies require nuclear data as an input of the calculations through the libraries of the neutron interactions with matter. Since a few decades, the propagation of the uncertainty of these nuclear data has a growing importance in many fields such as safety analysis, optimisation of the operation margins, or design of very innovative reactors where the experimental feedback on the system behaviour is limited [1,2].
The uncertainty propagation can also be useful to design new integral experiments. Considering a given observable (i.e. reactivity or reaction rates) the uncertainty propagation of the prior cross section can be compared to the one of the nuisance parameters. A prior propagated uncertainty larger than the nuisance parameter thus means that a new valuable piece of information can be used for nuclear data validation or assimilation. The present work has been performed in this framework and more details can be found on the application of the developed technique on the PETALE experimental programme in the twin article [3].
Different approaches exist to perform uncertainty propagation. One of them is the Total Monte Carlo (TMC) approach which uses a representation of the cross section uncertainties as a set of cross sections with a given dispersion [4]. Then the propagation of these cross sections through distinct calculations provides a distribution of the results with a high fidelity even for non-linear effects. The objective of the developments presented here is to combine the Correlated Sampling (CS) technique [5] with the TMC in order to reduce the computation time and then extend its application field.
Two critical application cases are studied in this paper: a highly enriched uranium/iron metal core reflected by a stainless-steel reflector system (HMI-001) regarding the test of the methodology on an classical benchmark, and the PETALE experimental programme in the CROCUS reactor as an illustration of possible improvements in the field of dosimetry for integral experiment assimilation. On both cases we focus on the uncertainty propagation of the iron cross section, due to the large uncertainty of these cross sections in the fast energy range as illustrated in Figure 1 which presents the iron cross sections and the related uncertainty with its covariance matrix.
Different uncertainty propagation techniques are presented in Section 2 together with the TMC approach combined with the Correlated Sampling technique. The two application cases are then presented in Section 3 and the validation is detailed in Section 4.
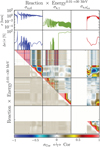 |
Fig. 1 56 Fe neutron elastic scattering (left), capture (middle) and inelastic scattering (right) cross-sections from TENDL2017 database [6], 256 random ACE files (1st line), relative uncertainty (2nd line) and correlation matrix (3 last lines) represented with its standard deviation estimated with a Jackknife resampling technique [7]. |
2 Nuclear data uncertainty propagation
2.1 Nuclear data uncertainty
Various methods can be used to propagate nuclear data uncertainties. These methods are related to the format used to provide the uncertainty itself.
The most common way consists in providing the ‘best’ cross-section plus a covariance matrix for each isotope, the covariance matrix including the uncertainty and the correlations on the cross sections. Another option is to provide a coherent ‘package’ of cross sections extensively fitting the experimental results based on an automatic cross section generation from the resonance parameters up to a comparison to the EXFOR experimental database [4,8,9].
From these two approaches, different methodologies exist to propagate the uncertainties in critical system calculations.
2.2 Sensitivity approach
Modern calculation tools allow us to compute the sensitivity of a response, such as the reactivity, to the cross section perturbation. This can be done with both deterministic codes and stochastic codes using adjoint flux calculations. In this study we used Serpent2.29 and its IFP (Iterated Fission Probability) implementation [10] for sensitivity estimations on the reactivity coefficient in order to compare the results with the ones of the developed method.
The sensitivity array contains the effect on the response due to a small perturbation of the cross section in a given energy range. By vector-matrix multiplications, the sandwich rule allows us to propagate the cross section uncertainty contained in the covariance matrices to the response associated to the sensitivity array.
The advantage of this approach is the computation efficiency: a single computation provides the response value and the sensitivity, and then the uncertainty propagation can be done with the covariance matrices with a good numerical convergence. The drawbacks are the small perturbation assumption, a gaussian response for the propagated uncertainty, and this requires adjoint computations that can be difficult to implement and perform with every calculation code and on every response.
2.3 Total Monte Carlo approach
2.3.1 General principle
Since the dispersion of random cross sections reflects the uncertainty of the nuclear data, this uncertainty can be directly propagated with distinct neutronics calculations. The uncertainty on the response is finally computed through the response value on each calculation.
The advantages of this approach are its applicability for any kind of calculation code (distinct runs without code modification), no first order assumption, and a straight forward methodology. The first drawback is the computation cost that might be very important if a single calculation run is long. For example if one looks at a system with a small propagated uncertainty due to nuclear data σND ~ 2%, then the statistical uncertainty σstat due to the Monte Carlo calculations must be much smaller than 2%. Additionallythe required memory associated to all the cross section files can be large, and the calculation procedures have to be automatisedfor a user-friendly utilisation.
2.3.2 Extension to the Bayesian Monte Carlo
One of the final objectives of the PETALE experimental programme that motivated the work presented here is to provide valuable results for data assimilation in the nuclear data. Different approaches, the main ones briefly listed below, exist in order to assimilate the pieces of information from the integral experiment to the nuclear database. Based on sensitivity calculations, the GLLS (Generalized Linear Least Square) [11,12] method can be used to perform the data assimilation using a sensitivity vector and correlation matrices. The MOCABA [13] method is a Monte Carlo version of the GLLS replacing the sensitivity vector by a Monte Carlo sampling of the nuclear data to avoid the linearity assumption on the effect of a perturbation. A third version is the Bayesian Monte Carlo (BMC) [8,14] that consists in associating a weight wx given in equation (1) to the TMC random cross section ACE files x. This weight represents the agreement between these ACE files and the experiment using a “chi-2’’  , for example using the keff observable on a criticality experiment
 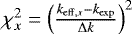 .
.
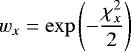 (1)
(1)
The latter method is the long-term targeted approach for the analysis of the PETALE experimental programme as described in the twin article [3]. Even if not used in this article, this approach has some constraints that we try to solve here. Depending on the experiment, the BMC approach can suffer from a too large computation time. If it is applied on a reactivity estimation, or a spectral index in a fast system requiring a small computation time, launching hundreds of calculations is possible with a reasonable computation time. In our application case, the observable is a reaction rate in small dosimeters, some of them with a threshold reaction, located at the core periphery of a thermal reactor. Thanks to the variance reduction, the raw neutrons simulated are focused around the dosimeters to estimate the reaction rates with a reasonable computation time. However a large number of calculations is still required, and Section 2.4 presents the developed acceleration technique that allows to estimate the reaction rates associated to different cross section files together in the same neutronic calculation.
2.4 Correlated sampling acceleration
2.4.1 Principle
The correlated sampling technique is used to estimate the neutron transport in a single calculation and to decline the results obtained as if they were calculated with different cross section databases. The general principle of this technique and its implementation are described in this paragraph, a detailed presentation of this implementation in the Serpent2 code is available in [15] for thermal feedback estimations.
The overall principle of the correlated sampling is a modification of the neutron weight depending on the cross section modification between a reference system and a modified system. The modification of the system may concern density, concentration, temperature or microscopic cross sections for example. At each event occurring during the neutron transport, a probability is calculated for this event in each system, for example Σtot exp(−l ⋅ Σtot) is the probability density function for a neutron to interact at the distance l. Then, doing the transport using the reference system properties, but modifying the neutron weight by the ratio of probabilitiesbetween the modified and the reference systems makes the neutron representative of the modified system.
For example, if an event is chosen (e.g. the choice of the interaction type) and the probability that this event occurs is larger in the modified system, then the neutron weight is increased accordingly. Then, for each reaction rate score evaluated after this interaction, this score is performed twice: one with the normal neutron weight for the reference system, and a second one using the larger modified weight. The second score has a larger importance since the path leading to this state is more probable in the modified system. This process being multiplicative, for a given modified system the neutron only needs to be associated to a single modified weight, each event modifying this weight with a multiplication by the probability ratios.
The modified weight is transmitted to the neutron’s fission sons in order to propagate the effect of the cross section difference on a large number of generations. The neutron weight at its birth corresponds to the ‘modified neutron source’ in the modified system. In order to limit the neutron weight dispersion after a large number of generations, the memory of the weight modificationis voluntary lost after a given number of generations determined through a sensitivity study. For this reason, the neutron numerical object is associated to an array of weights of the previous generations, this array being modified not during the neutron propagation but at each new generation.
2.4.2 Application to TMC uncertainty propagation
The Monte Carlo calculation is performed using one of the versions of the TENDL cross section files as reference system, usually the first one since all of them are considered equivalent. The implementation of the correlated sampling technique presented in this article has been generalised to a number of x cross section files. Each ACE file from TENDL corresponds to one modified system and each neutron is associated to an array of arrays of weights corresponding to the ‘ACE file numbers’ cross ‘ancestor number’. For each score, the calculation is done for each of the corresponding system, then for all the TENDL ACE files together.
An additional keyword autopert is added in the Serpent2 input to activate the correlated sampling on a material, followed by the starting ACE file number and the total number of files that are used together. For example, an iron material definition with a density of 7.874 g/cm3 using the FeAA.0000c as reference file, plus 255 other modified files (FeAA.0001c, FeAA.0002c …FeAA.0255c) is written in the Serpent2 material definition by adding “autopert 0 256" as illustrated in Figure 2.
Since multiple isotopes are perturbed together, two possibilities exist: associating all the possible combinations (for 2 isotopes: 0/0, 0/1, 1/0, 1/1,…), or using the same ACE file number for all the isotopes (0/0, 1/1, 2/2,…). We chose the second option in this implementation in order to test a larger number of ACE files. Note that using these results for a nuclear data assimilation, all the iron isotopes will be correlated.
During the Monte Carlo calculation, each neutron is associated to a vector of weights, each weight corresponding to one ACE number (Fe54.0000c/Fe56.0000c, or Fe54.0001c/Fe56.0001c,…).
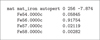 |
Fig. 2 Iron material definition with 256 different ACE files. |
3 Description of the application critical systems
3.1 HMI-001 benchmark
The first system considered is the highly enriched uranium/iron metal core surrounded by a stainless-steel reflector system (HMI-001 [16]). This system is very sensitive to the iron cross section due to two effects: its impact on the neutron leakage in the stainless-steel reflector and also the presence of iron in the fuel itself.
In this system the observable is the reactivity. It differs from the final application objective, mainly reaction rates in dosimeters, but the capability to predict the uncertainty propagation on this system is a good sanity check of the algorithm and of its implementation. Note that the impact of the perturbation is large, around 1000 pcm, so the limits of small perturbation assumptionsmight be visible.
3.2 PETALE description
3.2.1 Core description
The CROCUS reactor represented in Figure 3 is a zero power light water reactor operated at Ecole Polytechnique Fédérale de Lausanne (EPFL) for teaching and research activities [17]. It is composed of two interlocked fuel areas, with oxide uranium enriched at 1.806% in the inner zone and metallic uranium enriched at 0.947% at the periphery. The detailed CROCUS geometry is described in [18].
3.2.2 Brief description of the PETALE experimental program
The PETALE experimental programme aims at providing a precise characterisation of the neutron flux amplitude and spectralvariation in a heavy reflector. The in-core device allows up to eight successive thick metal plates of 2×30×30 cm3 interleaved with nine thin activation foils (dosimeters), one between each plate and two at the endpoints of the device. The foils will be extracted to measure their activation. More details on the experiment can be found in [19] and in the twin article [3] dedicated tothe experiment itself. In this paper, we consider the example of indium foils for which two pieces of information are available: the capture and the inelastic scattering cross sections, the latter being a threshold reaction sensitive to fast neutrons.
Figure 4 presents the neutron flux with a linear scale in CROCUS and the heavy reflector plates of the PETALE’s metal reflector upper left.
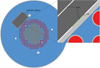 |
Fig. 3 Axial CROCUS geometry represented using the Serpent2 code, with addition of the PETALE metal reflector. The oxide uranium fuel is displayed in orange, the metallic uranium fuel in red, and the water in blue. The four circles out of the metallic fuel zone are the reactor monitors, namely fission and ionisation chambers, and the PETALE experiment is the grey element at the North-West (top-left) of the reactor. A zoom on the interface between CROCUS and PETALE shows the first foil with a width multiplied by 10 in order to be visible (1 g of indium for the first foil instead of 0.1 g). |
4 Application and validation
Different observables can be used to test this uncertainty propagation approach, as explained in this section. The first common one is the effective multiplication factor, applicable to the HMI-001 benchmark and to the CROCUS reactor. The other observables are the reaction rates or the neutron flux spectra in the dosimeters of the PETALE experimental program.
4.1 HMI-001 benchmark – keff
Different cross section uncertainties have been considered in this work. Three plus one uncertainty propagation approaches are compared:
-
Reference Total Monte Carlo referred as TMC-Ref.
-
TMC with the Correlated Sampling technique named TMC-CS.
-
The sensitivity+covariance matrix approach named sensi.
-
An additional approach is based on the ratio between the reference and all the other cross sections taken one by one. This ratio multiplied by the sensitivity estimate a keff variation for each ACE file. This approach is referred as TMC-sensi.
In order to be consistent for the comparison, the covariance matrices used for the sensi results are generated directly from the random cross sections as in Figure 1. Note that 256 random cross sections are used here due to the limited number of files available. Since the uncertainty on the covariance of these cross sections is small (bottom-left of the correlation matrix) this means that all the configurations are well represented in the package of cross sections and the number of cross section files is large enough as confirmed by a sensitivity study.
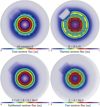 |
Fig. 4 Horizontal 2D map of the neutron flux in linear scale, for all energies, and separately thermal, epithermal, and fast contributions. The flux is averaged axially over 10 cm around the mid-height of the core, and the PETALE device consequently. |
keff dispersion due to 56Fe uncertainty using 256 random cross section files.
4.1.1 TENDL iron-56 uncertainty
Using the TENDL 56Fe random cross section files, the uncertainty propagation on keff is presented in Figure 5. This figure presents together the dispersions of the three TMC based uncertainty propagations. The corresponding results on the standard deviation are presented in Table 1. The order of magnitude of the propagated uncertainty is similar. The number of energy bins for the sensitivity vector and covariance matrix for the sensi approach has been adjusted to 10 000 according to a sensitivity study.
Both TMC-CS and TMC-sensi approaches have a similar behaviour compared to TMC-Ref on the second line of Figure 5 (middle and right). The non linearity assumption of the sensitivity starts to be visible for large keff variations in the TMC-sensi results with a coma trend. This effect is not observed on the TMC-CS results where the agreement with the reference is better, even if we can see a larger uncertainty for large variations but with a reduced residual.
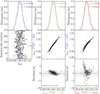 |
Fig. 5 keff distribution associated to 56Fe uncertainty. The plots on first line respectively present the results of the TMC-Ref, TMC-CS and TMC-sensi approaches. The second line corresponds to the keff values for each random file (1st column) andthe agreement between the approaches (2nd and 3rd column). The third line presents the associated residuals. |
4.1.2 “Extended TENDL” on nuclear models
In the context of the improvement of the modelling of the random cross section file generation, new random cross sections have been generated by modifying the model parameters and also the nuclear models themselves. These generated cross sections may then be more different, even if a comparison process with the EXFOR database is still done for these cross sections. This difference is directly observable in Figure 6 at high energy with two distinct groups of capture and inelastic cross sections corresponding to two different models.
The uncertainty propagation associated to these cross sections is presented in Figure 7. We can see that, for the first 40 cross sections, the cross sections are not too different from the reference one (arbitrary the ACE file number 0). When modifying the nuclear models, the cross section is more different and a non-linearity appears with the TMC-sensi approach as illustrated on the right plot in the bottom line. This leads to a systematic error and then a shift of the keff distribution on the right plot in the top line.
 |
Fig. 6 80 56Fe random cross section, using 2 random nuclear models times 40 random parameters. |
4.1.3 TENDL iron-54 uncertainty
Finally, the uncertainty due to 54Fe has been propagated in the HMI-001 benchmark. Figure 8 presents the distribution of the multiplication factor as previously, with a difference in the right column: the (n,γ) reaction hasbeen unactivated in the sensitivity analysis to understand the origin of the different effects. Figure 9 presents the sensitivity distribution (top) of different reactions (columns), the relative cross section uncertainty (bottom), and the product of this uncertainty by the square of the sensitivity (middle). This middleline represents a qualitative information on the different reaction-energy contributions to the uncertainty propagation. Note that the uncertainty propagation using the sandwich rule provides an uncertainty on keff of 366 pcm, closer to that of the TMC-CS approach (191 pcm) than the TMC-sensi one (541 pcm).
Different elements can be noticed on these results. The dispersion of the Δkeff using the sensitivities is much higherthan on the 56Fe when perturbating all the reactions. By removing the capture reaction, this dispersion is reduced which means that a non-linearity comes from this 54 Fe(n,γ) reaction.
In Figure 9 we can see that the integrated contribution (black curve) increases a lot between the two first peaks in the cross section uncertainty. In fact these peaks are not due to 54 Fe but to an 56 Fe resonance: the latter isotope having a locally very low cross section, 54Fe has a higherimportance on the neutron propagation. This phenomenon seems to be correctly taken into account since the response in Figure 8 is almost linear on the right curve.
Concerning the (n, γ) reaction (green curves in Fig. 9), we can see that the sensitivity at high energy is not very important but the uncertainty is very high. For this reason the propagated uncertainty (black curve in the middle line) is very high for some of the cross section files, leading to a non-linear behaviour, with a larger amplitude that the (n, el) contribution.
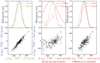 |
Fig. 8 keff variation between random cross sections of 54Fe, histogram (top) and comparison to TMC-Ref (bottom). The columns present the results of TMC-CS (left), TMC-sensi as previously done (middle), and TMC-sensi without the (n,γ) reaction (right). |
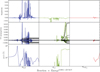 |
Fig. 9 Qualitative uncertainty propagation (without correlations): sensitivity (top), relative uncertainty (bottom), and product (middle) together with the cumulative propagated uncertainty curve in black. |
4.2 CROCUS reactor – keff
The same kind of analysis has be done for the CROCUS reactor and the iron configuration of the PETALE experimental program. Figure 10 presents the uncertainty propagation due to 56 Fe of the metalreflector on the multiplication factor of the reactor. Even if the agreement is not perfect, the uncertainty propagation is equal to only 3 pcm for both uncertainty propagation approaches. Moreover, for each cross section file, the predicted reactivity variation is similar for both approaches. A reference value cannot be computed with a classic TMC full core calculation, around two days of calculation being required to obtain a single keff value for one cross section file with a statistical uncertainty of 3 pcm, while the nuclear data uncertainty of iron is also around 3 pcm. For this reason, the next paragraph focuses on the uncertainty propagation of the neutron flux in the dosimeters, the relative variation being larger and then the computation time of the reference is reasonable.
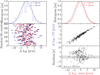 |
Fig. 10 keff variation between random cross sections of 56Fe. The columns present the results of TMC-CS (left) and TMC-sensi (right) as previously done. |
4.3 CROCUS reactor – Neutron spectra
This paragraph focuses on the validation on the TMC-CS approach by comparison to TMC-Ref on the indium dosimeters of the iron configuration of the PETALE device. Discussions on the experiment itself are detailed in the twin article [3], this section focuses on the obtained results concerning the correlated sampling aspects, using indium as material for the dosimeters as an example. In this section all the iron cross section isotopes and mt reactions are perturbed altogether.
Note that the results presented here are computed on a desktop computer with a similar computation time of 2 days for all the calculations (1 calculation using the CS, n calculations for the reference TMC). For efficiency purpose, these results use a developed variance reduction technique detailed in [3] with a figure of merit from 10 to 50 respectively for the fast and the thermal neutrons in the dosimeters.
Figure 11 presents the neutron flux in the dosimeters. The nine different dosimeters have a different color, from blue for the one in the iron reflector close to the core, to red for the one in the iron reflector the most distant from the core. All the coloured-curves results are obtained with the correlated sampling technique in a single calculation. The first plot-line represents the neutron flux in the dosimeters, for two different random sets of cross sections. The second plot-line presents the reaction rate distribution, note the slightly different values in the resonance range. The third and fourth plot-lines present the difference of neutron flux obtained using the first TENDL ACE file and the random ACE file considered in the columns. The black curves present the results obtained with the TMC-Ref approach (difference of flux obtained with two independent calculations). Finally the last plot-line presents the residuals obtained for all the dosimeters at all the energies.
We can observe a very good agreement between the reference and the correlated sampling results. The curves behaviour are the same even if the statistical uncertainty of the reference calculation is larger. The reference flux variation (black) is estimated using two independent calculations with different seeds and neutron paths during the simulation, involving independent statistical fluctuations and a large statistical uncertainty on the tally difference. This spectrum redistribution between ACE files is an interesting piece of information to see the spectrum uncertainty coming from the nuclear data uncertainties.
Due to the energy discretisation, a systematic comparison between the flux spectra of all the cross sections is complex. An equivalent information is the comparison of the total reaction rates in the dosimeters between different cross section files (see Fig. 12). The first plot-line presents the reaction rate in the dosimeters as a function of the dosimeter number (1 is closest to the core and 9 is farthest away from the core), with the capture reaction on the left and the inelastic one on the right. The different colours correspond to different random cross sections. The second plot-line is the relative difference to the reactionrate obtained with the first cross section set. The results obtained with the classical TMC-Ref are represented in dashed line. The corresponding residuals are displayed in the third plot-line. Finally, the fourth plot-line presents the reaction rate dispersion for all the dosimeters, with TMC-CS in red and TMC-Ref in dashed blue.
Once again, a same behaviour is obtained between the reaction rates estimated with the correlated sampling technique and the reference one, and the statistical uncertainty is reduced for TMC-CS. The complementary information is that this is working for all the perturbed cross sections, and the approach can also be used to perform global uncertainty propagation on the reaction rates.
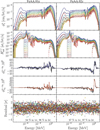 |
Fig. 11 Normalised neutron spectra in the different volumes (from blue to red when increasing the radial position of the indium dosimeter) at the top, declined for the FeAA.01c (left) and FeAA.02c (right) ACE files; in the middle plots, differences with the FeAA.00c results for different dosimeters (reference in black and specific dosimeter in the corresponding color) are presented; residuals of the flux for each energy bin and dosimeter at the bottom. |
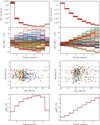 |
Fig. 12 Reaction rate distribution (top) for capture (left) and inelastic (right) reactions, relative variation (second line) with the reference in dashed line, residuals (third line) and reaction rate dispersion (bottom). |
4.4 Note on the computation efficiency
4.4.1 About RAM
Depending of the cross section files, the correlated sampling technique cannot run all the available random ACE files. For the iron cross sections (all isotopes) from TENDL, a simultaneous calculation of 64 cross sections requires 40 GB. For calculations requiring more than 64 cross sections, the calculation is simply split and the same reference cross section is used for all the calculations.
4.4.2 About computation time
The two considered cases have a very different behaviour regarding the computation efficiency. For the study of the iron reflector in the CROCUS reactor, the amount of reactions in this reflector is small compared to all the neutrons propagated in the reactor. For this reason, even if at each interaction in the iron the cross section and all the related probabilities are calculated 64 times, the computation time is not linear and is of around 6 days instead of 2 × 64 days. Concerning the HMI-001 benchmark, even if the gain is still positive, the correlated sampling technique is not as advantageous since all the materials of the geometry contain iron: the computation time is multiplied by 10 for 32 simultaneous cross sections (including a longer initialisation phase). Note that these results are preliminary, as these calculations have been done with a local modified version of Serpent2 with an optimisation to be done on the correlated sampling implementation.
4.4.3 About statistical convergence
For the CROCUS application, the parameters of interest have a relatively small dependence on the nuclear data uncertainty and thus need a long calculation to estimate it properly. The CS capability to avoid the residual statistical error due to a difference of two independent tallies is very interesting and can allow to reduce the computation time accordingly (not done in this study). On the other side, a very large uncertainty such as 1000 pcm on the keff of the HMI-001 benchmark allows very short calculations well adapted for the classic TMC.
Finally for the computation efficiency, the memory load is larger, but many independent calculations are replaced by a single one, and the number of propagated neutrons can be reduced for a given target uncertainty on a score variation between the reference and modified systems.
5 Conclusions and perspectives
The correlated sampling technique has been chosen to replace multiple independent calculations with different cross section databases by a single calculation to speed-up the TMC uncertainty propagation. The statistical uncertainty obtained on the tally variation is reduced compared to independent calculations where the statistical uncertainties are quadratically summed.
This technique is implemented through specific developments which consist in associating a large number of modified materials in the calculation and the use of matrices of perturbed weights associated to each neutron. It has been tested and compared to classic sensitivity and TMC uncertainty propagation with very good results on the HMI-001 benchmark for reactivity effects and on the CROCUS reactor for reactor dosimetry. This confirms that this approach is suitable for uncertainty propagation of reaction rate estimation in light-water reactors such as CROCUS.
Future studies will also be carried out to include the propagation of fission neutron spectra for fissile materials and the angular correlation in the correlated sampling technique. Another future aspect will be the approach validation on other reactivity and spectralindex benchmarks in order to extend the validation basis.
Acknowledgements
This work has been carried out within the framework of the EUROfusion Consortium and has received funding from the Euratom research and training program 2014–2018 under grant agreement No 633053. Theviews and opinions expressed herein do not necessarily reflect those of the European Commission.
Author contribution statement
Axel Laureau carried out the model development andnumerical implementation, with the help of Vincent Lamirand for the PETALE related aspects and of Dimitri Rochman for the uncertainty propagation related aspects. Andreas Pautz supervised the project. All authors discussed the results and contributed to the final manuscript
References
- D. Rochman, A.J. Koning, D.F. Da Cruz, Uncertainties for the kalimer sodium fast reactor: void reactivity coefficient, keff, βeff, depletion and radiotoxicity, J. Nucl. Sci. Technology 48, 1193 (2011) [CrossRef] [Google Scholar]
- L. Volat, B. Gastaldi, A. Santamarina, A stochastic method to propagate uncertainties along large cores deterministic calculations, EPJ Nuclear Sci. Technol. 4, 12 (2018) [CrossRef] [EDP Sciences] [Google Scholar]
- A. Laureau, V. Lamirand, D. Rochman, A. Pautz, Uncertainty propagation for the design study of the PETALE experimental programme in the CROCUS reactor, EPJ Nuclear Sci. Technol. 6, 9 (2020) [CrossRef] [EDP Sciences] [Google Scholar]
- D. Rochman, A. Koning, S. van der Marck, A. Hogenbirk, D. van Veen, Nuclear data uncertainty propagation: Total monte carlo vs. covariances, J. Korean Phys. 59, 1236 (2011) [Google Scholar]
- H. Rief, Generalized Monte Carlo perturbation algorithms for correlated sampling and a second-order Taylor series approach, Ann. Nucl. Energy 11, 455 (1984) [CrossRef] [Google Scholar]
- D. Rochman, A.J. Koning, J.C. Sublet, M. Fleming, E. Bauge, S. Hilaire, P. Romain, B. Morillon, H. Duarte, S. Goriely, et al., The tendl library: Hope, reality and future, EPJ Web Conf. 146, 02006 (2017) [Google Scholar]
- B. Efron, Nonparametric estimates of standard error: the jackknife, the bootstrap and other methods, Biometrika 68, 589 (1981) [CrossRef] [Google Scholar]
- A.J. Koning, D. Rochman, Modern nuclear data evaluation with the talys code system, Nuclear Data Sheets 113, 2841 (2012) [Google Scholar]
- D. Rochman, W. Zwermann, S.v.d. Marck, A. Koning, H. Sjöstrand, P. Helgesson, B. Krzykacz-Hausmann, Efficient use of monte carlo: uncertainty propagation, Nucl. Sci. Eng. 177, 337 (2014) [CrossRef] [Google Scholar]
- M. Aufiero, A. Bidaud, M. Hursin, J. Leppänen, G. Palmiotti, S. Pelloni, P. Rubiolo, A collision history-based approach to sensitivity/perturbation calculations in the continuous energy monte carlo code serpent, Ann. Nucl. Energy 85, 245 (2015) [Google Scholar]
- G. Cecchini, U. Farinelli, A. Gandini, M. Salvatores, Analysis of integral data for few-group parameter evaluation of fast reactors, Tech. rep., Italy. Comitato Nazionale per l’Energia Nucleare, Rome, 1964 [Google Scholar]
- M. Salvatores, G. Palmiotti, G. Aliberti, R. McKnight, P. Archier, C. De Saint Jean, E. Dupont, M. Herman, M. Ishikawa, K. Sugino et al., Methods and issues for the combined use of integral experiments and covariance data, Tech. rep., in Working Party on International Nuclear Data Evaluation Co-operation-WPEC, 2013 [Google Scholar]
- A. Hoefer, O. Buss, M. Hennebach, M. Schmid, D. Porsch, Mocaba: a general monte carlo–bayes procedure for improved predictions of integral functions of nuclear data, Ann. Nucl. Energy 77, 514 (2015) [CrossRef] [Google Scholar]
- D. Rochman, E. Bauge, A. Vasiliev, H. Ferroukhi, Correlation ν¯p− σ− χ in the fast neutron range via integral information, EPJ Nuclear Sci. Technol. 3, 14 (2017) [CrossRef] [EDP Sciences] [Google Scholar]
- A. Laureau, L. Buiron, B. Fontaine, Local correlated sampling Monte Carlo calculations in the TFM neutronics approach for spatial and point kinetics applications, EPJ Nuclear Sci. Technol. 3, 16 (2017) [CrossRef] [EDP Sciences] [Google Scholar]
- The uranium/iron benchmark assembly: A 235U(93%)/iron cylinder reflected by stainless steel, Tech. rep., NEA/NSC/DOC (95) 03/II [Google Scholar]
- V.P. Lamirand, M. Hursin, G. Perret, P. Frajtag, O. Pakari, A. Pautz, Future experimental programmes in the crocus reactor, in Conference proceedings of RRFM/IGORR 2016, no. EPFL-CONF-218310 (2016), pp. 284–292 [Google Scholar]
- U. Kasemeyer, R. Früh, J. Paratte, R. Chawla, Benchmark on kinetic parameters in the CROCUS reactor, in International Reactor Physics Experiments Handbook (IRPhE) (4440) (Ed. 2007) 94 (2007) [Google Scholar]
- V.P. Lamirand, G. Perret, S. Radman, D.J. Siefman, M. Hursin, P. Frajtag, A. Gruel, P. Leconte, P. Blaise, A. Pautz, Design of separated element reflector experiments in crocus: Petale, in ISRD16 International Symposium on Reactor Dosimetry, no. CONF, 2017 [Google Scholar]
Cite this article as: Axel Laureau, Vincent Lamirand, Dimitri Rochman, Andreas Pautz, Uncertainty propagation based on correlated sampling technique for nuclear data applications, EPJ Nuclear Sci. Technol. 6, 8 (2020)
All Tables
All Figures
|
Fig. 1 56 Fe neutron elastic scattering (left), capture (middle) and inelastic scattering (right) cross-sections from TENDL2017 database [6], 256 random ACE files (1st line), relative uncertainty (2nd line) and correlation matrix (3 last lines) represented with its standard deviation estimated with a Jackknife resampling technique [7]. |
| In the text | |
|
Fig. 2 Iron material definition with 256 different ACE files. |
| In the text | |
|
Fig. 3 Axial CROCUS geometry represented using the Serpent2 code, with addition of the PETALE metal reflector. The oxide uranium fuel is displayed in orange, the metallic uranium fuel in red, and the water in blue. The four circles out of the metallic fuel zone are the reactor monitors, namely fission and ionisation chambers, and the PETALE experiment is the grey element at the North-West (top-left) of the reactor. A zoom on the interface between CROCUS and PETALE shows the first foil with a width multiplied by 10 in order to be visible (1 g of indium for the first foil instead of 0.1 g). |
| In the text | |
|
Fig. 4 Horizontal 2D map of the neutron flux in linear scale, for all energies, and separately thermal, epithermal, and fast contributions. The flux is averaged axially over 10 cm around the mid-height of the core, and the PETALE device consequently. |
| In the text | |
|
Fig. 5 keff distribution associated to 56Fe uncertainty. The plots on first line respectively present the results of the TMC-Ref, TMC-CS and TMC-sensi approaches. The second line corresponds to the keff values for each random file (1st column) andthe agreement between the approaches (2nd and 3rd column). The third line presents the associated residuals. |
| In the text | |
|
Fig. 6 80 56Fe random cross section, using 2 random nuclear models times 40 random parameters. |
| In the text | |
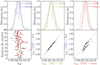 |
Fig. 7 See Figure 5 legend, applied to random cross section of Figure 6. |
| In the text | |
|
Fig. 8 keff variation between random cross sections of 54Fe, histogram (top) and comparison to TMC-Ref (bottom). The columns present the results of TMC-CS (left), TMC-sensi as previously done (middle), and TMC-sensi without the (n,γ) reaction (right). |
| In the text | |
|
Fig. 9 Qualitative uncertainty propagation (without correlations): sensitivity (top), relative uncertainty (bottom), and product (middle) together with the cumulative propagated uncertainty curve in black. |
| In the text | |
|
Fig. 10 keff variation between random cross sections of 56Fe. The columns present the results of TMC-CS (left) and TMC-sensi (right) as previously done. |
| In the text | |
|
Fig. 11 Normalised neutron spectra in the different volumes (from blue to red when increasing the radial position of the indium dosimeter) at the top, declined for the FeAA.01c (left) and FeAA.02c (right) ACE files; in the middle plots, differences with the FeAA.00c results for different dosimeters (reference in black and specific dosimeter in the corresponding color) are presented; residuals of the flux for each energy bin and dosimeter at the bottom. |
| In the text | |
|
Fig. 12 Reaction rate distribution (top) for capture (left) and inelastic (right) reactions, relative variation (second line) with the reference in dashed line, residuals (third line) and reaction rate dispersion (bottom). |
| In the text | |
Current usage metrics show cumulative count of Article Views (full-text article views including HTML views, PDF and ePub downloads, according to the available data) and Abstracts Views on Vision4Press platform.
Data correspond to usage on the plateform after 2015. The current usage metrics is available 48-96 hours after online publication and is updated daily on week days.
Initial download of the metrics may take a while.