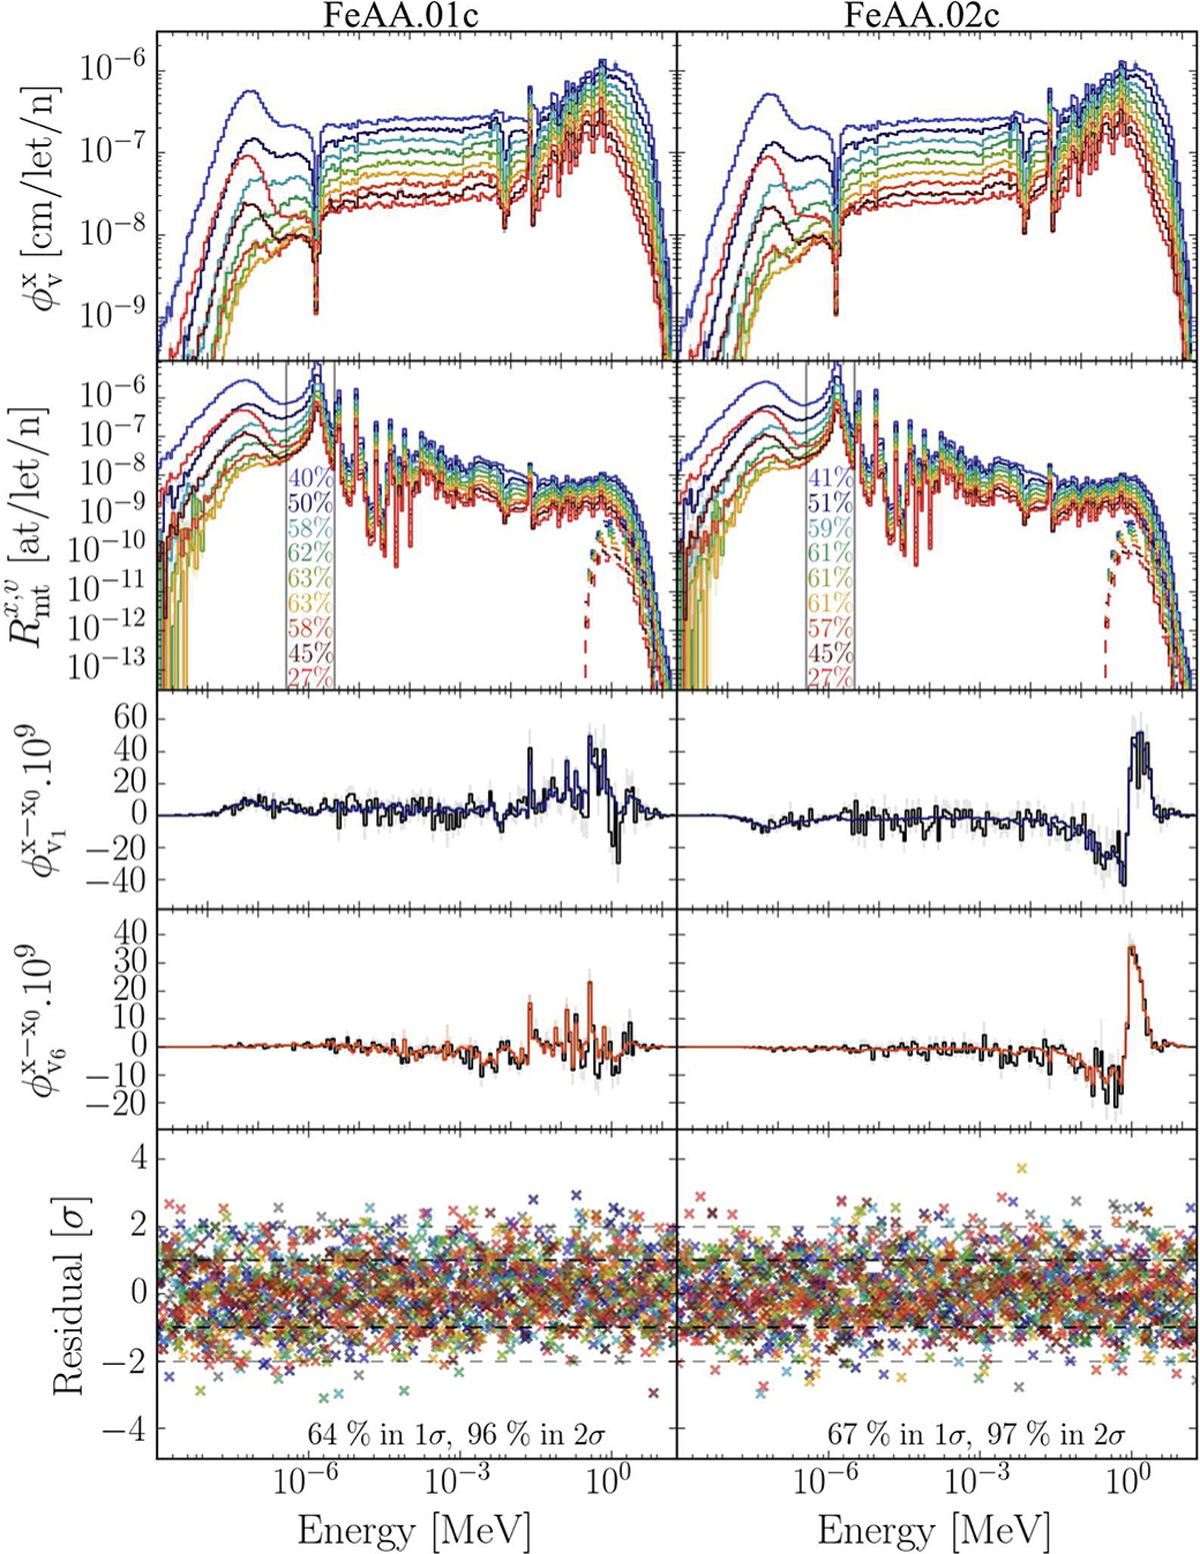
Fig. 11
Download original image
Normalised neutron spectra in the different volumes (from blue to red when increasing the radial position of the indium dosimeter) at the top, declined for the FeAA.01c (left) and FeAA.02c (right) ACE files; in the middle plots, differences with the FeAA.00c results for different dosimeters (reference in black and specific dosimeter in the corresponding color) are presented; residuals of the flux for each energy bin and dosimeter at the bottom.
Current usage metrics show cumulative count of Article Views (full-text article views including HTML views, PDF and ePub downloads, according to the available data) and Abstracts Views on Vision4Press platform.
Data correspond to usage on the plateform after 2015. The current usage metrics is available 48-96 hours after online publication and is updated daily on week days.
Initial download of the metrics may take a while.