Fig. 5
Download original image
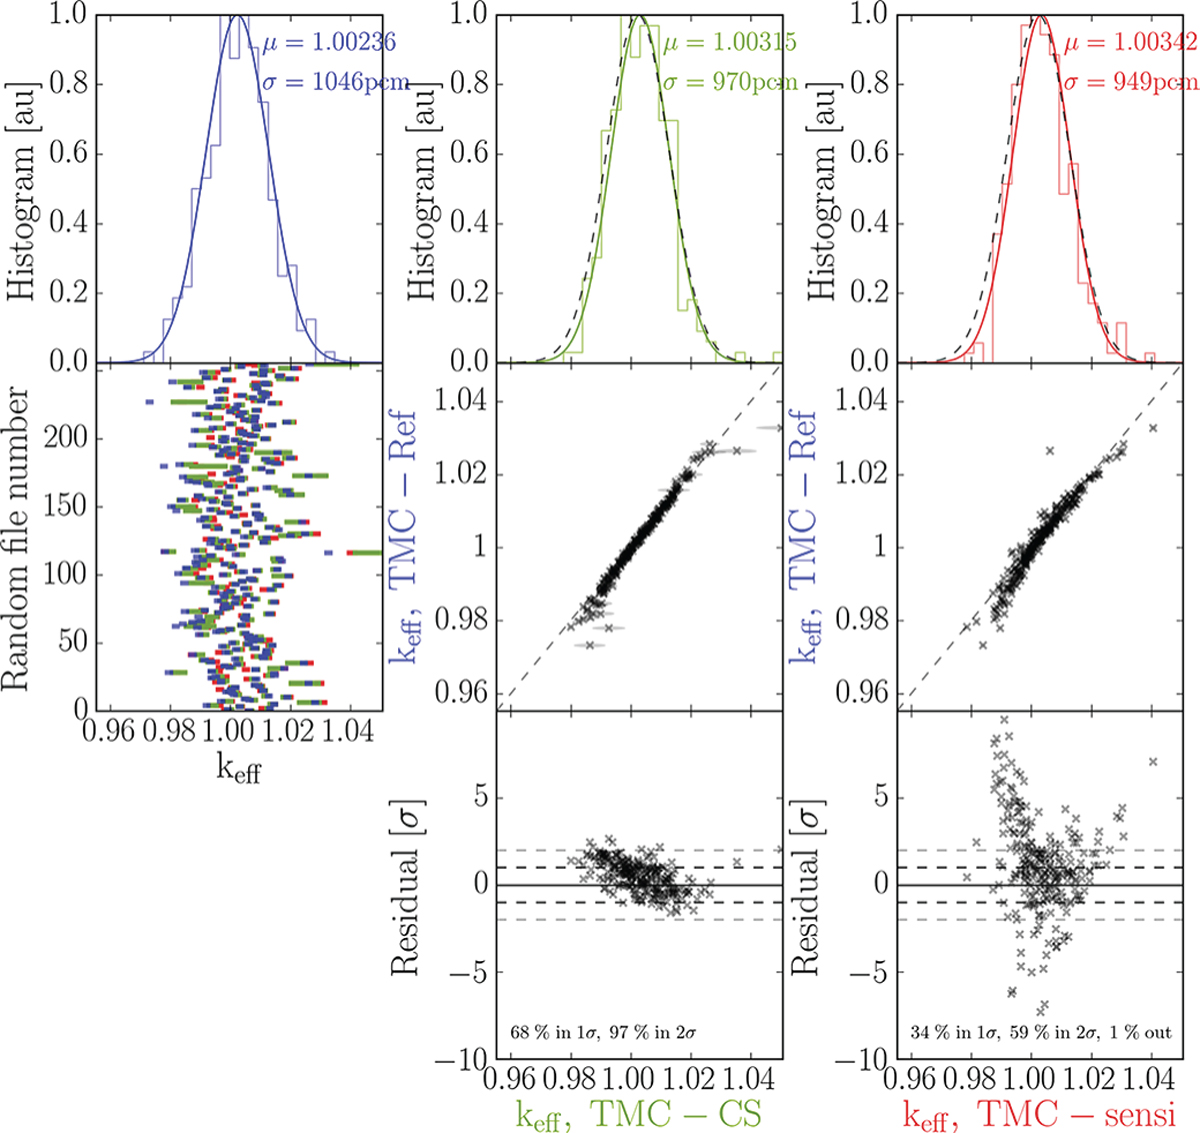
keff distribution associated to 56Fe uncertainty. The plots on first line respectively present the results of the TMC-Ref, TMC-CS and TMC-sensi approaches. The second line corresponds to the keff values for each random file (1st column) andthe agreement between the approaches (2nd and 3rd column). The third line presents the associated residuals.
Current usage metrics show cumulative count of Article Views (full-text article views including HTML views, PDF and ePub downloads, according to the available data) and Abstracts Views on Vision4Press platform.
Data correspond to usage on the plateform after 2015. The current usage metrics is available 48-96 hours after online publication and is updated daily on week days.
Initial download of the metrics may take a while.