| Issue |
EPJ Nuclear Sci. Technol.
Volume 6, 2020
|
|
|---|---|---|
| Article Number | 51 | |
| Number of page(s) | 11 | |
| DOI | https://doi.org/10.1051/epjn/2020014 | |
| Published online | 18 August 2020 | |
https://doi.org/10.1051/epjn/2020014
Regular Article
Numerical design of thorium and uranium fuel samples irradiation in lead environment
AGH University of Science and Technology, Faculty of Energy and Fuels, Department of Nuclear Energy, al. Mickiewicza 30, 30-059 Krakow, Poland
* e-mail: This email address is being protected from spambots. You need JavaScript enabled to view it.
Received:
11
February
2020
Received in final form:
14
April
2020
Accepted:
9
July
2020
Published online: 18 August 2020
Abstract
The paper shows capabilities of thorium-lead fuel assembly for design of irradiation experiments on ThO2 and natural UO2 fuel samples using radioisotope neutron source. The main purpose of the current analysis was to determine the irradiation environment in the samples, especially: neutron spectrum, power, activity, reaction rates, production of 233Pa and 239Np as well as breeding of 233U and 239Pu. An advanced three-dimensional numerical model for Monte Carlo radiation transport and burnup simulations was developed using the Monte Carlo Continuous Energy Burnup Code (MCB). The versatility of the assembly gives a perfect opportunity to perform many irradiation experiments for R&D on the thorium and uranium fuel cycle in a different material and geometrical environments.
© M. Oettingen, published by EDP Sciences, 2020
 This is an Open Access article distributed under the terms of the Creative Commons Attribution License (https://creativecommons.org/licenses/by/4.0), which permits unrestricted use, distribution, and reproduction in any medium, provided the original work is properly cited.
1 Introduction
The paper presents the neutronic analysis of the irradiation experiments planned at the AGH University of Science and Technology in Krakow, Poland, using a state-of-the-art thorium-lead (Th-Pb) fuel assembly. The experiments consider the irradiation of ThO2 and natural UO2 fuel samples using radioisotope Cf neutron source. The fuel sample is embedded in the fuel rod placed in the array of the remaining 236 rods of either thorium or natural uranium, reflected by lead rods and bricks. The flexibility of the Th-Pb assembly allows to perform many irradiation experiments with different geometrical configurations of the core. The purpose of the current analysis is to determine the irradiation environment in the sample, especially: neutron spectrum, power, activity, production of 233Pa and 239Np as well as breeding of 233U and 239Pu for further comparison with the results of the irradiation experiments. An advanced three-dimensional numerical model for Monte Carlo radiation transport and burnup simulations was developed using the Monte Carlo Continuous Energy Burnup Code (MCB) [1], developed at the AGH University. The code was equipped with ENDF/B-VII.1 [2] and JEFF3.1 [3] nuclear data libraries for comparative study. The analysis was performed for fuel samples containing ThO2 and natural UO2 for the comparison of breeding capabilities of 233U and 239Pu.
The research mainly focuses on the ThO2 fuel sample, which was chosen because of an increasing interest in the thorium fuel cycle and a demand for more basic research into thorium fuels [4,5]. In general, thorium seems to be an attractive option for nuclear fuel mainly due to its abundance, reduced need for enrichment in the fuel cycle, high conversion ratios to 233U in a thermal neutron spectrum, low production of plutonium and minor actinides and high proliferation resistance. Although many investigations have been carried out into thorium-based fuels while thorium-fuelled power reactors have operated in the past, the thorium fuel cycle as a whole has never been fully developed. As yet, there is no commercial fabrication or reprocessing infrastructure for the thorium fuel cycle, unlike the vast available infrastructure for the uranium fuel cycle. Nevertheless, the experience gained on thorium-based fuels in test and power reactors as well as the results of the numerical analysis are very encouraging [6–9]. Therefore, the implementation of thorium fuels to the power reactor must be further supported by scientific research to allow better understanding of all components of the thorium fuel cycle. In spite of the large amount of available neutronic data for numerical modelling, better neutronic characteristics supported by experimental validation with dedicated infrastructure such as the Th-Pb assembly are needed.
In Section 2, the technical specification of the Th-Pb assembly and the developed numerical model for the Monte Carlo modelling are described. The results of the numerical modelling are shown in Section 3. Section 4 contains a summary of the study and discussion about possible improvements in the applied methodology.
2 Thorium-lead assembly numerical model
Figure 1 shows the Th-Pb fuel assembly located in the shielded irradiation bunker in the radiometric laboratory of the AGH University. The thorium core lays on the steel bottom support plate. The upper cylindrical support plate and aluminium grid fasten the core from the top. In addition, four side bars located symmetrically around the core stabilize the assembly. The side reflector surrounding the core was fabricated using lead bricks with dimensions 100 mm × 100 mm × 50 mm and hexagonal lead rods with the length of 120 cm. The cylindrical ThO2 and UO2 rods have the same length of 120 cm and radius of 5.32 mm. The active high, gap and clad thickness in both cases equals 100, 0.012 and 0.085 cm respectively. The pitch of hexagonal assembly grid is 1.27 cm. The free space of 0.04 cm between rods was designed to facilitate subtraction of the chosen rods without dismantling of the whole assembly. This, in turn, facilitates introduction of the new elements like e.g. radiation detectors, samples or other materials comprising experiments. In general, Th-Pb assembly is characterised by a quite simple construction, which is an advantage in its maintenance during planning, execution and post-processing of irradiation experiments.
The numerical reconstruction of the assembly was based on the performed profilometric measurements as well as specification of the fuel rods provided by the supplier (Bhabha Atomic Research Centre, India) [10]. The active height of the fertile material (1000 mm) was numerically divided into four radial (RZ) and three axial (AZ) zones presented in Figures 2 and 3. The subsequent zone of 25 mm represents the fuel sample, which was additionally divided into five similar axial segments for the estimation of axial distributions of key physical parameters, such as activity, power and production of the investigated isotopes. The height of each segment equals 0.5 cm, which gives the volume of 0.436 cm3. The segment mass depends on the fuel type; in the case of ThO2, it is 4.06 g and in the case of UO2–4.54 g. The isotopic composition of uranium and thorium dioxide is shown in Tables 1 and 2 respectively. For better numerical precision, results of the simulation were scored in six symmetric zones representing the samples around the neutron source, as it is shown in Figure 2. Then, the results were averaged for particular segments. The Th rods are surrounded by the hexagonal matrix of Pb rods and Pb bricks respectively. The production of 233U and 239Pu is the most effective in the thermal neutron spectrum due to the high cross-section for neutron capture on 232Th and 238U. Therefore, for the planned irradiation experiments, thermalisation zone made of hexagonal polyethylene rods (C2H4) was introduced to the assembly. For the current study, the neutron source was surrounded by two layers of polyethylene rods of 6 and 12 rods respectively. As a result, the total number of ThO2/UO2 rods in the assembly for the planned experiment equals 234, which gives ThO2 the mass of 192 kg, including 169 kg of Th, and UO2–the mass of 214 kg, including 189 kg of U (1.3 kg 235U, 187.5 kg 238U and trace amount of 234U). The materials used for the numerical modelling and their densities are shown in Table 3. For the modelling of the grid, side bars and top bars, which are characterized by the complicated geometry the volumetric homogenisation technique was applied. The neutron source was modelled according to the specification of the manufacturer [11] as a Cf2O3-Pd cermet wire closed in two stainless steel capsules. Figure 2 shows the location of the source in the middle of the assembly. The chosen source has intensity of 108 n/s, which gives mass of 43 µg of 252Cf. The planned irradiation time equals 25 days, but it can be easily shortened or extended, depends on experiment specification.
 |
Fig. 1 Th-Pb fuel assembly in the irradiation bunker. |
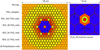 |
Fig. 2 Radial crosscut of the assembly's numerical model and the neutron source. |
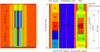 |
Fig. 3 Axial crosscut of the assembly's numerical model and the neutron source. |
The isotopic composition of the thorium sample.
The isotopic composition of the uranium sample.
Materials used in the numerical modelling.
3 Results
Section 3 presents results of the numerical modelling using the Monte Carlo Continuous Energy Burnup Code (MCB) for neutron transport and burnup simulation [1,12]. The calculations were performed for the two sets of nuclear data libraries i.e. ENDF/B-VII.1 and JEFF3.1 for comparative analysis. The supercomputer Prometheus of the Academic Computer Centre of AGH University was used for numerical simulations. The numerical precision of the obtained results is much below 0.5%. In the following subsections the characteristic of neutron spectra in the samples, mass evolutions of crucial isotopes (233Pa, 239Np, 233U, 239Pu) as well as power and activity evolutions are shown.
3.1 Neutron spectrum
Figure 4 shows the absolute neutron spectrum, while Figure 5 presents the relative neutron spectrum calculated in 100 energy group structures for ENDF/B-VII.1 nuclear data libraries at the beginning of irradiation. The shape of the spectrum is similar for both applied libraries and for particular time steps, as it is mainly formed by the Cf neutron source and polyethylene thermalisation zones. The isotopic changes in 25 days of irradiation and the Cf decay do not influence it significantly. The differences between JEFF3.1 and ENDF/B-VII.1 libraries depend on the energy group but mostly they are below 1% on average, and below 0.25% for both samples. In the spectrum, two major peaks related to thermal and fast neutrons are presented. The main difference between the ThO2 and UO2 fuel samples comes from the flux depressions due to the radiative capture cross-sections on 232Th and 238U. The first large resonance for 232Th appears at about 2 × 10⁻⁵ MeV and for 238U − at about 7 × 10⁻⁵ MeV in the epithermal energy range, which is visible in Figure 4. For 238U, two following flux depressions due to resonances at about 2 × 10⁻⁵ and 4 × 10⁻⁵ MeV are visible. The spectrum for UO2 is harder, with 17.40% of neutrons below 1 keV in the thermal and epithermal energy range, 7.28% (>1 eV) and 10.13% (>1 eV ⋀ ≤1 keV) respectively. In the case of ThO2, 19.39% neutrons are in the thermal and epithermal energy range, 8.13% and 11.26% respectively. The reason for the difference are the higher effective macroscopic neutron absorption reaction rates for uranium (234U+235U+238U: 2.58E+04 [1/s ∙ cm3] for ENDF/B-VII.1) compared with thorium (230Th+232Th: 1.76E+04 [1/s ∙ cm3] for ENDF/B-VII.1), see Tables 5 and 7. In general, the absolute neutron flux is higher in the case of the UO2 fuel sample (1.27E+06 n/cm2 ∙ s) compared with the ThO2 fuel sample (1.11E+06 n/cm2 ∙ s) due to the presence of fissionable 235U in the fresh fuel composition and the surplus fissions in the thermal and epithermal energy range.
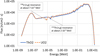 |
Fig. 4 Absolute neutron spectrum for ENDF/B-VII.1 in the central fuel segment. |
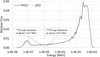 |
Fig. 5 Relative neutron spectrum for ENDF/B-VII.1 in the central fuel segment. |
3.2 Mass evolution
The mass evolution of 233Pa and 233U for both nuclear data libraries and the sample segments is shown in Figures 6 and 7. 233Pa increases almost linearly during the irradiation time of 25 days, as it is formed shortly after the neutron absorption on 232Th from decay of 233Th with a half-lifetime of 22.3 min. The formation of 233Pa depends on the neutron flux and thus on the power of the segments. The highest number of atoms for ENDF/B-VII.1 at the end of irradiation was obtained in the central segment and the lowest − in the peripheral segments, 1.16 × 10¹⁰ and 1.13 × 10¹⁰ respectively. The results for JEFF3.1 nuclear data libraries show the higher concentration of 233Pa of about 2% for the whole irradiation cycle. The rising concentration of 233Pa shows that the equilibrium state was not achieved during irradiation. The concentration of 233U increases significantly during the irradiation time because of its breeding from 232Th. At the end of irradiation, it equals 4.10 × 10⁹ atoms for ENDF/B-VII.1 nuclear data libraries in the central segment, which is consistent with the concentration of 233Pa. The results for JEFF3.1 nuclear data libraries present 233U concentrations higher by about 2%. The axial distribution of 233Pa and 233U corresponds to the power distribution. The concentration of 233U will still increase after the end of irradiation because of the 233Pa decay.
The concentration of 239Np during the irradiation time reaches the equilibrium state at about 15 days, which is shown in Figure 8. This is caused by the equilibrium between 239Np formation from decay of 239U and its further decay to 239Pu. The axial distribution of 239Np corresponds to the power distribution. At the end of irradiation for ENDF/B-VII.1 nuclear data libraries, the highest concentration of 239Np was obtained in the central segment (1.80 × 10⁹ atoms) and the lowest concentration − in the peripheral segments (1.76 × 10⁹ atoms). The calculations with JEFF3.1 nuclear data libraries show the concentration of 239Np higher by about 1%. The concentration of 239Pu increases with the irradiation time due to its breeding from 238U, which is shown in Figure 9. The highest concentration of 1.14 × 10¹⁰ atoms corresponds to the central segment of the sample and the lowest concentration of 1.11 × 10¹⁰ atoms − to the peripheral segment of the sample. JEFF3.1 nuclear data libraries in general show the concentration of 239Pu higher by about 1%. The calculations also show some minor differences between the concentrations in the symmetric segments (1–5 and 2–4) of the samples. The difference for all isotopes and time steps is below 0.4% and it is attributed to the stochastic approach of the Monte Carlo method. The total final concentrations for the investigated isotopes in the sample are shown in Table 4.
In addition, Tables 5, 6, 7 and 8 present the effective microscopic reff (1/s) and macroscopic Reff (1/s ∙ cm3) reaction rates for the sample segments. The reaction rates for the isotopes present in the initial fuel composition (230Th, 232Th, 234U, 235U, 238U) were calculated at the beginning of irradiation and for the formed isotopes (233Pa, 233U, 239Np, 239Pu) − at the end of irradiation. The radiative capture and fission reaction rates for both nuclear data libraries are shown. The axial distributions of the reaction rates show a similar shape as the power and the number of distributions of atoms for the investigated isotopes, which proves the reliability of the calculations. The reaction rates were presented as possible input for other calculations considering similar nuclear set-ups for various numerical tools used by research teams.
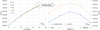 |
Fig. 6 Evolution of 233Pa during the irradiation time with final axial distribution in the sample. |
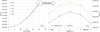 |
Fig. 7 Evolution of 233U during the irradiation time with final axial distribution in the sample. |
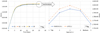 |
Fig. 8 Evolution of 239Np during the irradiation time with final axial distribution in the sample. |
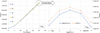 |
Fig. 9 Evolution of 239Pu during the irradiation time with final axial distribution in the sample. |
Final concentrations of the investigated isotopes.
Microscopic and macroscopic reaction rates at the beginning of irradiation for 230Th and 232Th.
Microscopic and macroscopic reaction rates at the end of irradiation for 233U and 233Pa.
Microscopic and macroscopic reaction rates at the end of irradiation for 234U, 235U and 238U.
Microscopic and macroscopic reaction rates at the end of irradiation for 239Pu and 239Np.
3.3 Power
Figures 10 and 11 present the power evolution during the sample irradiation and the final axial power distribution at the end of irradiation. In the ThO2 fuel sample, power increases smoothly from the beginning of irradiation due to the fissions on bred fissionable 233U, see Figure 7. The power increase equals about 5% compared with the beginning of irradiation. The highest power for ENDF/B-VII.1 libraries (2.11 × 10⁻⁹ W) was observed in the central segment of the fuel sample and the lowest (1.85 × 10⁻⁹ W) − in the top and bottom segments of the sample (1 and 5). The difference between the maximal and the minimal power for the central and the peripheral segments (1 vs. 3) during the whole irradiation time is about 7%. The calculations with JEFF3.1. nuclear data libraries show power higher by about 3%. The power level in the UO2 fuel sample is about one order of magnitude higher because of the initial presence of fissionable 235U in natural uranium. Initially, power decreases due to the fuel depletion because of the fissions on 235U and the lack of 239Pu. After a few days, power increases due to the formation of fissionable 239Pu and the increased number of fissions. At the end of irradiation, power is about 1% higher. The maximal power in the central segment equals about 2.75 × 10⁻⁸ W and the minimal power in the peripheral segments − 2.63 × 10⁸ W for ENDF/B-VII.1 libraries, which gives a difference of about 5%. In addition, the difference between the nuclear data libraries is much lower compared with the ThO2 fuel sample and equals about 0.3%. The reason for the differences between the nuclear data libraries may be attributed to better knowledge on the isotope cross sections in the formation chain of 239Pu than in the formation chain of 233U. The final axial power distribution corresponds to the neutron flux distribution in the samples and it is consistent with theoretical predictions, i.e. the closer to the neutron source, the higher the power is.
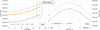 |
Fig. 10 Power evolution in the ThO2 sample during the irradiation time with final axial distribution. |
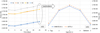 |
Fig. 11 Power evolution in the UO2 sample during the irradiation time with final axial distribution. |
3.4 Activity
The activity in the sample segments for both fuel types is shown in Figures 12 and 13. The activity is higher in the case of the UO2 fuel sample due to the fissions on the residual 235U and the formation of active fission products and due to the formation of minor actinides from the transmutations on 238U. The difference in the activity at the end of irradiation equals about 52% for each segment of the sample. The activity increases more rapidly after the initial jump in the case of UO2 and it reaches the equilibrium state faster at the end of irradiation. The activity of ThO2 increases more slowly and during 25 days of irradiation it does not reach the equilibrium state because of the much longer time (∼10 times) necessary for the formation of fissionable 233U compared with the formation of 239Pu. Moreover, the transmutation and decay chain starting from 232Th presents a longer path to the formation of notably radioactive minor actinides. The activity evolution and the final axial distribution is proportional to the power evolutions and distributions for both nuclear data libraries. Activity higher by about 2% was obtained for JEFF3.1 nuclear data libraries for the ThO2 fuel sample, while the difference for the UO2 sample equals about 0.4 %. The maximal activity for ENDF/B-VII.1 libraries for the ThO2 fuel sample equals 2.34 × 10³ Bq, and for the UO2 fuel sample − 4.44 × 10³ Bq.
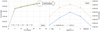 |
Fig. 12 Activity evolution in the ThO2 sample during the irradiation time with final axial distribution. |
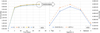 |
Fig. 13 Activity evolution in the UO2 sample during the irradiation time with final axial distribution. |
4 Discussion and summary
In the study, the design of irradiation experiments with a ThO2 and UO2 fuel sample was presented. The main dneutron characteristics of the sample located in the available experimental set-up were calculated using the developed numerical methodology based on the Monte Carlo modelling. The methodology includes the reconstruction of the experimental set-up using the functionalities of the MCB code and the high-performance computing capabilities for numerical calculations using the Prometheus supercomputer. The numerical simulations shows that some improvements are necessary for better planning of irradiation experiments. The irradiation time for the ThO2 sample should be longer in order to reach the equilibrium state of 233Pa and to cover full period of 233U production. In the study, only the irradiation time with the neutron source embedded in the assembly is considered. For the experimental measurements, the decay of the remaining 233Pa and 239Np should be also considered to estimate the number of atoms of bred fissionable isotopes, especially 233U, after the source removal. The long-term activity of the samples should be also calculated for further technical and administrative maintenance of active fuel samples. Thus, the detailed analysis considering quantitative identification of the main isotopes contributing to the radiotoxicity of the spent Th fuel is recommended.
Moreover, the experimental measurements using the detectors available in the radiometric laboratory should be performed not immediately after the removal of the neutron source from the assembly but after the removal and opening of the fuel rod for the sample extraction and preparation for measurements. The basic requirement of the experiments (uncertainties of the measurement results) will be defined after choice of the measurement methodology. The time for technical maintenance of the sample should be included in the numerical modelling. The numerical modelling should also contain analysis of the gamma spectra in the experimental set-up, especially in the in lead-filtered media.
In the future experiments, the use of many configurations of the core is foreseen. Firstly, for the spectrum thermalisation, not only polyethylene but also graphite rods may be applied. Secondly, the assembly can be loaded with depleted or natural uranium fuel rods. Thirdly, the radio isotopic Cf neutron source could be changed to e.g. Pu-Be source or even to D-T neutron generator. Finally, other irradiation positions of the sample are also possible, e.g. in the gap between the rods. The axial adjustment of the neutron source and the samples during long-term irradiations is also possible. The versatility of the assembly gives a perfect opportunity to perform many irradiation experiments for R&D on the thorium and uranium fuel cycle in a different material and geometrical environment, e.g. for the development of IV Generation nuclear reactors [13]. The use of lead may help to enhance the knowledge about the fuel behaviour in Lead-Cooled Fast Reactor and Accelerator Driven Systems [7,14], while the use of graphite − in High Temperature Gas Reactors [15]. The current study has a preliminary character in order to demonstrate the capabilities of the available experimental set-up towards integral irradiation experiments and it focuses on the numerical approach. On the other hand, the experimental measurements would also help to validate the numerical methodology developed, especially the cross-section libraries, which show some differences, especially in the decay and transmutation chain to 233U.
Acknowledgments
The research was partially supported by PL Grid Infrastructure available at the Academic Computer Centre CYFRONET AGH. In addition, partial financial support of this study under the scientific subvention 16.16.210.476 by the Polish Ministry of Science and Higher Education is kindly acknowledged.
References
- M. Oettingen, J. Cetnar, T. Mirowski, The MCB code for numerical modelling of fourth generation nuclear reactors, Comput. Sci. 16, 329–350 (2015) [CrossRef] [Google Scholar]
- M.B. Chadwick, M. Herman, P. Oblozinsky et al., ENDF/B-VII.1 nuclear data for science and technology: cross sections, covariances, fission product yields and decay data, Nucl. Data Sheets, 112(12), 2887–2996 (2011) [CrossRef] [Google Scholar]
- A. Santamarina et al., The JEFF-3.1.1 nuclear data library, JEFF Report 22, Validation Results from JEF-2.2 to JEFF-3.1.1, ISBN 978-92-64-99074-6 Nuclear Energy Agency, 2009 [Google Scholar]
- International Atomic Energy Agency, IAEA Nuclear Energy Series No. NF-T-2.4, Role of thorium to supplement fuel cycles of future nuclear energy systems, 2012 [Google Scholar]
- D.E. Serfontein, E.J. Mulder, Thorium-based fuel cycles: reassessment of fuel economics and proliferation risk, Nucl. Eng. Des. 271, 106–113 (2014) [CrossRef] [Google Scholar]
- A. Nuttin, P. Guillemin, A. Bidaud, N. Capellan et al., Comparative analysis of high conversion achievable in thorium-fueled slightly modified CANDU and PWR reactors. Ann. Nucl. Energy 40, 171–189 (2011) [CrossRef] [Google Scholar]
- A. Wojciechowski, Criticality of the thorium burnup in equilibrium state, Prog. Nucl. Energy 92, 81–90 (2016) [CrossRef] [Google Scholar]
- A. Galahom, Minimization of the fission product waste by using thorium based fuel instead of uranium dioxide, Nucl. Eng. Des. 314, 165–172 (2017) [CrossRef] [Google Scholar]
- T. Kooyman, L. Buiron, Neutronic and fuel cycle comparison of uranium and thorium as matrix for minor actinides bearing-blankets, Ann. Nucl. Energy 92, 61–71 (2016) [CrossRef] [Google Scholar]
- S.I. Abdel-Khalik, P.A. Haldy, A. Kumar, Blanket design and calculated performance for the lotus fusion-fission hybrid experimental devices test facility, Fus. Sci. Technol. 5 (2), 189–208 (1984) [Google Scholar]
- R.C. Martin, J.B. Knauer, P.A. Balo, Production, distribution and applications of californium-252 neutron sources, Appl. Radiat. Isotopes 53, 785–792 (2000) [CrossRef] [PubMed] [Google Scholar]
- J. Cetnar, General solution of Bateman equations for nuclear transmutations, Ann. Nucl. Energy 33, 640–645 (2006) [CrossRef] [Google Scholar]
- H. Gyorgy, Sz. Czifrus, The utilization of thorium in generation IV reactors, Progr. Nucl. Energy 93 (2016) [Google Scholar]
- D.K. Mohapatra, S.S. Singh, A. Riyas, P. Mohanakrishnan, Physics aspects of metal fuelled fast reactors with thorium blanket, Nucl. Eng. Des. 265, 1232–1237 (2013) [CrossRef] [Google Scholar]
- I.V. Shamanin, V.M. Grachev, Y.B. Chertkov, S.V. Bedenko, O. Mendoza, V.V. Knyshev, Neutronic properties of high-temperature gas-cooled reactors with thorium fuel, Ann. Nucl. Energy 113, 286–293 (2018). [CrossRef] [Google Scholar]
Cite this article as: Mikolaj Oettingen, Numerical design of thorium and uranium fuel samples irradiation in lead environment, EPJ Nuclear Sci. Technol. 6, 51 (2020)
All Tables
Microscopic and macroscopic reaction rates at the beginning of irradiation for 230Th and 232Th.
Microscopic and macroscopic reaction rates at the end of irradiation for 233U and 233Pa.
Microscopic and macroscopic reaction rates at the end of irradiation for 234U, 235U and 238U.
Microscopic and macroscopic reaction rates at the end of irradiation for 239Pu and 239Np.
All Figures
|
Fig. 1 Th-Pb fuel assembly in the irradiation bunker. |
| In the text | |
|
Fig. 2 Radial crosscut of the assembly's numerical model and the neutron source. |
| In the text | |
|
Fig. 3 Axial crosscut of the assembly's numerical model and the neutron source. |
| In the text | |
|
Fig. 4 Absolute neutron spectrum for ENDF/B-VII.1 in the central fuel segment. |
| In the text | |
|
Fig. 5 Relative neutron spectrum for ENDF/B-VII.1 in the central fuel segment. |
| In the text | |
|
Fig. 6 Evolution of 233Pa during the irradiation time with final axial distribution in the sample. |
| In the text | |
|
Fig. 7 Evolution of 233U during the irradiation time with final axial distribution in the sample. |
| In the text | |
|
Fig. 8 Evolution of 239Np during the irradiation time with final axial distribution in the sample. |
| In the text | |
|
Fig. 9 Evolution of 239Pu during the irradiation time with final axial distribution in the sample. |
| In the text | |
|
Fig. 10 Power evolution in the ThO2 sample during the irradiation time with final axial distribution. |
| In the text | |
|
Fig. 11 Power evolution in the UO2 sample during the irradiation time with final axial distribution. |
| In the text | |
|
Fig. 12 Activity evolution in the ThO2 sample during the irradiation time with final axial distribution. |
| In the text | |
|
Fig. 13 Activity evolution in the UO2 sample during the irradiation time with final axial distribution. |
| In the text | |
Current usage metrics show cumulative count of Article Views (full-text article views including HTML views, PDF and ePub downloads, according to the available data) and Abstracts Views on Vision4Press platform.
Data correspond to usage on the plateform after 2015. The current usage metrics is available 48-96 hours after online publication and is updated daily on week days.
Initial download of the metrics may take a while.