| Issue |
EPJ Nuclear Sci. Technol.
Volume 6, 2020
|
|
|---|---|---|
| Article Number | 52 | |
| Number of page(s) | 17 | |
| DOI | https://doi.org/10.1051/epjn/2020015 | |
| Published online | 28 August 2020 | |
https://doi.org/10.1051/epjn/2020015
Regular Article
Data assimilation of post-irradiation examination data for fission yields from GEF
1
Laboratory for Reactor Physics and Systems Behavior, École Polytechnique Fédérale de Lausanne,
Lausanne,
Switzerland
2
Nuclear Criticality Safety Division, Lawrence Livermore National Laboratory,
Livermore,
CA
94550,
USA
3
Nuclear Energy and Safety Research Division, Paul Scherrer Institut (PSI),
Villigen PSI,
Switzerland
4
Department of Physics and Astronomy, Applied Nuclear Physics, Uppsala University,
Uppsala,
Sweden
5
Nuclear Data Section, International Atomic Energy Agency,
Vienna
1400,
Austria
* e-mail: This email address is being protected from spambots. You need JavaScript enabled to view it.
Received:
9
April
2020
Received in final form:
26
June
2020
Accepted:
16
July
2020
Published online: 28 August 2020
Abstract
Nuclear data, especially fission yields, create uncertainties in the predicted concentrations of fission products in spent fuel which can exceed engineering target accuracies. Herein, we present a new framework that extends data assimilation methods to burnup simulations by using post-irradiation examination experiments. The adjusted fission yields lowered the bias and reduced the uncertainty of the simulations. Our approach adjusts the model parameters of the code GEF. We compare the BFMC and MOCABA approaches to data assimilation, focusing especially on the effects of the non-normality of GEF’s fission yields. In the application that we present, the best data assimilation framework decreased the average bias of the simulations from 26% to 14%. The average relative standard deviation decreased from 21% to 14%. The GEF fission yields after data assimilation agreed better with those in JEFF3.3. For Pu-239 thermal fission, the average relative difference from JEFF3.3 was 16% before data assimilation and after it was 12%. For the standard deviations of the fission yields, GEF’s were 100% larger than JEFF3.3’s before data assimilation and after were only 4% larger. The inconsistency of the integral data had an important effect on MOCABA, as shown with the Marginal Likelihood Optimization method. When the method was not applied, MOCABA’s adjusted fission yields worsened the bias of the simulations by 30%. BFMC showed that it inherently accounted for this inconsistency. Applying Marginal Likelihood Optimization with BFMC gave a 2% lower bias compared to not applying it, but the results were more poorly converged.
© D. Siefman et al., published by EDP Sciences, 2020
 This is an Open Access article distributed under the terms of the Creative Commons Attribution License (https://creativecommons.org/licenses/by/4.0), which permits unrestricted use, distribution, and reproduction in any medium, provided the original work is properly cited.
1 Introduction
Among nuclear data, fission yields (FYs) are very important for burn-up [1–5], decay heat [6,7], and nuclear waste management simulations [8]. These simulations need to accurately predict the concentration of fission products (FPs) in spent fuel, which requires reliable FY data with high quality covariances. Historically, nuclear data libraries only gave means and variances for FYs, not accounting for covariances or the higher moments of the distributions. A large amount of research was devoted to proposing and testing methods to generate missing FY covariance data [9–11]. One such method uses the code GEF [12–15].
GEF produces uncertainty distributions for fission observables by Monte-Carlo sampling its model parameters. For the nuclear fuel examined in this study, the uncertainties in calculated FP concentrations using GEF’s FYs were as large as 56% and averaged at 21%. Reference [16] set target accuracies on predicted FP concentrations in the spent fuel at 10%. This target accuracy is exceeded at average and at extremity when applied to the FP concentrations calculated with GEF FYs in this study.
These large biases and uncertainties make burnup calculations a strong target for data assimilation (DA) [17]. Reference [18] used GEF to assimilate the ENDF/B-VII.1 FY data as the experimental evidence in DA. Herein, we propose a similar framework that uses the experimental counterpart of calculated FP concentrations: post-irradiation examinations (PIE). PIE data have been used for nuclear data adjustments [19,20], but never for FYs and only with sensitivity-based [21] approaches. It is important to consider FYs in DA with PIE data because the FPs are highly sensitive to FYs and FYs can have large uncertainties.
The DA framework was implemented around GEF and tested on CASMO-5M [22] simulations of the LWR-Phase II (LWR-PII) experimental campaign of Proteus [23,24]. The experiment, and simulations of it, was used to do DA for GEF’s model parameters. These adjusted model parameters were re-used in GEF to create adjusted FYs and covariance data. Finally, the adjusted FYs were used again in the CASMO-5M simulations to evaluate their effect on the predicted FP concentrations. Importantly, these adjusted FYs and FPs should be considered as a calibration of the entire simulation chain, not of the fundamental values of the FYs.
We applied two DA methods: MOCABA (Monte Carlo Bayesian Analysis) [25] and BFMC (Backward Forward Monte Carlo) [26]. Approaches based on first-order perturbation theory [27,28] were not used because they would have required extensive code development to calculate sensitivity coefficients to FYs. Additionally, burnup simulations have non-linear behavior and could invalidate the linearity assumption for large FY uncertainties. The FYs produced by GEF can be non-Gaussian and they propagate through burnup calculations and create non-Gaussian distributions in FP concentrations, as seen in Figure 1. However with non-Gaussian integral parameters, MOCABA may give biased posteriors due to its Gaussian assumption. In this study, we apply both methods to assess the effect of this non-Gaussianity. MOCABA and BFMC are similar to methods applied previously for differential nuclear data, which were called UMC-G and UMC-B respectively, in references [29,30], with MOCABA also having parallels to FBET [31,32].
The PIE data had a large degree of inconsistency between the experiment and simulation; the bias was not well explained by the experimental uncertainties and the FY uncertainties. The inconsistency is important to consider in the DA. Applying MOCABA to inconsistent integral data sets can create unphysical adjustments. Additionally, BFMC may produce a small to possibly negligible adjustment when there is a large inconsistency and then DA would not be as effective [33]. We used the Marginal Likelihood Optimization technique (MLO) [34,35] to compensate for the inconsistency. This point makes this work interesting to study the effect of MLO: it helps to constrain the MOCABA adjustments and allows for BFMC to adjust to a larger extent as well.
In the following text, we present the adjustments of the GEF model parameters made with MOCABA and BFMC, the LWR-PII PIE data, and CASMO-5M models. First, Section 3 discusses the DA theory and the MLO method. Next, Section 4.1 details the LWR-PII PIE data and the calculation scheme for DA. The results of the DA are presented inSection 5. The posterior FYs, FY correlations, and PIE data are all investigated. The prior and posterior GEF FYs are also compared to those given in JEFF3.3 [36]. The posterior FYs were re-used in the CASMO-5M simulations, both with the PIE data that were used to adjust the model parameters and with PIE data that were not part of the adjustment. We focused on the differences between the MOCABA and BFMC adjustments as well as on the effect of applying MLO.
 |
Fig. 1 Histogram of the prior calculated Gd-160 concentration in a LWR-Proteus Phase II fuel sample. |
2 GEF
GEF (GEneral description of Fission observables) [12,13] is a semi-empirical model designed to give a complete description of the fission process. It describes the excited compound nucleus formation and all intermediate processes until the formation of two separate nuclei at scission. The developers of GEF highlight that it is not intended to compete with microscopic models. Instead, GEF is tailored to get the best performance in nuclear technology. Empirical information is leveraged to globally describe fission quantities. Very detailed descriptions of the inner-workings GEF’s coding are available in references [12,13]. Here, we summarize the details that are most important for this work and rely on abstractions of key features of the code. This inherently leaves some holes in the description, but must be done for the conciseness of this document.
GEF uses a Monte-Carlo approach to generate, event-by-event, the data for fission observables. An event starts with the model parameters and the user’s input (e.g. the properties of the excited nucleus). Then GEF calculates the competing decays of the system, where the competition is between fission and neutron/photon/proton emission. If fission is initiated, the fission fragment properties at scission are calculated. Then the de-excitation of the fragments is calculated until they reach their ground or isomeric state. For radioactive FPs, GEF computes β− decay and will calculate cumulative FYs.
A great advantage and innovation of GEF is its ability to generate covariances between fission observables, which were traditionally not available. To do so, GEF samples some of its model’s parameters, which were decided by the code developers to be the most important. For each model parameter sample set, the core of the code system that was described previously is run to create a sample of FYs. From the population of FYs, a covariance matrix is constructed. GEF assumes that the parameters are normally distributed and independent. The independence assumption is based on the fact that an additional correlation is introduced when the whole FY distribution is normalized [37]. Because GEF was constructed to include sampling, it can be seamlessly integrated into MOCABA and BFMC.
The model parameters that are sampled in GEF and their means and standard deviations are shown in Table 1. These values are unique to the GEF2017/1.1 version of the code [38]. They are changed with different distributions of GEF as it is modified and improved. Importantly, these are not the only model parameters in GEF. There are over 100 parameters, including things like the curvature of the macroscopic potential energy. Those in Table 1 were deemed most important by the developers for the production of covariance data.
GEF has the ability programmed into it to sample its model parameters and estimate covariances between FYs. Unfortunately, this option does not preserve FYs of each random sample, it only returns the mean FYs and their covariances. In other words,GEF does not automatically output the distribution of the FYs, only their first two moments. The distribution is interesting for this study because it is non-Gaussian. To gain access to the distribution, the GEF code was modified so that it would give the FYs for each sample. This is an important component of this study and is emphasized again: the FYs for CASMO-5 were not sampled from covariance matrices, rather they were generated directly from sampling of the GEF model parameters. Therefore, the covariance matrices were not used at any point in the assimilation; they were another output of GEF that was adjusted.
3 Data assimilation theory
DA incorporates experimental evidence, in a Bayesian way, to combat the bias and uncertainty of a simulated integral parameters [33]. The bias and uncertainty are assumed to be caused by the nuclear data’s epistemic uncertainties, which propagate through a code to the calculated integral parameter [39]. DA adjusts the nuclear data, and thereby reduces the bias and uncertainty of the simulations, in a way that reflects the additional knowledge of the integral experiments.
In our framework, we adjust the model parameters in GEF with DA. GEF assumes a priori that the model parameters, σ, follow the probability density function shown in equation (1). p(σ) has mean values given by the vector σ0 whose size isNσ × 1 and where Nσ is the number of model parameters. The distribution is described by the covariance matrix Mσ whose size is Nσ × Nσ. In GEF, the σ are assumed to be independent, i.e. Mσ is a diagonal matrix, and to have a Gaussian distribution.
![Mathematical equation: \begin{equation*}p(\bm{\sigma}) \propto \text{exp}\big[-\frac{1}{2}(\bm{\sigma}-\bm{\sigma}_0 )^T \mathbf{M_{\sigma}}^{-1} (\bm{\sigma}-\bm{\sigma}_0 ) \big]. \end{equation*}](/articles/epjn/full_html/2020/01/epjn200010/epjn200010-eq1.png) (1)
(1)
The experimental PIE data, E, are used in a likelihood function,  , that reflects the likelihood to measure a specific E given model parameters σ. The performance is the agreement between the PIE data that are calculated with the FYs and the experimental PIE data. E is a vector with size NE × 1, where NE is the number of experimental data. It has the covariance matrix ME whose dimensions are NE × NE.
With this prior and the likelihood, the posterior model parameters’ distribution, p(σ′ |E), is given by equation (2). The DA methods used in this study estimate the maximum a posteriori distribution with two different approaches, which are outlined in the subsequent sections.
 (2)
(2)
3.1 Monte Carlo Bayesian Analysis (MOCABA)
The MOCABA DA method finds the maximum a posteriori distribution by assuming that the prior and likelihood are multivariate Gaussian PDFs. This creates a conjugate prior and allows for an analytical solution of equation (2). While reference [25] states that an invertible variable transformation could be used to handle non-Gaussian PDFs, this technique was not pursued and the standard methodology of MOCABA most commonly encountered in the literature was used. Equation (3) gives  as a multivariate Gaussian distribution.In the following, C(σ0) is the function that relates the input space (GEF’s model parameters) to the output space (the PIE data). For this application, C (σ0) is the GEF code that creates the FYs and the neutron transport code that takes the FYs to calculate the FP concentrations. C (σ0) is a vector whose size is a NE × 1. It is also assumed to follow a multivariate Gaussian distribution with MC being its covariance matrix whose size is NE × NE.
![Mathematical equation: \begin{equation*}\mathcal{L}(\mathbf{E}|\bm{\sigma}) \propto \text{exp}\bigg[-\frac{1}{2}\big( \mathbf{E} - \mathbf{C}({\sigma}_0)\big)^T \mathbf{M_{E}}^{-1} \big(\mathbf{E} - \mathbf{C}({\sigma}_0) \big)\bigg]. \end{equation*}](/articles/epjn/full_html/2020/01/epjn200010/epjn200010-eq5.png) (3)
(3)
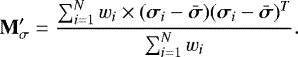
To find the moments of the posterior distribution, one must maximize p(σ′ |E), which is equivalent to minimizing its negative logarithm [40]. The posterior mean of the model parameters, σ′, is equation (4) and its covariance matrix,  , is equation (5). Here, Mσ,C is the covariance matrix of σ and C whose dimensions are Nσ × NE. Equations (4) and (5) have a symmetry with those used in a generalize linear least squares (GLLS) approach to the data assimilation [40,41]. In the case of GLLS, the terms MC and Mσ,C are estimated with first-order perturbation theory.
![Mathematical equation: \begin{equation*}\bm{\sigma}' = \bm{\sigma}_0 + \mathbf{M_{\sigma, C}} \big[\mathbf{M_{C}} + \mathbf{M_{E}}\big]^{-1} \big[\mathbf{E} - \mathbf{C}(\bm{\sigma}_0) \big] \end{equation*}](/articles/epjn/full_html/2020/01/epjn200010/epjn200010-eq7.png) (4)
(4)
![Mathematical equation: \begin{equation*}\mathbf{M_{\sigma}'} = \mathbf{M_{\sigma}} - \mathbf{M_{\sigma, C}} \big[\mathbf{M_{C}} + \mathbf{M_{E}}\big]^{-1} \mathbf{M_{\sigma, C}}^T. \end{equation*}](/articles/epjn/full_html/2020/01/epjn200010/epjn200010-eq8.png) (5)
(5)
MC and Mσ,C in equations (4) and (5) are then estimated with the Monte Carlo method. First, the model parameters are randomly sampled from their PDF. For every random sample, σi, a simulation is done with it to create a calculated value C(σi), or Ci. With N samples of σ, Ci is evaluated N times to create a population of calculated values: {C1, C2, …, CN }. This population set is then used to estimate MC and Mσ,C with equations (6) and (7), where  and
and  are the population means of C and σ.
 (6)
(6)
 (7)
(7)
3.2 Backward Forward Monte Carlo (BFMC)
BFMC draws samples from the prior and weighs these samples by the likelihood to compute σ′ and  . With BFMC, one can assign any prior distribution and then analytically evaluate the likelihood [42,43]. This is the primary advantage of BFMC in comparison to MOCABA in this application: it can account for the non-Gaussianity seen in Figure 1. When using BFMC, a random sample σi is first drawn from p(σ). It is then used in C (σ) to get the random sample Ci. The agreement between Ci and E is quantified with the cost function equation (8). Here,
  is the squared distance between Ci and E normalized by ME.
 (8)
(8)
Each  is used to calculate a weight, wi, for that sample with equation (9). Smaller
  values indicate better agreement between E and Ci and create larger weights. Samples with higher wi contribute more to adjustments of σ, whereas those with smaller wi contribute less. Note that equation (9) used by BFMC is identical to equation (3) by MOCABA, i.e. both assume a multivariate normal likelihood.
 (9)
(9)
The weights are then used to calculate weighted averages that are the posterior means and covariances for σ: equations (10) and (11) for σ′ and  .
.
 (10)
(10)
 (11)
(11)
When the  are large, weight degeneracy can occur when applying BFMC. The majority of the weights are zero or near zero-valued and only a few samples contribute to the posterior. For the PIE data of this study that have very large biases, we found this to occur. Their χ2 calculated with σ0 was 1250. To counteract weight degeneracy, we used the weight definition of equation (12). Each
  is normalized with the minimum χ2,
  , of the sample set. A similar normalization was shown in reference [43] to improve the weight distribution and the convergence rate of the posteriors and was reported to account for model inaccuracies in DA. Different normalizations have been used in several other studies. Reference [26] has
  and reference [42] has
  . We did not examine the difference between these variations in this study, but this would be an interesting avenue for future work. MLO, presented in the following section, can also be considered as an approach to counteract weight degeneracy.
 (12)
(12)
3.3 Marginal likelihood optimization
Certain, but not all, techniques account for inconsistency by simply removing inconsistent integral parameters from the DA [27,44]. They would have removed up to 75% of the PIE data in this study, which is a waste of resources because significant time was spent inanalyzing, modeling, and simulating the experiments. It is preferable to keep these data and to address the inconsistency in a continuous and statistically rigorous way.
We used the Marginal Likelihood Optimization (MLO) approach to address inconsistent integral data [34,35,45,46]. MLO is an empirical Bayesian procedure that re-scales the uncertainty of an integral parameter so that it is then consistent. MLO’s principle is that there are numerous causes of inconsistency between C and E. It may be caused by an underestimation of nuclear data uncertainties, unaccounted for experimental uncertainty or covariance, errors in neutronics modeling, etc. These unknown sources of bias are accounted for with extra uncertainty that makes C and E consistent. The added uncertainty decreases the χ2, or improves the consistency. Each extra uncertainty of all the integral parameters becomes a covariance matrix, Mextra, for DA. In this study, Mextra is a diagonal matrix with no covariance terms whose size in NE ×NE. Reference [34] discusses how a fully correlated error term can be added if desired. In this work, we assume that Mextra is diagonal and, therefore, only extra variance terms are estimated.
To estimate the extra uncertainty requires redefining χ2 as equation (13) and calculating marginal the likelihood function, p(E), of equation (14). Here,  is found with equation (6). Then equation (14) is maximized, or its negative logarithm is minimized, with the diagonal variance terms of Mextra being tunable hyperparameters. We perform the minimization with gradient descent, with the boundary condition being that the added uncertainties cannot be negative.
 (13)
(13)
 (14)
(14)
4 Methods and approach
4.1 LWR proteus phase II: PIE data
The PIE data that are the integral parameters in this study come from the LWR Proteus Phase II (LWR-PII) experimental campaign [23,24]. The integral data were concentrations of FPs in spent fuel normalized to the total mass of uranium (all isotopes) in the fuel. Thirty-three FP concentrations of a variety of elements with varying mass numbers (A) were used in the adjustment.
The training data in the DA were the FP concentrations of a UO2 sample, U1, with a burnup of ~38 MWd/kg. The posterior GEF FYs were used again in simulations of U1 to verify if there was improvement in its predicted FP concentrations relative to the prior. We tested the posterior FYs with simulations of two other fuel samples: U2 and M1. This quantified the performance of the posterior FYs for systems that were not part of the training data, i.e. it tested if the posterior FYs were over-fit to U1. U2 assessed how the posterior FYs performed on another UO2 fuel with a higher burnup (~58 MWd/kg). M1 tested how the posterior FYs extrapolated to MOX fuel (~21 MWd/kg) rather than UO2.
Through examination of the original experimental data from 2000 to 2004, we reconstructed the covariances between the measured FP concentrations that were not available in the official documentation. The measurements involved dissolving the fuel samples in HNO3 and the residue from this dissolution in a HCl/HNO3 mixture. The solutions were then used with a combination of high-performance liquid chromatography (HPLC) and a multicollector inductively coupled plasma mass spectrometer (MC-ICP-MS) to measure the nuclide concentrations. HPLC was used to separate chemical elements, and then mass spectrometry (MS) was used to measure the isotopic concentrations. Certain isotopes that were present in very small concentrations were measured with γ-ray spectrometry.
The MS was calibrated with isotope dilution analyses (IDA). The fuel sample had an unknown amount of element with a measurable isotopic composition. A reference sample (a so-called “spike”) with a certified element mass and known isotopic composition was added. Because these two samples were mixed, the isotopic composition of that element was changed. The new ratios of isotopes were measured in the mixture. Next, by knowing the isotope concentrations in the fuel sample, the spike sample (which was certified), and the mixture, and by knowing the mass of the spike sample and the amount of sample and spike mixed together (through weighing), the concentration of the element in the fuel sample can be calculated.
Concerning the uncertainties in this process, there was a random error in the measurements that arises from unpredictable or stochastic variations in quantities. Systematic errors remained constant or varied in a predictable way over the course of a number of analyses. For instance, all isotopes of an element used the same spike. Uncertainty in the spike was then common to all isotopes of an element. The uncertainty of the measured elemental compositions was typically less than 0.1%, but could have been larger for isotopes with low abundance. This uncertainty was calculated as the standard deviation of four repeated measurements of unspiked samples. For the isotopic concentrations, the uncertainties ranged between 0.3% and 1%. The uncertainties came from the statistical errors, the weighing of the fuel and spike solutions, and the uncertainty of the compositions and concentrations of the spike materials. The uncertainty of the γ-spectroscopy measurements was 5–10%.
The final experimental value was the mass of the isotope relative to the total mass of uranium, in units of mg/g. This concentration, ɛ, of isotope i is given in equation (15). wi is the measured weight percent of that isotope,Utot is the mass of uranium per total mass of fuel (mg/g), and ηj is the mass of the element j (measured with IDA) that the given isotope belongs to per total mass of fuel (g/g).
 (15)
(15)
With the sources of uncertainty in the ɛ values defined, they were used in equation (16) to calculate the variances and covariances in the matrix Vout. Equation (16) is the linear error propagation formula with J being the Jacobian matrix of first-order partial derivatives of equation (15) and Vin being the covariance matrix of the w, Utot, and η values. It was assumed that w, Utot, and η were independent. Additionally, the fuel mass common in Utot, and η canceled out in the numerator and denominator. This means that correlations between ɛ values were created only by the common terms Utot and η.
 (16)
(16)
After applying this formulation, the correlation matrix can be found, and is shown in Figure 2 for fuel sample U1. The covariances were then used as ME in the DA equations. All of the measured concentrations have a degree of correlation induced by the total-uranium normalization. The nuclides of an element are also highly correlated by the use of a common, spiked reference sample during liquid chromatography and mass spectrometry.
 |
Fig. 2 Experimental correlations between the fission products in fuel sample U1. The miscellaneous FPs include Ag-109, Rh-103, Ru-101, Tc-99, Mo-95, and Sr-90. |
4.2 Computational approach
CASMO-5M modeled the LWR-PII fuel samples and predicted their FP concentrations after burnup. We used modelsof LWR-PII that are described in detail in reference [24]. CASMO-5M used the ENDF-B/VII.1 nuclear data library for neutron transport [47]. The tool SHARK-X [48,49,50,51] transferred the FY samples to CASMO-5M. GEF2017/1.1 [38] created FY data for the thermal fission (incident neutron energy, En, of 0.0253 eV) of U-235, Pu-239, and Pu-241 and the fast fission (En = 500 keV) of U-238.
GEF’s model parameters were sampled 10,000 times from their PDF. Then GEF was run 10,000 times with these samples to create a sample set of FYs. Each GEF run used 2E5 fission events. Subsequently, 10,000 CASMO-5M simulations of LWR-PII’s FP concentrations were done with these FYs. With this distribution and population set of calculated values, the BFMC and MOCABA methods were applied to update GEF’s model parameters. With the posterior model parameters, GEF was re-run 500 times to produce 500 posterior FY samples, and finally CASMO-5M was re-run 500 times with these posterior FYs.
The DA only considered uncertainties that originated from GEF’s FYs. Certainly, there were other uncertainties: nuclear data uncertainties from cross sections and other fission observables, and technological uncertainties associated with the enrichment, fuel temperature, cladding thickness, and moderator density. It was somewhat arbitrary to only include FY uncertainties as SHARK-X could have accommodated the unaccounted for uncertainties. However, by defining the FYs as the only source of uncertainty, we isolated their effect and can focus solely on them.
Importantly, the CASMO-5M simulations had model inaccuracies. For example, the irradiation history was approximated in a step-wise manner using a nodal core simulator with pin-power reconstruction. Furthermore, the models were in 2D and had reflective boundary conditions. Additionally, they did not account for the exact vertical location of the fuel sample on the fuel rod. Moreover, CASMO-5M used simplified decay chains that did not have all the FYs made by GEF. We had to parse GEF’s FYs and simplify them to be compatible with CASMO-5M, which was another source of model inaccuracy.
Some of these model inaccuracies could have been mitigated with a Monte-Carlo neutron transport code. This would allow a full representation of the geometry and to account for all FYs that GEF outputs. Monte-Carlo neutron transport, of course, would come with the disadvantage of increased computational cost and previous studies of the LWR-PII fuel sampleswith such codes [52] did not show significant improvements in the bias relative to using CASMO-5. Because MOCABA and BFMC require many model runs, Monte-Carlo neutron transport codes were, therefore, not pursued.
The model inaccuracies and missing uncertainties manifest as inconsistent integral data, i.e. biases that are not explained by uncertainties. The inconsistencies, if unaccounted for, can cause non-physically based adjustments to the model parameters. Because there are so many possible sources of bias and missing uncertainty, we used MLO to mitigate their effect on the adjustments.
Our framework to apply BFMC is summarized below,
- 1.
Sample the GEF model parameters.
- 2.
Run GEF with this model-parameter sample set to produce a sample set of FYs.
- 3.
Run the CASMO-5M model of fuel sample U1 with each FY sample to create samples of calculated FP concentrations.
- 4.
Use MLO to account for inconsistencies between the experiment and calculation.
- 5.
Calculate the weights with equation (12) and the sample set of calculated FP concentrations, experimental mean values, and experimental covariance matrix.
- 6.
Use the weights to update the model parameter distributions with equations (10) and (11).
- 7.
Resample the posterior GEF model parameters and re-run GEF to create posterior FYs.
- 8.
Run the CASMO-5M models with the posterior FYs.
When Mextra was calculated with MLO, it was incorporated into  as shown in equation (17). These
  were then used to calculate the weights with equation (12) and finally to update the GEF model parameters.
 (17)
(17)
To apply MOCABA, steps 1-5 are identical to BFMC with the following subsequent steps,
- 6.
Estimate
 and
and  , with equations (6) and (7), from the σi
and Ci.
, with equations (6) and (7), from the σi
and Ci. - 7.
Use
 and
and  to update the GEF model parameter distributions with equations (4) and (5) adding the
Mextra
calculated by MLO to ME.
to update the GEF model parameter distributions with equations (4) and (5) adding the
Mextra
calculated by MLO to ME. - 8.
Resample the posterior GEF model parameters and re-run GEF to create posterior FYs.
- 9.
Run the CASMO-5M models with the posterior FYs.
Both methods, MOCABA and BFMC, update the distribution of model parameters. In order to see the effect of the assimilation on the calculated FP concentrations and to compare MOCABA and BFMC, it was necessary to resample the model parameters with σ′ and  and re-run GEF. This created a sample set of FYs that was then used in CASMO-5M. MOCABA, by its nature, gives a multivariate normal posterior distribution. To test MOCABA then required sampling its posterior model parameters from multivariate normal distributions. Any correlation terms that arose in
  were retained in the sampling. In order to compare with MOCABA, we estimated the posterior mean vector and covariance matrix with equations (10) and (11), respectively, to construct a multivariate normal distribution from which we then resampled.
5 Results
In this section, we present the prior and the posteriors that were calculated with the previously detailed approach. Section 5.1 presents the prior calculated FP concentrations and the results from applying MLO. Section 5.2 compares the MOCABA and BFMC adjustments of the FY data that were produced with the adjusted model parameters. There, the GEF FYs are compared to the FYs of JEFF3.3. The posterior FP concentrations, calculated with the posterior FYs, are also presented. Section 5.3 discusses the effect of using MLO.
5.1 Prior and MLO
First, steps 1–4 from Section 4.2 were done: the prior distribution of calculated FP concentrations was calculated and MLO was applied. The largest bias, or C∕E – 1, of any FP concentration was 64% for Ru-101. The average absolute value of all biases was 26%. The uncertainties created by the FY data were as large as 56% for Gd-160 and averaged at 21%. Importantly, some biases were very inconsistent, like for Rh-103, Ru-101, or Tc-99. We calculated χ2 to measure the consistency of the whole PIE data set. It was defined as equation (18), where MC was calculated with equation (6). The χ2 per degree of freedom (DoF) was 38. This was far from the 1.0 value expected especially given that the standard deviation per DoF ( ) of the χ2 distribution is 0.3.
 (18)
(18)
The χ2 indicated that a large degree of inconsistency existed between C and E. This inconsistency may have been caused by ignoring sources of uncertainty or model inaccuracies in the simulations. As previously discussed, such an inconsistency may induce unrealistic adjustments of the model parameters and FYs in MOCABA. It may also cause a marginal adjustment to occur with BFMC. The MLO method was applied to improve the consistency by adding extra uncertainty to integral parameters. The results from MLO are presented in Figure 3. MLO added extra uncertainties to the isotopes that showed large degrees of inconsistency, e.g. Eu-154, Cs-134, Rh-103, Ru-101, or Tc-99. The χ2, recalculated with Mextra as in equation (13), becomes 0.7 per DoF. This χ2 is within the standard deviation of the χ2 distribution for 33 DoF.
Recall that MOCABA replaces the exact prior distribution of the observables obtained by propagating the parameter prior distribution by a multivariate normal distribution. Any non-normality may bias the adjustments. We applied the Shapiro–Wilks test [53] to quantify how likely it was that the C distributions were drawn from Gaussian PDFs. It gives a p-value that represents the probability to obtain a more extreme value of the test statistic than the actually obtained. The p-value is then compared to a threshold α level. Here, α was chosen to be 0.05, meaning that if the p-value ≤ 0.05, we rejected the null hypothesis. We also evaluated the significance of the tail of each C distribution with the Pearson skewness. For a Gaussian distribution, whose left and right tails are symmetric, the skewness is 0. A positive or negative skewness indicates asymmetry in the distribution. The p-values and skewness of each C are given in Figure 4. Only three FPs pass the Shapiro-Wilks test: Nd-146, Nd-145, and Nd-144. That means that 30 of 33 FPs can be classified as non-Gaussian. The skewness helps to show which FPs are most non-Gaussian, and these are the Gd, Eu, andSm isotopes along with Nd-150 and Sb-125.
 |
Fig. 3 Biases and uncertainties for the FP concentrations of U1 after applying MLO. C values were taken as the mean of the distribution. |
 |
Fig. 4 Skewness and p-values from a Shapiro-Wilks normality test for the prior calculated FP concentrations of fuel sample U1. |
5.2 BFMC vs. MOCABA
This section presents the posterior model parameters, independent FYs, and calculated FP concentrations from BFMC and MOCABA. The FYs were produced by executing GEF with the adjusted model parameters given by BFMC and MOCABA. The posterior FYs are compared to JEFF3.3 data, which do not have associated covariances. Only the FYs of Pu-239 are presented to be concise, although the FYs of U-235, U-238, and Pu-241 were also adjusted along with the covariances between these isotopes.
5.2.1 Model parameter adjustments
Table 2 gives the adjustments of GEF’s 21 model parameters using BFMC and MOCABA. Their standard errors were estimated with 500 bootstrap samples [54] and are shown as 95% confidence-intervals. In the case of BFMC, the posterior distributions can be non-Gaussian. Comparing the mean and standard deviation of a Gaussian (MOCABA) and not-Gaussian (BFMC) can be misleading but we do so to illustrate differences in the posterior FYs and calculated FP concentrations that are presented in later sections. Many of the model parameters were not adjusted in a statistically significant way. Those that did were associated with the shell positions of the fission channels (P_DZ_Mean_S#), the shell curvatures (P_Z_Curv_S#), the rectangular contribution to the S2 channel width (P_A_Width_S2), the shell curvature for the S3 channel (P_Shell_S3), and the charge polarization (POLARadd). Among the fission channels, the S3 channel had its model parameters adjusted to the largest degree. Noticeably, the posterior BFMC model parameters had larger confidence intervals than those from MOCABA, which will be discussed further below. Only the parameter P_A_Width_S2 had statistically significant differences between MOCABA and BFMC.
The DA also produced correlations between the model parameters, which are given in Figure 5, that did not exist in the prior. The 95% confidence intervals from bootstrapping are also given for each correlation coefficient. Figure 5 shows large differences between the MOCABA and BFMC matrices. BFMC shows much larger degrees of inter-correlation than MOCABA. However, the confidence intervals show that the BFMC correlations also have a much larger degree of uncertainty. Many of them cannot be declared to be statistically significant. With MOCABA, some model parameters developed correlations, especially the P_Shell parameters and POLARadd.
Previous studies [33] have shown that the combined effects of weight degeneracy and too low sample size can create large uncertainties in the  calculated with BFMC. The degree of weight degeneracy can be qualified by examining the weight distribution of the sample set. Figure 6 gives the cumulative density function (CDF) of the weights that were calculated with the 10,000 samples and equation (12). The figure shows that many of the weights were, in a practical sense, zero-valued. The CDF, shown in Figure 6, shows that only ~1% of the weights, or 100 out of 10,000 samples, were significantly greater than 0. While this does not display a total weight degeneracy, it caused an insufficiently converged
  with BFMC and thereby explains the large confidence intervals of the correlations it produced. In Section 5.3, we show that BFMC without MLO had more significant weights and its posterior weighted averages were more highly converged. The off-diagonal correlations in
  then diminished.
Prior and posterior means and standard deviations of GEF’s model parameters, shown with 95% confidence intervals that were estimated with bootstrap sampling.
 |
Fig. 5 Correlation matrices of the 21 posterior GEF-model parameters. Each correlation coefficient has its 95%-bootstrap-confidence interval over-laid on it. |
 |
Fig. 6 CDF of BFMC’s weight distribution. |
5.2.2 FYadjustments
Figure 7 compares the prior and posterior independent FYs of Pu-239. It shows the relative difference between the prior and posterior for both the means and the standard deviations. Examining the relative differences of the means, the adjustments from prior to posterior are largest at A = 130–160 and symmetrically at A = 80–110. The areas of large adjustment correspond to regions where PIE data were densest; most of the FP concentrations were isotopes of Nd, Eu, Sm, and Gd, all of which have A > 140. There was strong agreement between the FYs of MOCABA and BFMC for A = 90–150. Disagreements occurred at A < 80 and A > 160, but these are rare yields with poor statistics (100% uncertainty) in the Monte Carlo process of GEF. Given their large uncertainties, we expect larger disagreements in the posteriors. Returning to the yields associated with A = 80–160, in general, MOCABA created larger adjustments than BFMC with peaks at A ≈ 115 and A ≈ 125. These adjustments were significantly affected by the posterior model parameters associated with the S3 channel, as it is dominant for FYs at these A. The shell position for the S3 channel was adjusted by 21% with MOCABA and 15% with BFMC. The shell effect of the S3 channel also saw adjustments of −2% and −1% with MOCABA and BFMC, respectively. Further discussion of the causes of these trends is given below.
The adjusted standard deviations had similar trends. First, the reductions in uncertainty were largest at A = 135–160 and symmetrically at A = 80–105, where there were the most experimental integral data. For both the MOCABA and BFMC posteriors, at the A corresponding to the centers of the different fission channels, there were sharp reductions in the FY uncertainty. In the case of BFMC, the FYs in the region dominated by the S3 and S4 channels, at A ≈ 110–130, increased in uncertainty. Typically for linear and multivariate cases, we expect no change or a decrease in uncertainty after a Bayesian update. However, the GEF model is non-linear and there were significant correlations between BFMC’s posterior model parameters, helping to lead to increased standard deviations of the FYs. Through correlation with P_Shell_S3, this increase led to larger uncertainties in the FYs at 110 < A < 130. The FYs of U-235, U-238, and Pu-241 also showed an increase in uncertainty at this region. Again for very rare yields, at A < 90 and A > 150, there were more disagreements between MOCABA and BFMC and large changes to uncertainties. These adjustments were not reliable due to the limited statistics of GEF for these FYs.
Figure 8 presents the prior and posterior correlation matrices for the independent FYs of thermal fission in Pu-239. Theprior correlation matrix has large positive correlations (red) between FP pairs. It also has strong correlations slightly off the main diagonal that come from FPs that are dominated by the same fission channel and are consequently highly correlated to the same model parameters. The within-channel correlations are also seen between the light and heavy humps of the FY spectrum. The matrix also has large degrees of anti-correlation (blue) between fission channels. For example, the FYs between the S2 and S1, and between the S1 and S4 channels show anti-correlation. By incorporating experimental data, BFMC and MOCABA both reduced the degree of correlation between the FY data. In large part, the trends in the correlations in the prior were retained, only the extent of correlation and anti-correlation were affected. Compared to BFMC, MOCABA more significantly reduced correlations, particularly the anti-correlation terms induced by the S1 and S4, and the S3 and S4 fission channels.
Figure 9 provides the prior and posterior correlations between FYs of thermal fission in U-235 and Pu-239.As GEF was run with the same sets of model parameters to produce each nuclide’s FYs, their data became correlated through the common inputs. Similar to the previously outlined behavior, large degrees of positive correlation appeared between the FYs of the two nuclides due to influences of the same fission channels. Similarly, competing fission channels created anti-correlations. From prior to posterior, the trends are similar: decreased degrees of correlation and anti-correlation, with MOCABA decreasing the correlation to a larger extent than BFMC.
Figure 10 compares the GEF FYs with those given in JEFF3.3. The relative differences are plotted for the FY means and for the standard deviations. In general, we observed relative differences of the mean values at −40 to +40%. The biggest improved agreement occurred at 85 < A < 95 and 135 < A < 150. These improvements can be connected to where the experimental data were concentrated. Approximately 70% of the integral data had A > 135. With a large concentration of evidence in this area, the adjustments were the most significant there. GEF’s prior uncertainties tended to be larger compared to JEFF3.3. Similar to the means, the reductions in uncertainty were largest at 85 < A < 95 and 135 < A < 150, where the PIE data were densest. MOCABA produced smaller uncertainties than BFMC that were closer to those from JEFF3.3.
Table 3 gives the comparison shown in Figure 10 summarized over the whole independent FY data set for thermal fission of Pu-239, U-235, and Pu-241 and fast fission of U-238. In JEFF3.3 are given for a neutron energy of 400 keV, while GEF was run for a neutron energy of 500 keV. For the relative difference of the mean FYs, the mean of the absolute value of the relative differences was taken. In the case of Pu-239 and Pu-241, there was improved agreement between the GEF FYs and JEFF3.3. For the means, there were not significant differences between the MOCABA and BFMC posteriors. MOCABA made larger uncertainty reductions than BFMC. For Pu-241,the GEF posteriors with MOCABA had smaller uncertainties than JEFF3.3, i.e. negative average relative differences in the standard deviations. The agreement of GEF with JEFF3.3 deteriorated for U-235 and U-238, although both did still have their uncertainty reduced.
Noticeably, GEF produced 160% larger uncertainties for U-235, relative to JEFF3.3. This is due to GEF’s design and to the quality and abundance of U-235 experimental FYs. GEF was designed to be as general as possible: one model and one set of model parameters predicts with good accuracy the fission observables of isotopes like U-235, or less commonly encountered isotopes likeBk-230 or Fm-256. For this generality, GEF sacrifices some accuracy for an isotope like U-235, which is very well characterized by experimental data. The JEFF3.3 FYs, which profit from this large quantity of high quality U-235 experiments, have smallerreported uncertainties.
The degraded agreement of the FYs of U-235 has not yet been completely explained by the authors. In part, it may be due to the fact that when the GEF model parameters were first set by the developers, i.e. the assessment of the prior model parameters, they used a large amount of high quality U-235 data. When we incorporated the PIE data, we lost some calibration to U-235 in order to improve the FY data of Pu-239, Pu-241, and U-238. Alternatively, the degradation may simply be a statistical effect. All of the FY data, on average, saw an improved agreement between GEF and the nuclear data libraries. While this is the case on average, particular data may have worsened. Given that, for U-235, the relative difference of JEFF3.3 from GEF increased only by +4% and +2% with MOCABA and BFMC, respectively, these data could be the statistically unlucky ones that worsened. Given the complexity of the data set, it has not yet been possible to make a definitive conclusion about the U-235 FYs. Future studies with different fuel samples, possibly with lower burnups to emphasize U-235 fission, would provide clarification.
 |
Fig. 7 Relative differences in the means and relative standard deviations of Pu-239 independent FYs. |
 |
Fig. 8 Correlations between independent FYs of Pu-239. |
 |
Fig. 9 Correlations between the independent FYs of U-235 and Pu-239. |
 |
Fig. 10 Relative differences between GEF and JEFF3.3 of the means and standard deviations of Pu-239 independent FYs. |
Comparing GEF independent FYs (prior & posterior) to JEFF3.3.
5.2.3 Posterior FP concentrations
We begin with how the posterior FYs performed in the CASMO-5M simulations of fuel sample U1, which was the training data used to adjust the GEF model parameters. The prior and posterior biases of the FP concentrations are presented in Figure 11. The average absolute value of the prior bias was 26% and the average uncertainty of the calculated FP concentrations was 21%. With BFMC FYs, the average absolute value of the bias was 15% and the uncertainty of the posterior calculated values was 14%. For MOCABA, the average absolute value of the bias was 14% and the average standard deviation of the posterior FP concentrations was 14%.
Next, we examine how the adjusted FYs performed to estimate FP concentrations that were not part of the training data, i.e. FPs concentrations from different fuel samples. These fuel samples are UO2 (U2) and MOX M1, whose burnups are ~58 and ~22 MWd/kg, respectively. This tests for over-fitting of the model parameters to fuel sample U1. If they were indeed overfit, the posterior biases would be worse than the prior. The biases and uncertainties are summarized in Table 4. Here, the absolute value of the biases and the relative standard deviations of the calculated values were averaged across all data. For all fuel samples, thebias improved from prior to posterior. Additionally, the MOCABA posterior FYs improved the bias to a larger extent than the BFMC FYs. Similarly, all three fuel samples had the uncertainty associated with their calculated values reduced from prior to posterior. MOCABA reduced the relative standard deviation to a larger extent than BFMC. From these results, we can conclude that the adjustment was not over-fit because there was a similar performance for U2 and M1. For all three fuel samples, the average posterior standard deviations were smaller than the NEA-defined target accuracy of 20%, although certain isotopes like Gd-160 still exceeded this value.
 |
Fig. 11 Prior and posterior biases of the FP concentrations of fuel sample U1. |
Average absolute value of the bias and average relative standard deviation of posterior calculated nuclide concentrations. The C values used in the bias estimation were calculated as the mean of the possibly non-Gaussian distribution.
5.3 Effect of MLO
In this section, we present the adjusted model parameters, posterior FYs, and posterior calculated FP concentrations when they were calculated without MLO extra uncertainties, using both BFMC and MOCABA. These results are compared to those from the previous section where MLO was used. The posteriors are compared to assess the effect that MLO had on the adjustments and to investigate the importance of accounting for the inconsistencies of integral data.
5.3.1 Posterior model parameters
Table 5 gives the posterior model parameters when BFMC and MOCABA were used without applying MLO. The table shows some clear differences from Table 2 that are statistically significant in terms of the bootstrap-estimated 95% confidence intervals. With BFMC, only for the parameters P_DZ_Mean_S1 and POLARadd can these differences, both for the means and standard deviations, be considered statistically significant within the 95% confidence intervals. In contrast, MOCABA displayed significant differences between the means and standard deviations of many model parameters. When MLO was not used, they tended to be smaller than when MLO was used, for instance for P_DZ_Mean_S1, P_DZ_Mean_S2, P_A_Width_S2, P_Shell_S3, and POLARadd. That shows how MLO constrained the model parameters’ uncertainty reductions in the presence of inconsistent PIE data.
Figure 12 gives the posterior correlation matrices of the model parameters when MOCABA and BFMC were applied without using MLO. These matrices should be compared to those previously presented in Figure 5. For MOCABA, there were not large differences between the correlations when MLO was and was not applied. The BFMC model-parameter correlation matrices did show large differences: the large degrees of correlation and anti-correlation seen in Figure 5 are not present in Figure 12. The bootstrap-estimated 95%-confidence intervals were also smaller when MLO was not applied. Still, BFMC’s confidence intervals were larger than MOCABA’s, indicating a less converged result.
This difference between BFMC’s posterior correlations with and without MLO requires examining the weight distributions of the two data sets. Figure 13 gives the CDFs of the weight distributions for the two BFMC executions. Where previously only ~1% of the weights from BFMC with MLO were significantly greater than 0, when MLO was not applied ~10% of the weights were significantly greater than 0. The different weight distributions are linked to how Mextra affected BFMC. MLO added extra uncertainties that made all  smaller. With 10,000 random samples, the population mean of
  per DoF calculated without MLO, or with equation (8), was 1.1E5. With MLO, or using equation (17), it was 4.8E3.
First, we see why the weight definition of equation (9) did not work for this data set: both with and without MLO, there was no spread of the weights leading to weight degeneracy, i.e. all weights were zero valued. Secondly, we observed that MLO lowered the  values and subsequently decreased the spread of the weights, which then led to a greater degree of weight degeneracy (as evidenced by the CDFs). Simply put, BFMC’s weight definition, where each
  is normalized by
  , changed the weight distribution.The minimum χ2 per DoF without MLO, or with equation (8), was 2.6E3. With MLO, or Equation (17), it was 1.4E1. Without using MLO,
  was bigger and, therefore, the normalization term was bigger. This shifted all the weights in the distributions to bigger values when
  was then multiplied by -1 and put in an exponential. By consequence, more weights had higher values, leading to a more highly converged posterior weighted average. It is important to mention that weight degeneracy and lack of convergence are first and foremost features of the sampling procedure and not of the underlying statistical model or of whether the physics model is deficient or not.
Prior and posterior means and standard deviations of GEF’s model parameters without using MLO. 95% confidence intervals are shown that were estimated with bootstrap sampling.
 |
Fig. 12 Correlations between the model parameters when MLO is not used. Each correlation coefficient has its 95%-bootstrap-confidence interval over-laid on it. |
 |
Fig. 13 CDFs of BFMC’s weight distributions when MLO was and was not applied. |
5.3.2 Posterior FYs
Figure 14 examines the relative differences between the prior and posterior mean FYs of Pu-239 when MLO was and was not applied. The added MLO uncertainty is shown in red on the figures. The size of the red dots is proportional to the skewness of the calculated FP concentration corresponding to that mass number. First consider the BFMC FYs where are two regions where the posterior with and without MLO disagreed significantly: at 150 < A < 160 (and this region’s opposite side of FY distribution at 80 < A < 90), and at 100 < A < 140. The majority of the experimental data was for A between 140 and 160, i.e. the isotopes of Gd, Eu, Sm, and Nd. When MLO was applied, many of these data had large increases in uncertainty, up to standard deviations of 20%. With increased uncertainty, they influenced less the adjustment. This is evidenced by the relative differences in Figure 14 at 150 < A < 160 being smaller (in an absolute sense) when MLO was used.
MOCABA’s FYs had much larger disagreements when they were calculated with and without MLO. The disagreements are particularly large at A = 80–90, 110–130, and 150–160. In these regions, the adjustments where MLO was not applied were much larger. As most of the FY data were affected, this result should be traceable to the model parameters in GEF. The posterior model parameters were quite different when MOCABA was used with and without applying MLO. These differences were particularly prominent for P_DZ_Mean_S1, P_A_Width_S2, HOMPOL, and POLARadd.
The same plots can be repeated for the relative difference between the standard deviations of the prior and posterior GEF FYs, as shown in Figure 14. Beginning with BFMC, the posterior standard deviations tended to be smaller when MLO was applied. When χ2 is larger, BFMC gives posterior uncertainties closer to the prior. When MLO lowered χ2, it allowed for larger reductions in uncertainty. BFMC showed previously an increase in uncertainty at 110 < A < 130 when MLO was used. This increase was hypothesized to be caused by increases in the uncertainty of P_Shell_S4 and by large positive correlations between P_Shell_S3 and other parameters. When MLO was applied, there was no increase in the standard deviation of P_Shell_S4, where previously it increased from a prior of 0.05 MeV to a posterior of 0.070 MeV. Additionally, the posterior correlation matrices given in Figure 12 showed that the correlations were weaker when MLO was not used, due tobetter convergence, which led to the decreased uncertainty. Again, the reduction in uncertainty was largest in the densest areas of PIE data.
Oppositely to BFMC, applying MOCABA with MLO helped to produce smaller standard deviations, relative to the prior, than not applying it. At A > 150 and between 115 and 120, there was an increase in uncertainty. In general, these results demonstrate the effect that increasing and decreasing the importance of experimental data points, through adding uncertainties with MLO, can have on the posterior FYs. Interestingly, we did not link these increases in uncertainty to any changes in the standard deviations of the model parameters. We hypothesize that it was caused by doing the Bayesian inference stage and uncertainty propagation with two different models: a multivariate normal distribution and the exact physics model (GEF), respectively. Because we constructed the prior as a covariance matrix of a sample of model calculations, used this matrix to update the parameters, and finally sampled from the obtained posterior parameter covariance matrix to obtain the posterior uncertainties for the FYs, non-linearities could have produced larger posterior than prior uncertainties.
MOCABA was effected to a larger extent than BFMC by the application of MLO. This is linked to two characteristics of the data set: the large degree of inconsistency and the skewness of the FP concentrations. MOCABA will adjust σ no matter the degree of consistency of the integral data. Large inconsistencies (i.e. large χ2) cause large adjustments of σ to fit C and E, even if the differences between the two are not caused by input uncertainty but by the model inaccuracies. When MLO was not applied, MOCABA created large adjustments of the GEF parameters that were not based on physics, in effect over-fitting the model parameters to E. Meanwhile BFMC, in contrast, has an auto-correction mechanism through the normalization by the minimum χ2 where large inconsistencies dampen the size of the adjustment. Because of this, MLO had less of an effect on BFMC because, in a sense, the inconsistency was twice by MLO and by the χ2 normalization.
Concurrently, there was the effect of the skewness on MOCABA’s Gaussian assumption where, for non-Gaussian C, MOCABA is a biased estimate of the posterior distribution and the bias of the posterior parameter expectations was additionally increased. When MLO was applied, it added uncertainties to many of data with large skewness, like Gd-160, and changed the importance of these data in the adjustment. By decreasing the importance of these data with large skewness, MLO limited the bias that MOCABA’s Gaussian assumption introduced. Meanwhile, BFMC can account for the non-Gaussianity and the altered importance of the highly skewed data did not matter.
With this data set, it is hard to separate the overlapping effects of the inconsistency and non-Gaussianity. Both should affect MOCABA, but to an unknown degree. Future studies should be constructed that can separate the two effects. A highly inconsistent and Gaussian data set would determine if it was MLO that caused the observed behavior. Another data set that is non-Gaussian but consistent would determine if it was the skewness that caused the observed behavior.
 |
Fig. 14 The left y-scale shows Relative differences between the prior and posterior means and the relative standard deviations (relative to their perspective means) FYs of Pu-239 calculated when MLO was and was not used. The right y-scale (in red) shows the added relative standard deviation to the PIE data by MLO, with the size of red dot being proportionalto the skewness of the calculated value’s PDF. |
5.3.3 Posterior FP concentrations
The FYs from when MLO was not applied were also used in CASMO-5M. Figure 15 compares their posterior biases and uncertainties. Section 5.3.2 showed few significant differences between the BFMC posterior FYs when MLO was or was not applied. The only significant differences were around A ≈ 115 and A ≈ 125, and at A > 150, which are reflected in the posterior biases. Two isotopes are determined by FYs at A ≈ 115 and A ≈ 125: Sb-125 and Ag-109. When MLO was applied with BFMC, the biases improved from 24% to 7.3% for Sb-125, and from 36% to 30% for Ag-109. In contrast without applying MLO, the biases worsened to 34% and 50% for Sb-125 and Ag-109, respectively. Figure 15 demonstrates that MLO also helped to create smaller biases for the Gd and Eu isotopes. This result is also shown in the posterior FYs, where at A > 150 they had more significant differences. Section 5.3.2 also showed that there were large differences between the posterior MOCABA FY data when MLO was and was not applied. These differences are reflected Figure 15 as well. The posterior biases of Sm, Nd, and Cs isotopes were particularly affected by these differences in FYs.
In Table 6, the posterior biases and uncertainties are summarized for all FP concentrations, and for the fuel samples U1, U2, and M1. Again, the CASMO-5M models of U2 and M1 were re-run with the posterior FYs to test the performance and degree of over-fitting of the posteriors. The absolute bias of the FP concentrations, averaged across all 33 data, and the relative standard deviation of the calculated values, also averaged, are presented. Beginning with fuel sample U1, we see that posterior biases of BFMC were only slightly effected by applying MLO. When MLO was applied, the posterior bias was 2% smaller. This highlights an advantage of applying MLO with BFMC: it counteracts BFMC’s push back towards the prior with inconsistent data sets, allowing for better improvement in the bias and a larger reduction in the uncertainty. The posterior biases from MOCABA, however, were extremely effected. Without applying MLO, the bias worsened to 56%, while with MLO it improved to 14%.
Fuel samples U2 and M2 also showed similar behavior: small differences between the BFMC average absolute biases, and much larger biases when MOCABA was used without MLO. M1 also had a posterior bias when MOCABA was used without MLO that was larger than the prior. In general, the results reflect what was observed for the FY data: MLO significantly affected the MOCABA adjustments, and marginally improved the BFMC adjustments. Concerning the average relative standard deviation of the posterior calculated values, for every fuel sample and for both BFMC and MOCABA, applying MLO produced smaller uncertainties.
 |
Fig. 15 Posterior biases and uncertainties of the FP concentrations obtained when MLO was and was not applied. |
Analysis of bias and uncertainty of posterior calculated FP concentrations.
6 Conclusions
This study presented a methodology to adjust the parameters of GEF with post-irradiation examination data. The goal was to improve the bias and uncertainty of the calculated concentration of fission products in spent fuel. The integral parameters were nuclide concentrations that were part of the LWR-Proteus Phase II experiment. Two methods were applied to perform DA: MOCABA and BFMC. The posterior model parameters, and subsequently FYs and calculations, showed good agreement between MOCABA and BFMC, despite the non-normality of the calculated responses. The posterior FYs agreed more strongly with the FYs from JEFF3.3 than the prior. The posterior FYs also created lower biases and uncertainties in fission product concentrations. For the training data, the average absolute bias of prior was 26%. The posterior biases with MOCABA and BFMC were 14% and 15%, respectively. The uncertainty of the calculations dropped from 20% for the prior, to 14% with both MOCABA and BFMC. When the posterior FYs were used with fuel samples that were not part of the training data, they also improved the biases and reduced uncertainties. This showed that the fission yields were not over-fit to the training data.
When MLO was not used, the BFMC posteriors exhibited slight differences. MOCABA, in contrast, showed very significant differences. The trends of the adjusted FYs were significantly changed, which had a deleterious effect on the posterior biases of the calculated fission product concentrations. For the training data, the average absolute bias deteriorated from a prior of 26% to a posterior of 56%. This result was a combination of the increased degree of inconsistency of the integral data without using MLO, and from the increased importance of the skewness of the calculated values. These problems did not occur with BFMC because it accounts for the inconsistency with its weight normalization and because it can handle non-normality. Applying MLO did worsen the weight distribution, and therefore the statistical accuracy, of the BFMC posteriors. However, it also helped to create better biases and lower uncertainties.
Future work should focus on expanding the set of experimental data to be used in the adjustment. The strongest adjustments in the FYs were in areas with the highest density of experimental data. The Pu-239 and Pu-241 FYs were predominantly improved, through comparison with JEFF3.3, while U-235 was marginally adjusted. With a different experimental data set, the FYs of U-235 could be more precisely targeted. The SFCOMPO database [55,56] could be used to find more post-irradiation examinationdata. The methods presented in this work could also be used to provide high quality adjustments to the FY data. For this purpose, it would be better to not use PIE data but rather “clean” experiments to avoid adjustments that come from biases that are not made by nuclear data. For example, fission-pulse decay heat experiments could be used, which are for one fissile isotope with no impact from other sources (cross sections, irradiation history, etc).
Author contribution statement
D. Siefman performed the calculations, processed the data, and wrote the manuscript. M. Hursin performed software architecture and maintenance for the SHARK-X tool and reviewed the manuscript. H. Sjostrand and G. Schnabel developed the MLO method and prepared computer software that implemented it. D. Rochman and A. Pautz performed scientific advisory roles.
References
- O. Leray et al., Ann. Nucl. Energy 94, 603 (2016) [CrossRef] [Google Scholar]
- J.S. Martinez et al., Nucl. Data Sheets 118, 480 (2014) [CrossRef] [Google Scholar]
- R. Mills, Nucl. Data Sheets 118, 484 (2014) [CrossRef] [Google Scholar]
- H. Sjöstrand et al., Nucl. Data Sheets 118, 527 (2014) [CrossRef] [Google Scholar]
- H. Ferroukhi et al., Nucl. Data Sheets 118, 498 (2014) [CrossRef] [Google Scholar]
- O. Leray et al., Prog. Nucl. Energy 101, 486 (2017) [CrossRef] [Google Scholar]
- G. Ilas, H. Liljenfeldt, Nucl. Eng. Des. 319, 176 (2017) [CrossRef] [Google Scholar]
- J.J. Herrero et al., EPJ Web Conf. 146, 09028 (2017) [CrossRef] [Google Scholar]
- L. Fiorito et al., Ann. Nucl. Energy 88, 12 (2016) [CrossRef] [Google Scholar]
- M. Pigni et al., Nucl. Data Sheets 123, 231 (2015) [CrossRef] [Google Scholar]
- N. Terranova et al., Ann. Nucl. Energy 109, 469 (2017) [CrossRef] [Google Scholar]
- K.H. Schmidt et al., Nucl. Data Sheets 131, 107 (2016) [CrossRef] [Google Scholar]
- K.H. Schmidt, B. Jurado, C. Amouroux, Nuclear Energy Agency Data Bank NEA/DB/DOC(2014)1 (2014) [Google Scholar]
- C. Schmitt et al., Phys. Rev. C 98, 044605 (2018) [CrossRef] [Google Scholar]
- K.H. Schmidt, B. Jurado, Rep. Progr. Phys. 81, 106301 (2018) [CrossRef] [Google Scholar]
- J.C. Wagner, Sandia National Laboratory TWP-EBS-MD-000019, Rev. 01 (2007) [Google Scholar]
- D. Siefman et al., EPJ Plus 130, 429 (2018) [Google Scholar]
- D. Rochman et al., Ann. Nucl. Energy 95, 125 (2016) [CrossRef] [Google Scholar]
- T. Frosio et al., EPJ Nucl. Sci. Technol. 4, 19 (2018) [Google Scholar]
- A. Rizzo et al., EPJ Nucl. Sci. Technol. 4, 47 (2018) [CrossRef] [EDP Sciences] [Google Scholar]
- G. Palmiotti et al., Nucl. Data Sheets 123, 41 (2015) [CrossRef] [Google Scholar]
- J. Rhodes et al., Studsvik Scandpower, Inc SSP-07/431 (2012) [Google Scholar]
- M. Murphy et al., Ann. Nucl. Energy 33, 760 (2006) [CrossRef] [Google Scholar]
- P. Grimm, et al., Prog. Nucl. Energy 101, 280 (2017) [CrossRef] [Google Scholar]
- A. Hoefer et al., Ann. Nucl. Energy 77, 514 (2015) [CrossRef] [Google Scholar]
- E. Bauge, S. Hilaire, P. Dossantos-Uzarralde, Proceedings of ND2007 (2007) [Google Scholar]
- M. Salvatores et al., Nucl. Data Sheets 118, 38 (2014) [CrossRef] [Google Scholar]
- D. Siefman, et al., Ann. Nucl. Energy 135, 106951 (2020) [CrossRef] [Google Scholar]
- R. Capote et al., J. ASTM Int. 9, 1 (2012) [Google Scholar]
- G. Schnabel, PhD thesis, Vienna University of Technology, Vienna (2015) [Google Scholar]
- H. Leeb, D. Neudecker, T. Srdinko, Nucl. Data Sheets 109, 2762 (2008) [CrossRef] [Google Scholar]
- D. Neudecker, R. Capote, H. Leeb, Nucl. Instrum. Methods Phys. Res. Sect. A 723, 163 (2013) [Google Scholar]
- D. Siefman, PhD thesis, École Polytechnique Fédérale de Lausanne, Switzerland (2019) [Google Scholar]
- H. Sjöstrand et al., Proceedings of WONDER2018 (2018) [Google Scholar]
- B. Carlin, T. Louis, Bayes and Empirical Bayes Methods for Data Analysis, 2nd edn. (Chapman & Hall/CRC, 2000) [CrossRef] [Google Scholar]
- A.J.M. Plompen et al., Eur. Phys. J. A 56, 181 (2020) [CrossRef] [EDP Sciences] [Google Scholar]
- K. Kern, PhD thesis, Karlsruhe Institute of Technology, Germany (2018) [Google Scholar]
- K.H. Schmidt, GEF2017/1.1: General description of fission observables. released September 24, 2017., http://www.khs-erzhausen.de/GEF-2017-1-1.html (accessed: May 30, 2019) [Google Scholar]
- D. Rochman et al., Annals of Nuclear Energy 112, 236 (2018) [CrossRef] [Google Scholar]
- J. Dragt et al., Nucl. Sci. Eng. 62, 117 (1977) [CrossRef] [Google Scholar]
- A. Pazy et al., Nucl. Sci. Eng. 55, 280 (1974) [CrossRef] [Google Scholar]
- E. Alhassan et al., Prog. Nucl. Energy 88, 43 (2016) [CrossRef] [Google Scholar]
- D. Rochman et al., EPJ Plus 133, 537 (2018) [EDP Sciences] [Google Scholar]
- M.L. Williams et al., SCALE: A Comprehensive Modeling and Simulation Suite for Nuclear Safety Analysis and Design,ORNL/TM-2005/39, Version 6.1 (2011) [Google Scholar]
- P. Helgesson, PhD thesis, Uppsala University, Sweden (2018) [Google Scholar]
- G. Schnabel, Proceedings of M&C 2017 (2017) [Google Scholar]
- M. Chadwick et al., Nucl. Data Sheets 112, 2887 (2011) [CrossRef] [Google Scholar]
- W. Wieselquist et al., Science and Technology of Nuclear Installations p. 549793 (2013) [Google Scholar]
- M. Hursin et al., Proceedings of PHYSOR2016 (2016) [Google Scholar]
- A. Aures et al., Ann. Nucl. Energy 101, 262 (2017) [CrossRef] [Google Scholar]
- M. Hursin et al., Proceedings of PHYSOR2018 (2018) [Google Scholar]
- M. Pecchia et al., Ann. Nucl. Energy 97, 153 (2016) [CrossRef] [Google Scholar]
- S. Shapiro, M. Wilk, Biometrika 52, 591 (1965) [CrossRef] [MathSciNet] [Google Scholar]
- B. Efron, R. Tibshirani, Stat. Sci. 1, 54 (1986) [NASA ADS] [CrossRef] [Google Scholar]
- F. Michel-Sendis et al., Ann. Nucl. Energy 110, 779 (2017) [CrossRef] [Google Scholar]
- I. Gauld et al., Nucl. Eng. Technol. 49, 1226 (2017) [CrossRef] [Google Scholar]
Cite this article as: Daniel Siefman, Mathieu Hursin, Henrik Sjostrand, Georg Schnabel, Dimitri Rochman, Andreas Pautz, Data assimilation of post-irradiation examination data for fission yields from GEF, EPJ Nuclear Sci. Technol. 6, 52 (2020)
All Tables
Prior and posterior means and standard deviations of GEF’s model parameters, shown with 95% confidence intervals that were estimated with bootstrap sampling.
Average absolute value of the bias and average relative standard deviation of posterior calculated nuclide concentrations. The C values used in the bias estimation were calculated as the mean of the possibly non-Gaussian distribution.
Prior and posterior means and standard deviations of GEF’s model parameters without using MLO. 95% confidence intervals are shown that were estimated with bootstrap sampling.
All Figures
|
Fig. 1 Histogram of the prior calculated Gd-160 concentration in a LWR-Proteus Phase II fuel sample. |
| In the text | |
|
Fig. 2 Experimental correlations between the fission products in fuel sample U1. The miscellaneous FPs include Ag-109, Rh-103, Ru-101, Tc-99, Mo-95, and Sr-90. |
| In the text | |
|
Fig. 3 Biases and uncertainties for the FP concentrations of U1 after applying MLO. C values were taken as the mean of the distribution. |
| In the text | |
|
Fig. 4 Skewness and p-values from a Shapiro-Wilks normality test for the prior calculated FP concentrations of fuel sample U1. |
| In the text | |
|
Fig. 5 Correlation matrices of the 21 posterior GEF-model parameters. Each correlation coefficient has its 95%-bootstrap-confidence interval over-laid on it. |
| In the text | |
|
Fig. 6 CDF of BFMC’s weight distribution. |
| In the text | |
|
Fig. 7 Relative differences in the means and relative standard deviations of Pu-239 independent FYs. |
| In the text | |
|
Fig. 8 Correlations between independent FYs of Pu-239. |
| In the text | |
|
Fig. 9 Correlations between the independent FYs of U-235 and Pu-239. |
| In the text | |
|
Fig. 10 Relative differences between GEF and JEFF3.3 of the means and standard deviations of Pu-239 independent FYs. |
| In the text | |
|
Fig. 11 Prior and posterior biases of the FP concentrations of fuel sample U1. |
| In the text | |
|
Fig. 12 Correlations between the model parameters when MLO is not used. Each correlation coefficient has its 95%-bootstrap-confidence interval over-laid on it. |
| In the text | |
|
Fig. 13 CDFs of BFMC’s weight distributions when MLO was and was not applied. |
| In the text | |
|
Fig. 14 The left y-scale shows Relative differences between the prior and posterior means and the relative standard deviations (relative to their perspective means) FYs of Pu-239 calculated when MLO was and was not used. The right y-scale (in red) shows the added relative standard deviation to the PIE data by MLO, with the size of red dot being proportionalto the skewness of the calculated value’s PDF. |
| In the text | |
|
Fig. 15 Posterior biases and uncertainties of the FP concentrations obtained when MLO was and was not applied. |
| In the text | |
Current usage metrics show cumulative count of Article Views (full-text article views including HTML views, PDF and ePub downloads, according to the available data) and Abstracts Views on Vision4Press platform.
Data correspond to usage on the plateform after 2015. The current usage metrics is available 48-96 hours after online publication and is updated daily on week days.
Initial download of the metrics may take a while.