| Issue |
EPJ Nuclear Sci. Technol.
Volume 12, 2026
|
|
|---|---|---|
| Article Number | 6 | |
| Number of page(s) | 15 | |
| DOI | https://doi.org/10.1051/epjn/2025077 | |
| Published online | 06 February 2026 | |
https://doi.org/10.1051/epjn/2025077
Regular Article
Safety-related investigations designing a soluble-boron-free small modular reactor core at equilibrium
Karlsruhe Institute of Technology (KIT), Hermann-vom-Helmholtz-Platz-1, Eggenstein-Leopoldshafen 76344, Germany
* e-mail: This email address is being protected from spambots. You need JavaScript enabled to view it.
Received:
16
June
2025
Received in final form:
6
October
2025
Accepted:
19
November
2025
Published online: 6 February 2026
Abstract
Many water-cooled SMRs (WC-SMRs) are being developed and their deployment is being considered in different countries world-wide, with some designs considering no soluble boron in the coolant. The elimination of soluble boron in the coolant of WC-SMRs offers advantages such as an enhanced negative moderator temperature coefficient, reduced corrosion, and simplified chemical systems, etc. leading to the growing interest in Soluble-Boron-Free (SBF) SMR-designs. Without soluble boron, excess reactivity control relies on burnable absorbers and control rods, potentially increasing power peaking factors and requiring careful core design to ensure safety margins. This study starts with an academic SBF Karlsruhe Small Modular Reactor (KSMR) core designed with a fresh fuel loading in order to find an optimal equilibrium cycle following a two-batch refueling strategy by optimizing fuel enrichment, burnable absorber rod configuration, and Gd2O3 content using CASMO5 and SIMULATE5. A Golang-based tool, named CoreOptimizer, was developed to automate the input file generation, simulation execution and output data extraction, enabling efficient core optimization. The resulting core design meets safety and performance criteria. This paper describes the optimization process, the applied tools and discusses the key neutronic and safety characteristics of the optimized equilibrium core design.
These authors contributed equally to this work.
© Y. Song and V.H. Sanchez-Espinoza, Published by EDP Sciences, 2026
 This is an Open Access article distributed under the terms of the Creative Commons Attribution License (https://creativecommons.org/licenses/by/4.0), which permits unrestricted use, distribution, and reproduction in any medium, provided the original work is properly cited.
1. Introduction
Small Modular Reactors (SMRs) offer several advantages due to their smaller size and modular fabrication, including lower initial capital investment, scalability, siting flexibility, and reduced transportation of nuclear material. These features make SMRs attractive for diverse applications such as electricity generation, district heating, and industrial processes. In recent years, the development of SMRs has accelerated globally, particularly within the European Union. The establishment of the European Industrial Alliance on Small Modular Reactors in 2024 highlights Europe’s commitment to advancing SMR technology [1]. To enable the deployment of SMRs in Europe by the early 2030 s, many European SMR projects–including light-water SMRs such as ELSMOR, McSAFER, SASPAM-SA, EASI-SMR, and SANE–have been selected and co-funded by the Euratom Research and Training (R&T) Program [2].
Globally, WC-SMRs have drawn considerable attention for leveraging proven Pressurized Water Reactor (PWR) technologies. Notable WC-SMR projects include NuScale (USA), CAREM (Argentina), SMART100 (South Korea) [3], and evolutionary designs like the AP-300 (USA), ACP-100 (China) [4], Rolls-Royce SMR (UK), and BWRX-300 (USA/Canada). With various WC-SMR concepts underway across Europe–such as the Rolls-Royce SMR in the Czech Republic [5], NUWARD in France [6], NuScale VOYGR in Romania [7]–there is a pressing need to evaluate numerical tools for core and plant safety assessments, and to strengthen experimental databases for code validation. Research initiatives like McSAFER [8], ELSMOR [9], PASTELS [10] have been launched in recent years to address these needs. Particularly, McSAFER investigated the behaviour of four SMR cores (CAREM, NuScale, KSMR, F-SMR) at Beginning of Cycle (BOC) conditions using both industry-standard and advanced computational tools. Building on these studies, the present work extends the investigation of the KSMR core by considering core depletion, refueling strategies, and equilibrium cycle performance.
A major trend in WC-SMR innovation focuses on the development of soluble-boron-free (SBF) designs, such as i-SMR (KAREI, South Korea) [11], PRATIC (CEA, France) [12], and KSMR (KIT, Germany) [13]. SBF designs offer several advantages, including a more negative moderator temperature coefficient, reduced corrosion, lower liquid waste production, and simplified chemical and volume control systems.
Moreover, designing a soluble-boron-free SMR core presents specific challenges compared to conventional boron-based cores. Without soluble boron for reactivity control, SBF cores require a greater number of burnable absorbers (BAs) and control rods (CRs) to manage excess reactivity. This leads to increased power distribution heterogeneity and greater sensitivity of the axial power profile to CR insertion depths. Reliable control rod systems are therefore critical to ensure safe shutdown margins across all operational states.
To tackle these challenges, several design strategies have been adopted including optimized BA designs to reduce reactivity swings during operation [14–16], radial multi-zoning [12, 17] and heterogeneous axial fuel assemblies [13, 18, 19] to flatten power distribution, larger fuel pin pitch to improve neutron moderation [15, 20], and more assemblies employed with control rod to enhance shutdown capability [12].
Furthermore, studies have demonstrated that for WC-SMR core analyses, a multi-group energy structure (beyond the traditional two-group model) is recommended due to the relatively harder neutron spectrum compared to large LWRs [21].
Consequently, these investigations aim to design an optimal equilibrium SBF SMR-core by determining:
-
the optimal fuel enrichment distribution across different fuel assemblies (FA) designs,
-
the number, position, and loading of BAs, and
-
the control rod layout and patterns.
The starting point for these investigations is the academic KSMR-core design, initially developed with fresh fuel loading KSMR [13]. This study adopts a two-batch refueling strategy to develop an equilibrium core, serving as a representative model for core performance and safety analysis. The goal is to achieve a design that balances cycle length and fuel utilization while satisfying all safety criteria. Section 2 describes the main constrains for the neutronic core optimization. Section 3 discusses the parameters to be determined during the optimization process while Section 4 details the safety criteria applied to the process. The tools selected for these investigations are briefly described in Section 5. The Section 6 outlines the searching process of optimal equilibrium core. The Section 7 describes the main features of the optimized equilibrium core while the conclusions and outlook are provided in Sections 8 and 9, respectively.
2. Main constrains for the neutronic core optimizations
The design of an SBF SMR core is a complex task due to many adjustable parameters. To effectively manage this challenge, certain parameters must be fixed before optimization can proceed. This section outlines the foundational parameters and conditions applied throughout the core design process.
2.1. Original design of the fresh KSMR-core
The core design builds upon the academic KSMR model, which consists of 57 fuel assemblies (FAs) with an active core height of 2 meters. Detailed core characteristics are provided in [13]. Certain geometric parameters and operating conditions are fixed for the optimization, as summarized in Table 1. Due to the relatively large neutron leakage effects in SMR cores, a heavy stainless-steel reflector [22] is employed both radially and axially to minimize leakage. All core simulations are performed at hot full power (HFP) conditions with equilibrium xenon concentrations.
Geometrical data and operation conditions of the 3D core model.
2.2. Fuel assembly configurations
Each FA adopts a 17 × 17 rod array, comprising 289 positions allocated to fuel rods, burnable absorber (BA) rods, an instrumentation thimble, and 25 control rod guide tubes. The fuel rods are loaded with UO2 pellets enriched to less than 5 wt.% U-235, and the FAs are considered axially homogeneous. Gadolinium oxide (Gd2O3) is selected as the BA material, with a Gd-loading below 10 wt.%. Gd2O3 is widely adopted in LW-SMRs due to its high thermal neutron absorption cross-section, material compatibility with UO2, and the absence of helium production during irradiation [23]. Detailed specifications of the pin types are provided in Table 2.
Pin types and physical parameters of the fuel assembly.
2.3. Refueling strategy
Efficient refueling management is crucial for achieving an equilibrium core with balanced power distribution and exposure. As reactor operation progresses, fuel assemblies experience heterogeneous burnup due to non-uniform neutron flux, necessitating periodic core reloading to optimize fuel utilization. Among others, once-through [14, 24], two-batch [12, 15], and three-batch [17] refueling strategies are followed worldwide. The 2-batch refueling strategy improves fuel utilization compared to the one-through core and offers a reduced refueling frequency compared to a 3-batch scheme. Furthermore, for the objective core of only 57 FAs, 2-batch refueling ensures a smaller power gradient compared to a 3-batch scheme, which involve only 19 fresh FAs in each cycle. Therefore, the 2-batch refueling strategy was selected for this study due to the balance of refueling frequency and power distribution uniformity. Each equilibrium cycle consists of 29 fresh FAs and 28 once-burned FAs.
 |
Fig. 1. Radial refueling loading patterns for equilibrium core. |
The common refueling strategies in PWR include out-in (where fresh FAs are loaded in the periphery) and low-leakage (where several burned FAs are placed in the periphery). These strategies are also applied to light-water SMR designs, such as out-in strategy in [12] and low-leakage strategy in [15, 17]. In this investigation, the low-leakage refueling scheme was selected because it reduces the neutron leakage from the core, offering a potential advantage in improving fuel utilization.
In the SBF SMR designs, the fresh assemblies are radially divided into multiple zones to compensate the uniformity of radial power distribution [12, 15, 24]. Accordingly, the fresh assemblies in the objective core are radially divided into four zones. Burned FAs are strategically relocated either outward to suppress leakage or inward to counteract central reactivity peaks. The central FA is replaced each cycle.
The fuel assembly shuffling pattern between cycles is illustrated in Figure 1, where each FA’s position is identified by a serial number denoting its column and row. “Cycle N” represents the current cycle, and “Cycle N-1” the preceding one. Serial numbers on burned FAs indicate their former locations, clearly mapping the refueling process.
2.4. Constraints for the core reactivity control
Specific positions within each FA are reserved for control rod insertion, see Figure 2. When control rods are fully withdrawn, these guide tubes are flooded with water. The control system is divided into regulating banks and safety banks. Regulating banks manage fine reactivity control and radial power shaping during operation, whereas safety banks, fully withdrawn under normal conditions, are designated for rapid reactor shutdown in emergencies. The elimination of soluble boron necessitates a greater dependence on control rods for both reactivity control and shutdown capability, leading to an increased number of CRs compared to conventional boron-based SMRs [16, 17].
 |
Fig. 2. Control rod guide tubes in one fuel assembly. |
Without soluble boron, the axial power distribution becomes more sensitive to control rod positions, potentially resulting in higher peak powers. To prevent this, regulating banks are grouped, and the control rod layout is optimized. A typical PWR control rod insertion pattern with 50% overlap between banks is adopted: the next bank begins insertion once the preceding bank reaches half-stroke, ensuring smoother reactivity management.
3. Parameters to be determined during the core design optimization
With several core parameters and conditions fixed, this section introduces the variables to be determined, including the fuel enrichment (ENR), the BA-rod number per assembly and Gd2O3 concentration in BA-rod. The approach begins with analyzing individual fuel assemblies (FAs) to evaluate reactivity trends, which then guides the selection of parameter combinations for core design optimization.
These 2D lattice simulations were conducted with reflective radial boundary conditions at averaged fuel and coolant temperatures of 900 K and 590 K, respectively. All fuel assembly models were depleted.
3.1. Single fuel assembly burnup analysis with varying enrichment
Firstly, a single lattice model of the FA-design shown in Figure 2 was simulated using CASMO5 to explore various fuel enrichment but without burnable absorbers. The purpose of this step is to quantify the natural depletion rate of the fuel and thus evaluate the appropriate range for the initial enrichment. Figure 3 illustrates the resulting k-inf as a function of burnup for different enrichments. As shown, higher fuel enrichment leads to a higher k-inf as expected. For all enrichments, k-inf decreases as the fuel burns up, and this reduction appears relatively linear.
 |
Fig. 3. k-inf changing with burnup in the lattice models. |
3.2. Single fuel assembly burnup analysis with various burnable absorber designs
The SBF-SMR core design utilizes FAs with different numbers of BA rods (16, 24 and 32 rods per FA according to [13, 14]), see Figure 4 for radial layouts. While single-FA burnup calculations cannot predict absolute core reactivity in the core depletion due to neutron flux variations, they effectively reveal reactivity trends to guide the combinations of ENR and BA configurations.
 |
Fig. 4. Radial arrangements of the FAs with various BA rods. |
Achieving optimal BA burnout rate requires a careful balance between the fuel enrichment and the total BA loading per assembly, which depends on both the BA-rods number per FA and Gd2O3 concentration in BA rods. The BA depletion rate must be precisely controlled: too rapid leads to a significant reactivity increase that challenge reactor control systems, while too slow results in excessive residual BA material that reduces EOC excess reactivity. Therefore, the proper combination of BA rod number and Gd2O3 concentration is important for the core design.
Figure 4 shows four FA-designs characterized by the same CR-positions with varying number of BA-rod number ranging from 16 to 40 considered in this study.
The depletion behaviour of the FA with an enrichment of 3.5% but different BA-rods and a fixed Gd-enrichment of 8% and for a fixed number of 16 BA-rods and a Gd-enrichment of 2 to 10 wt.% were evaluated with CASMO5 using the same parameters as the ones described before.
Figures 5 and 6 demonstrates the effect of BA on the k-inf as a function of fuel burnup in an assembly with fixed 3.5% enrichment when the control rods are excluded. Figure 5 shows the influence of number of Gd rod per FA. As shown, Gd effectively suppresses the reactivity at beginning of cycle (BOC). A larger number of Gd rod per assembly leads to a stronger initial suppression, resulting in a lower starting point for the k-inf curve. Figure 6 analyses the effect of Gd2O3 concentration. The greater the Gd2O3 concentration in the BA-rod, the larger the decrease of the peak of k-inf and of the shift of the peak to higher burnup.
 |
Fig. 5. k-inf evolution versus burnup for single FAs with different burnable absorber numbers per FA. |
 |
Fig. 6. k-inf evolution versus burnup for single FAs with different Gd2O3 weight percentage. |
3.3. Core design parameter ranges
The combinations of fuel assembly parameters are assigned based on the refueling loading pattern in Figure 1: outer-region assemblies FA1 and FA3 receive higher enrichment with fewer BA rods to compensate for lower neutron flux, while the inner-region FA2 utilize lower enrichment and additional BA rods to control power peaking, and the central assembly FA4 was given the lowest enrichment to minimize the central power peak.
Therefore, the range of variables for the four FAs are defined with specific intervals, as shown in Table 3. The core design process will subsequently consider these parameter ranges for optimization selection in Section 6. This systematic combination results in 27 lattice models. As the core consists of four FA types, the total number of core configurations is calculated as the product of these combinations, yielding 1152 configurations.
The combinations of fuel assemblies and parameters for selection.
4. Safety criteria to be fulfilled
Strict adherence to established safety criteria is essential to ensure fuel integrity, inherent safety core design, sufficient shutdown margin, and the prevention of overheating. Compliance with these limits guarantees good core design and safe reactor operation.
4.1. Power peaking factors
Excessive local power can lead to fuel overheating, cladding failure, or even fuel melting. It may also cause a departure from nucleate boiling (DNB), significantly reducing heat transfer efficiency and further exacerbating fuel overheating. Therefore, maintaining the peak power factors within safety limits is crucial.
Two key parameters are monitored:
-
(1)
peak pin linear power factor (
 ): the ratio of the maximum local linear pin power density to the core-average pin power density.
 -
(2)
Nuclear enthalpy hot channel factor (
 ): the ratio of the integrated power along the hottest fuel rod to the average rod power. It assumes a uniform mass flux and an identical axial power profile for all fuel rods.
The calculations of F q and F ΔH are defined in (1) and (2), where P PIN(x, y) and P PIN(x, y, z) are the 2D and 3D pin powers, and S and V represent cross-sectional area and core volume.
![Mathematical equation: $$ \begin{aligned} F_{q} = \frac{{^{\max }_{x,y,z}}^{[P^{\mathrm{PIN} }(x,y,z)]}}{\frac{1}{V}\int \int \int P^{\mathrm{PIN} }(x,y,z){\mathrm{d}x\,\mathrm{d}y\,\mathrm{d}z}} \end{aligned} $$](/articles/epjn/full_html/2026/01/epjn20250048/epjn20250048-eq3.gif) (1)
(1)
![Mathematical equation: $$ \begin{aligned} F_{\mathrm{\Delta H}} = \frac{{^{\max }_{x,y}}^{[P^{\mathrm{PIN} }(x,y)]}}{\frac{1}{S}\int \int P^{\mathrm{PIN} }(x,y){\mathrm{d}x\,\mathrm{d}y}}. \end{aligned} $$](/articles/epjn/full_html/2026/01/epjn20250048/epjn20250048-eq4.gif) (2)
(2)
In accordance with US NRC guidelines [25], the conservative limit for peak linear power is 44.49 kW/m under normal conditions. To enhance safety margins, this study adopts the more restrictive Westinghouse limit of 35.76 kW/m [26]. The corresponding  safety limit at full power is calculated to be 3.26 (see (3)).
 (3)
(3)
Even though subcooled boiling can be found in few channels, the bulk coolant temperature must be below saturation temperature. Therefore, the maximum  is derived using (4) [12], involving the core thermal power
  , primary coolant flow rate
  , specific heat capacity
  (
( for water at 310.15°C and 150bar [27]), and coolant temperatures
  and
and  .
.
 (4)
(4)
4.2. Axial power offset
Axial power offset (AO) is a critical parameter, especially in SBF cores where the absence of soluble boron increases sensitivity to control rod positions.
At BOC, partial CR insertion skews the AO toward the bottom, with neutron flux and burnup concentrated there. As burnup progresses and CRs are gradually withdrawn, the AO shifts upward. Significant positive or negative AO values can elevate the risk of power excursions, which must be avoided.
AO is calculated using (5) as:
 (5)
(5)
where  and
and  are the powers of the bottom and top halves of the core, respectively. The acceptable range for AO is −0.4 < AO < 0.4 based on SMR design considerations [28].
4.3. Reactivity temperature coefficients
Negative reactivity temperature coefficients provide an inherent self-stabilizing effect, ensuring that as temperature rises, reactivity decreases, thereby enhancing operational and transient safety. The most significant contributions are Moderator Temperature Coefficient of the reactivity (MTC) and Fuel Temperature Coefficient of the reactivity (FTC).
These are calculated by the reactivity differences between two core states at different temperatures, as shown in (6) and (7).
 (6)
(6)
 (7)
(7)
For the self-stabilizing safety, MTC and FTC must be negative. Due to the elimination of soluble boron, the MTC is anticipated to be less negative compared to boron-based designs [29].
4.4. Assembly average discharge exposure
The discharge exposure, which is the burnup depth of fuel removed from the reactor core, ideally should be as high as possible to maximize economic efficiency. However, the maximum allowable discharge exposure is constrained by the material performance of the fuel elements. This refers to the fuel element’s stability under irradiation and high-temperature conditions. Consequently, to maintain the long-term integrity of these materials, UO2 fuel has an established exposure limit of 62 GWd/t for rod average exposure and 55 GWd/t for assembly average exposure [30].
4.5. Cold shutdown margin with single failure
The shutdown system must guarantee core subcriticality under all operational conditions. The most conservative condition for cold shutdown margin (CSDM) calculations is Cold Zero Power (CZP), which requires the highest control rod worth.
To ensure conservative safety margins, cold shutdown margin (CSDM) calculations adopt the single failure criterion, assuming:
-
the control rod with highest reactivity is assumed stuck at the fully withdrawn position
-
all other control rods are fully inserted
-
system is maintained at cold temperatures
According to KTA safety criteria [31], the CSDM must be at least 1000 pcm under this extreme assumption [13].
5. Simulation tools involved in the core design process
5.1. Neutronics codes in the two-step approach
Accurately simulating an entire nuclear reactor core at a pin-by-pin level presents significant computational challenges, primarily due to the intricate nature of the neutron transport and burnup equations. For example, the starting core contains 57 fuel assemblies, each featuring a 17 × 17 lattice of rods. This necessitates multi-dimensional transport calculations with extremely fine spatial discretization for all rods. Furthermore, the strong energy dependency of neutron cross-sections requires refined energy group structures to obtain effective cross-sections. To overcome these computational hurdles, the nuclear industry widely adopts a “two-step” approach for core simulations and analysis. This approach is applied in this study and its process is illustrated in Figure 7.
 |
Fig. 7. Two-step approach in the core simulation. |
Step 1: Detailed Fuel Assembly Modeling using a lattice code. This process begins with detailed two-dimensional (2D) lattice physics calculations performed with CASMO5 for each FA type. Each fuel pin is explicitly modeled with a fine mesh, and the continuous energy spectrum is discretized into 19 energy groups, employing reflective outer boundary conditions. To capture comprehensive TH feedback and operational conditions, this step involves “branch calculations” across varying moderator and fuel temperatures (293–615 K/293–1500 K), burnup states (0–80 GWd/t), and control rod positions. The results are then processed by CMSLINK5, which performs homogenization and energy condensation, processing transport cross sections to diffusion cross sections and collapsing nuclear data from 19 to 4 energy groups at the FA level. This compiled data forms a unified cross-section library for subsequent core-level simulations.
Step 2: Full Core Simulation using a nodal code. In the second step, three-dimensional (3D) nodal diffusion calculations are conducted with SIMULATE5 using the generated nuclear data library. Radially, the core is subdivided into 57 fuel and 40 reflector nodes; axially, the active core height is divided into 20 axial nodes, plus one top and one bottom reflector nodes. SIMULATE5 solves the neutron diffusion equation, incorporating local TH feedback. Its internal TH module models each assembly with an active channel and parallel bypass channels, solving mass, steam, enthalpy and momentum balance equations per axial node. It computes 3D fuel temperatures by solving the radial Fourier heat conduction equation. Additionally, SIMULATE5 predicts pin power via its pin power reconstruction capability, leveraging form functions pre-generated by CASMO5 for each FA type.
5.2. Development of a tool to automate the two-step approach
The reactor core design is an iterative optimization process because of the single-FA burnup calculations cannot accurately predict core-wide reactivity evolution during depletion due to spatial neutron flux variations across the core. This fundamental constraint necessitates a design process that balances safety requirements with operational targets. Although the conventional two-step approach effectively addresses the computational hurdles, it requires manual effort for extensive input generation, simulation execution, and output processing, making the entire workflow both time-consuming and prone to human error.
To overcome these limitations, a CoreOptimizer tool was developed. Written in Golang, the CoreOptimizer automates the conventional “two-step” approach by managing all phases: input file generation, simulation execution, output data extraction and results visualization. By decreasing manual intervention, the tool enhances both the efficiency and reliability of the core design process.
6. Determination of the optimized equilibrium SBF SMR core
An equilibrium cycle represents a steady-state refueling pattern. A constant number of fuel assemblies are removed, reloaded, and relocated in fixed core positions between consecutive cycles. This ensures that main characteristics such as fuel assembly discharge exposure, cycle length and reactivity stabilize within a small tolerance from cycle to cycle [32, 33]. For ARO conditions, the k-eff differences between adjacent cycles of less than 1% confirms ARO equilibrium core. For critical conditions, the core is considered to be in critical equilibrium when the FA discharge exposure remains consistent.
The core design process employs a brute-force selection approach, which is efficiently managed by applying the developed CoreOptimizer tool with commercial tools CASMO5 and SIMULATE5. The overall process is outlined in Figure 8. The initial fresh core is randomly selected as it does not influence the equilibrium core behavior. The design process begins with ARO conditions search to isolate effects from control rods, subsequently moving to the critical conditions search.
 |
Fig. 8. Flowchart of brute-force core design process. |
6.1. Selection under all-control-rods-out (ARO) conditions
The CoreOptimizer automates the generation of 27 CASMO input files for fuel assemblies, as detailed in Table 3. CoreOptimizer then executes these CASMO input files for FAs via scripts cas5.ps1, generating cross-section files in *.cax format for each FA. CMSLINK5 processes the *.cax files, consolidating all segments into a unified *.lib library file for the subsequent core simulations.
The 3D core simulations are conducted with SIMULATE5, where CoreOptimizer significantly enhances efficiency. Cycle 1 is randomly selected and simulated to 21 GWd/t. From cycle2 onward, the core follows the same refueling strategy, with CoreOptimizer generating multiple SIMULATE input files by reading FA segments from the *.lib file. The core radial layout is fixed, applying distinct FA types FA1, FA2, FA3 and FA4. These segments contain data on ENR, BA rods per FA and BA loading for each cycle. For each simulation cycle, users can define specific selection criteria, including the k-eff range, 3D and 2D peak pin power fraction, power axial offset, assembly radial power peak factor. These values can be adjusted cycle by cycle. Configurations that fulfil all selection standards are retained on disk, while others are deleted to save space. Notably, data for all configurations, including those not saved, are stored into an SQL database.
The cycle1 endpoint (21 GWd/t) serves as the starting point for cycle 2. In cycle2, 1152 core configurations were generated and evaluated against the criterion k-eff (BOC) ≥ 1.0. The scatter plot (Fig. 9) illustrates the relationship among the maximum exposure the cycle can reach, maximum k-eff and maximum F–q throughout the cycle. Configurations that failed to meet the specified criterion (k-eff (BOC) ≥ 1.0) were deleted, which are the cases with a cycle exposure of 0. The remaining configurations were advanced to cycle 3, starting from the cycle 2 state at 20 GWd/t.
 |
Fig. 9. Scatter plot of cycle2 simulation results: maximum k-eff vs. maximum F–q vs. Cycle exposure. |
 |
Fig. 10. Scatter plot of cycle5 simulation results: maximum k-eff vs. maximum F–q vs. Cycle exposure. |
The ARO core simulations were repeated up to cycle5. From cycle3 onward, the starting point for each cycle was consistently set at the 20 GWd/t state of the previous cycle, and simulations proceeded to 20 GWd/t under the same selection criterion. Configurations meeting the criteria were carried forward using identical fuel assembly segment definitions to drive the system toward equilibrium. All failing configurations were removed in each cycle. As a result, the data points in Figure 10 is a subset of those in Figure 9. The difference in maximum cycle exposure between the two figures arises from the different starting points: cycle 2 begins from cycle 1, whereas cycle 5 begins from cycle 4.
Figure 10 effectively illustrate the trade-off between Max k-eff and Max F–q among configurations that achieve the target cycle exposure. This visualization supports the following selection of a core configuration that balances safety margins and operational performance.
6.2. Determination of ARO equilibrium cycle and regulating control rod banks
Three representative configurations were selected as shown in Table 4 for determination of ARO equilibrium cycle.
Three core configurations for the determination of regulating banks.
The k-eff evolution across burnup for cycles 1–5 under ARO conditions is shown in Figure 11, differences in k-eff between cycle 4 and cycle 5 were less than 0.5% for the selected configurations, indicating equilibrium behavior. Therefore, the cycle5 is used to determine the layout of regulating CR banks.
The final CR layout (Fig. 12) consists of four regulating banks (R1–R4) and safety banks:
-
(1)
regulating banks: equipped with Ag-In-Cd or stainless-steel rods (R1, R2 use stainless steel) to mitigate axial power peaking.
-
(2)
Safety banks: made of B4C rods to ensure sufficient shutdown margin. No further subdivision of safety banks was implemented.
 |
Fig. 11. k-eff as a function of burnup from cycle1 to cycle5 of the three core configurations. |
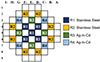 |
Fig. 12. Regulating control rod radial layout. |
6.3. Selection under critical conditions
Subsequently, from cycle 6 onward, SIMULATE5 was used to simulate core behavior with the determined CR layouts, incrementally adjusting CR positions to maintain criticality (k-eff between 0.9990 and 1.0001). Each CR bank movement was modeled in 0.5 cm increments. Cycles 6 to 8 were simulated without eliminating configurations until cycle 9, where the FA discharge exposure stabilized between cycles. For these critical core simulations, the cycle exposures were set to either 20 or 21 GWd/t. Specifically, for a given exposure, all cycles from 6 to 9 conducted to the same set exposure. The final safety criteria were applied to cycle 9:
-

-

-
 .
.
After applying these criteria, 11 configurations remained for the 20 GWd/t exposure and 2 configurations remained for 21 GWd/t, as shown in Figure 13. Given the goal of improving fuel utilization and maintaining safety margins, the longer 21 GWd/t cycle exposure is preferred. Of the two remaining configurations, the peak F_q values are 2.842 (Configuration I, orange curve) and 2.819 (Configuration II, green curve), respectively, maintaining margins of 12.8% and 13.5% below the limit 3.26 (red line), respectively. And their configurations are listed in Table 5. Consequently, the one with lower F_q throughout the cycle was selected as the optimized core design.
 |
Fig. 13. Max |

The remaining core configurations with cycle exposure 21 GWd/t.
7. Characterization of the selected optimal core design
The optimal core adopted refueling pattern shown in Figure 1 and the radial arrangement of CR banks is depicted in Figure 12. The final core configuration is the configuration I in Table 5.
7.1. Control rod position during the depletion
Figure 14 presents the axial positions of the regulating banks throughout the equilibrium cycle. In the left plot, 0 cm and 200 cm correspond to the bottom and top of the active core, respectively.
 |
Fig. 14. Axial positions of regulating banks. |
-
(1)
Bank R1 remains fully inserted throughout the cycle.
-
(2)
Bank R2 stays fully inserted until approximately 18 GWd/t, after which it begins withdrawal.
-
(3)
Banks R3 and R4 are initially partially inserted and start gradual withdrawal at around 12 GWd/t.
This CR withdrawal strategy ensures smooth reactivity control and maintains a stable axial power distribution throughout the operating cycle.
7.2. Nuclear enthalpy hot channel factor
Figure 15 presents the evolution and location of the maximum  .
.
 |
Fig. 15. Cycle exposure and location of maximum F-delta-H in the equilibrium core. |
-
(1)
Plot (a) shows the maximum
 value of 1.571 at 18 GWd/t, maintaining a 3.02% safety margin relative to the limit of 1.62 (red line).
 -
(2)
Plot (b) identifies assembly 7C− as the location of the highest RPF at 18 GWd/t.
-
(3)
Plot (c) shows the pin-by-pin distribution of
 in 7C−, where the peak appears in rows 3–4, line 5.
7.3. Power axial offset
Figure 16 shows the evolution of the axial offset (AO) throughout the equilibrium cycle.
-
(1)
A bottom-biased power distribution is observed at BOC and MOC.
-
(2)
Toward EOC, the AO shifts upward.
 |
Fig. 16. Power axial offset along the cycle exposure. |
Importantly, the AO remains within the accepted range [−0.4, +0.4] throughout the entire cycle, ensuring stable axial power behaviour.
7.4. Reactivity temperature coefficients
Figure 17 depicts the moderator (MTC), and fuel temperature coefficients (FTC) as functions of burnup. All coefficients remain negative across the entire cycle, confirming inherent core stability. And MTC shows more negative values than FTC.
 |
Fig. 17. Reactivity temperature coefficients of the equilibrium core. |
Compared to conventional boron-based cores, the SBF SMR exhibits more negative MTC values. This enhanced temperature feedback ensures stronger self-regulation: rising core or moderator temperatures lead to significant reactivity reductions, aiding in power suppression during transients. Furthermore, the increasing negativity of the coefficients with burnup enhances inherent safety at later stages of the fuel cycle.
7.5. Axial power and temperatures profiles
Figure 18 illustrates the axial power distribution and axial temperatures of fuel centerline, fuel cladding and coolant at different stages of its equilibrium cycle: BOC (Beginning of cycle), MOC (middle of cycle) and EOC (end of cycle). The axial power distribution is analyzed first.
-
At BOC, the axial power distribution is slightly skewed towards the bottom of the core. This arises from the coolant temperature increasing from the bottom to the top, as displayed in Figure 18d. The higher coolant temperature at the core top reduces its density, leading to weaker moderation and lower power generation.
-
As the core burned to MOC, the axial power distribution shifts further downward, exhibiting a distinct peak around 70 cm. This is attributed to the insertion of control rod R4 at a depth of 94.5 cm (Fig. 14), which suppresses reactivity above this height, increasing power production in the lower core region.
-
By EOC, the axial power shifts upward, with a peak at around 150 cm. This is a classic characteristic of long-term fuel burnup: Initially, fissile material experiences a higher neutron flux at the core bottom. As it depletes over time, power generation shifts to less depleted regions, which is the core top.
 |
Fig. 18. Axial Power Distribution and axial temperature profiles of fuel centerline, fuel cladding and coolant at BOC/MOC/EOC. |
The fuel centerline temperature closely tracks the axial power distribution as heat generation occurs within the fuel itself. In contrast, the coolant temperature exhibits a steady rise from the core inlet to the outlet. The coolant enters at a lower temperature at the core inlet and progressively absorbs heat from the fuel rods as it flows upwards, reaching its highest temperature at the core exit. Meanwhile, the fuel cladding temperature remains intermediate between the fuel centreline and the coolant temperatures, reflecting the heat transfer pathway: from the fuel, through the cladding and into the coolant via convection.
7.6. Fuel assembly exposure
Figure 19 shows the FA exposure distribution at the end of the equilibrium cycle.
-
(1)
The maximum FA exposure reaches 47.26 GWd/t (assemblies 5B− and 8E−).
-
(2)
The average discharge exposure of once-burned FAs, excluding the central FA, is 42.01 GWd/t.
-
(3)
The highest pin exposure is 50.17 GWd/t at 5B−.
 |
Fig. 19. Axially-averaged fuel assembly exposure at EOC of the equilibrium cycle. |
All exposure levels remain well below the generally accepted safety limits for UO2 fuel (62 GWd/t rod average, 55 GWd/t assembly average), ensuring long-term material integrity.
7.7. Estimation of the shutdown margins at HFP/HZP/CZP for BOC, MOC and EOC
Nuclear safety regulations require reactor shutdown systems to maintain core subcriticality under all operational scenarios. Accordingly, k-eff is evaluated with all control rods inserted (ARI) under three scenarios:
-
Hot Full Power (HFP): operating condition
-
Hot Zero Power (HZP): fuel and coolant temperatures fixed at 569.15 K; core power reduced to
 of rated full power
 -
Cold Zero Power (CZP): fuel and coolant temperatures fixed at 300 K; core power reduced to
 of rated full power.
Table 6 summarizes the key reactivity effects under HFP/HZP/CZP and the and cold shutdown margin with single failure during burnup. Key observations include:
-
(1)
Xenon worth quantifies the reactivity effect due to xenon buildup between HFP and HZP.
-
(2)
Cold/hot swing indicates reactivity changes associated with coolant temperature variations.
-
(3)
The shutdown margin was calculated assuming all CRs inserted (ARI), with the single-failure assumption (the highest worth CR stuck out).
Key reactivity effects and shutdown margin at HFP/HZP/CZP during burnup.
The results confirm that the optimized core maintains sufficient shutdown margins under all operational scenarios, even with a single control rod failure at CZP.
8. Conclusions
In this study, an optimized equilibrium core configuration for a soluble-boron-free (SBF) Small Modular Reactor (SMR) was developed, focusing on neutronic and safety characteristics. The core design integrated the lattice physics code CASMO5 and the 3D nodal simulator SIMULATE5, supported by a newly developed CoreOptimizer tool to systematically explore and evaluate a wide range of core configurations. The optimized core features a two-batch refueling strategy and an enhanced control rod management scheme. Key safety and performance objectives were successfully achieved, including:
-
(1)
peak power factors with sufficient safety margins,
-
(2)
negative temperature coefficients throughout the cycle,
-
(3)
reasonable cycle length (25.3 months) with fuel assembly exposures within accepted limits,
-
(4)
good heat transfer from fuel to coolant throughout the cycle,
-
(5)
robust shutdown margins under all operating scenarios.
These results demonstrate that a soluble-boron-free SMR core can be designed to maintain strong inherent safety features while achieving competitive operational performance.
9. Outlook
Future work will explore other refueling loading patterns to further improve the fuel utilization and the power distribution. In addition, the developed core design methodology will be applied to the fresh core, leading to a multi-cycle core model. This extension will enable a more realistic simulation of reactor behaviour over extended operation periods and provide deeper insights into the long-term neutronic and safety performance of the core. In addition, Rod Ejection Accident (REA) analyses will be conducted within the multi-cycle framework to further assess the core behaviour under transients and particularly the effectiveness of negative reactivity feedbacks.
Acknowledgments
My sincere thanks go to Luigi Mercatali, G. H. Zavala and K. L. Zhang. Their discussions and feedbacks enabled the progress of this research.
Funding
This research did not receive any specific funding.
Conflicts of interest
Authors Y. Song and V.H. Sanchez-Espinoza certify that they have no financial conflicts of interest (e.g., consultancies, stock ownership, equity interest, patent/licensing arrangements, etc.) in connection with this article.
Data availability statement
Data associated with this article are not publicly available.
Author contribution statement
Y. Song: Methodology, Simulation Execution, Code Development, Data Analysis, Writing, Editing V. H. Sanchez-Espinoza: Conceptualization, Analytical Guidance, Supervising, Manuscript Review
References
- EuropeanCommission, European Industrial Alliance on Small Modular Reactors: 1st General Assembly Meeting, Brussels, 2024 [Google Scholar]
- EuropeanCommission, Small Modular Reactors (LW-SMRs and AMRs) European Projects, Co-funded by the Euratom R &T Proframme, 2024 [Google Scholar]
- IAEA, Small modular reactors: Advances in SMR developments, in International Conference on Small Modular Reactors and Their Applications, Brussels, Belgium, 2024 [Google Scholar]
- S. Danrong, L. Qing, Q. Dong et al., Key technology of ACP100: Reactor core and safety design, Nucl. Power Eng. 42, 1 (2021) [Google Scholar]
- S. Thomas, Small modular reactors for the Czech market: An update-2024, in Heinrich-Böll-Stiftung Prague & Calla – Association for Preservation of the Environment, 2025 [Google Scholar]
- D. Francis, S. Beils, NUWARD SMR safety approach and licensing objectives for international deployment, Nucl. Eng. Technol. 56, 1029 (2024) [Google Scholar]
- T. Chirica, Romania’s plans to deploy NuScale SMRs, in Fermi Energia SMR Conference, 2022 [Google Scholar]
- V.H. Sanchez-Espinoza, S. Gabriel, H. Suikkanen et al., The H2020 McSAFER project: Main goals, technical work program, and status, Energies 14, 6348 (2021) [Google Scholar]
- S. Lansou, L. Ammirabile, N. Bakouta, ELSMOR – Towards European Licensing of Small Modular Reactors: Methodology Recommendations for Light-Water Small Modular Reactors Safety Assessment (Revised), 2025 [Google Scholar]
- M. Montout, C. Herer, J. Telkkä et al., PASTELS project – overall progress of the project on experimental and numerical activities on passive safety systems, Nucl. Eng. Technol. 56, 803 (2024) [Google Scholar]
- K. Han Ok, L. Byung Jin, L. Sang Gyu, Light water SMR development status in Korea, Nucl. Eng. Des. 419, 112966 (2024) [Google Scholar]
- R. Vuiart, A. Eustache, S. Eveillard, G. Prulhière, PRATIC: A soluble-boron-free, pressurized water cooled, SMR core benchmark, EPJ – Nucl. Sci. Technol. 10, 25 (2024) [Google Scholar]
- Y.I. Alzaben, Neutronics and Thermal-Hydraulics Safety Related Investigations of an Innovative Boron-Free Core Integrated Within a Generic Small Modular Reactor (Doctoral dissertation, Karlsruher Institut für Technologie (KIT), 2019) [Google Scholar]
- B. Muth, Parametric Study on Burnable Absorber Rod to Control Excess Reactivity for a Soluble Boron Free Small Modular Reactor (Doctoral dissertation, Institute of Technology of Cambodia, 2016) [Google Scholar]
- X. Nguyen, S. Jang, Y. Kim, Truly-optimized PWR lattice for innovative soluble-boron-free small modular reactor, Sci. Rep. 11, 12891 (2021) [Google Scholar]
- S.H. Cho, W.J. Lee, S.G. Hong, Neutronic design and analysis of a soluble boron-free small modular reactor core with GdN-CBA burnable absorber rods for load-following operations, Ann. Nucl. Energy 214, 111203 (2025) [Google Scholar]
- L. Wang, H. Ju, Q. Li et al., Multiple choices of reactor core nuclear design for ACP100’s application in different scenarios, EPJ Web Conf. 247, 19002 (2021) [Google Scholar]
- D. Lee, Nuclear Reactor Core Characteristics and Advanced Design Methods of Soluble Boron-free SMRs (Summer School on Nuclear Reactors “Physics, Fuels and Systems”, Aix-en-Provence, France, 2024) [Google Scholar]
- J. Mart, A. Klein, A. Soldatov, Feasibility study of a soluble boron–free small modular integral pressurized water reactor, Nucl. Technol. 188, 8 (2014) [Google Scholar]
- KoreaElectricPowerCorporation, APR1400 Design Control Document Tier 2: Chapter 4 Reactor, APR1400-K-X-FS-14002-NP Revision 0(2014) [Google Scholar]
- V. Valtavirta, A. Farda, E. Fridman, H. Lestani, L. Mercatali, High-Performance Advanced Methods and Experimental Investigations for the Safety Evaluation of Generic Small Modular Reactors, Report: McSAFER-D3.6, 2020 [Google Scholar]
- P. Suk, O. Chv’ala, G.I. Maldonado, J. Fr’ybort, Simulation of a NuScale core design with the CASL VERA code, Nucl. Eng. Des. 371, 110956 (2021) [CrossRef] [Google Scholar]
- J.A. Evans, M.D. DeHart, K.D. Weaver, K.D. Weaver, D.D. K. Jr., Burnable absorbers in nuclear reactors – A review, Nucl. Eng. Des. 391, 111726 (2022) [Google Scholar]
- D. Kim, Boron-free small modular reactor design by McCARD burnup calculation with T/H feedback, in Transactions of the Korean Nuclear Society Autumn Meeting, 2020 [Google Scholar]
- I. AREVA NP, AREVA Design Control Document Rev.5 – Tier 2 Chapter 04 – Reactor – Section 4.4 Thermal-Hydraulic Design, UR NRC, 2013. [Google Scholar]
- WestinghouseElectricCorporation, Westinghouse Technology Systems Manual – Section 2.2 Power Distribution Limits, 2005, [Online], Available: https://www.nrc.gov/docs/ML1122/ML11223A208.pdf, [Accessed 28 March 2019] [Google Scholar]
- X. Steam, Thermodynamic Properties of Water and Steam, [Online], Available: https://github.com/KurtJacobson/XSteam/blob/master/Excel/XSteam_Excel_v2.6.xls, [Accessed April 2024] [Google Scholar]
- J.R. Mart, Master thesis, Oregon State University, 2013 [Google Scholar]
- A. Abdelhameed, J. Lee, Y. Kim, Physics conditions of passive autonomous frequency control operation in conventional large-size PWRs, Prog. Nucl. Energy 118, 103072 (2020) [Google Scholar]
- IAEA, Design of the Reactor Core for Nuclear Power Plants, Safety Standards Series No. SSG-52, 2019 [Google Scholar]
- KTA, Design of Reactor Cores of Pressurized Water and Boiling Water Reactors; Part 2: Neutron-Physical Requirements for the Design and Operation of the Reactor Core and Adjacent Systems, Safety Standards Report No. 3101.2 of the Nuclear Safety Standards Commission (KTA), Germany (2012) [Google Scholar]
- A. Yamamoto, Ph.D. thesis, Kyoto university, 1998 [Google Scholar]
- J.J. Duderstadt, L.J. Hamilton, Nuclear Reactor Analysis (Wiley, 1976) [Google Scholar]
Cite this article as: Yi Song, Victor Hugo Sanchez-Espinoza, Safety-related investigations designing a soluble-boron-free small modular reactor core at equilibrium, EPJ Nuclear Sci. Technol. 12, 6 (2026). https://doi.org/10.1051/epjn/2025077
All Tables
All Figures
|
Fig. 1. Radial refueling loading patterns for equilibrium core. |
| In the text | |
|
Fig. 2. Control rod guide tubes in one fuel assembly. |
| In the text | |
|
Fig. 3. k-inf changing with burnup in the lattice models. |
| In the text | |
|
Fig. 4. Radial arrangements of the FAs with various BA rods. |
| In the text | |
|
Fig. 5. k-inf evolution versus burnup for single FAs with different burnable absorber numbers per FA. |
| In the text | |
|
Fig. 6. k-inf evolution versus burnup for single FAs with different Gd2O3 weight percentage. |
| In the text | |
|
Fig. 7. Two-step approach in the core simulation. |
| In the text | |
|
Fig. 8. Flowchart of brute-force core design process. |
| In the text | |
|
Fig. 9. Scatter plot of cycle2 simulation results: maximum k-eff vs. maximum F–q vs. Cycle exposure. |
| In the text | |
|
Fig. 10. Scatter plot of cycle5 simulation results: maximum k-eff vs. maximum F–q vs. Cycle exposure. |
| In the text | |
|
Fig. 11. k-eff as a function of burnup from cycle1 to cycle5 of the three core configurations. |
| In the text | |
|
Fig. 12. Regulating control rod radial layout. |
| In the text | |
|
Fig. 13. Max |
| In the text | |
|
Fig. 14. Axial positions of regulating banks. |
| In the text | |
|
Fig. 15. Cycle exposure and location of maximum F-delta-H in the equilibrium core. |
| In the text | |
|
Fig. 16. Power axial offset along the cycle exposure. |
| In the text | |
|
Fig. 17. Reactivity temperature coefficients of the equilibrium core. |
| In the text | |
|
Fig. 18. Axial Power Distribution and axial temperature profiles of fuel centerline, fuel cladding and coolant at BOC/MOC/EOC. |
| In the text | |
|
Fig. 19. Axially-averaged fuel assembly exposure at EOC of the equilibrium cycle. |
| In the text | |
Current usage metrics show cumulative count of Article Views (full-text article views including HTML views, PDF and ePub downloads, according to the available data) and Abstracts Views on Vision4Press platform.
Data correspond to usage on the plateform after 2015. The current usage metrics is available 48-96 hours after online publication and is updated daily on week days.
Initial download of the metrics may take a while.