Fig. 2
Download original image
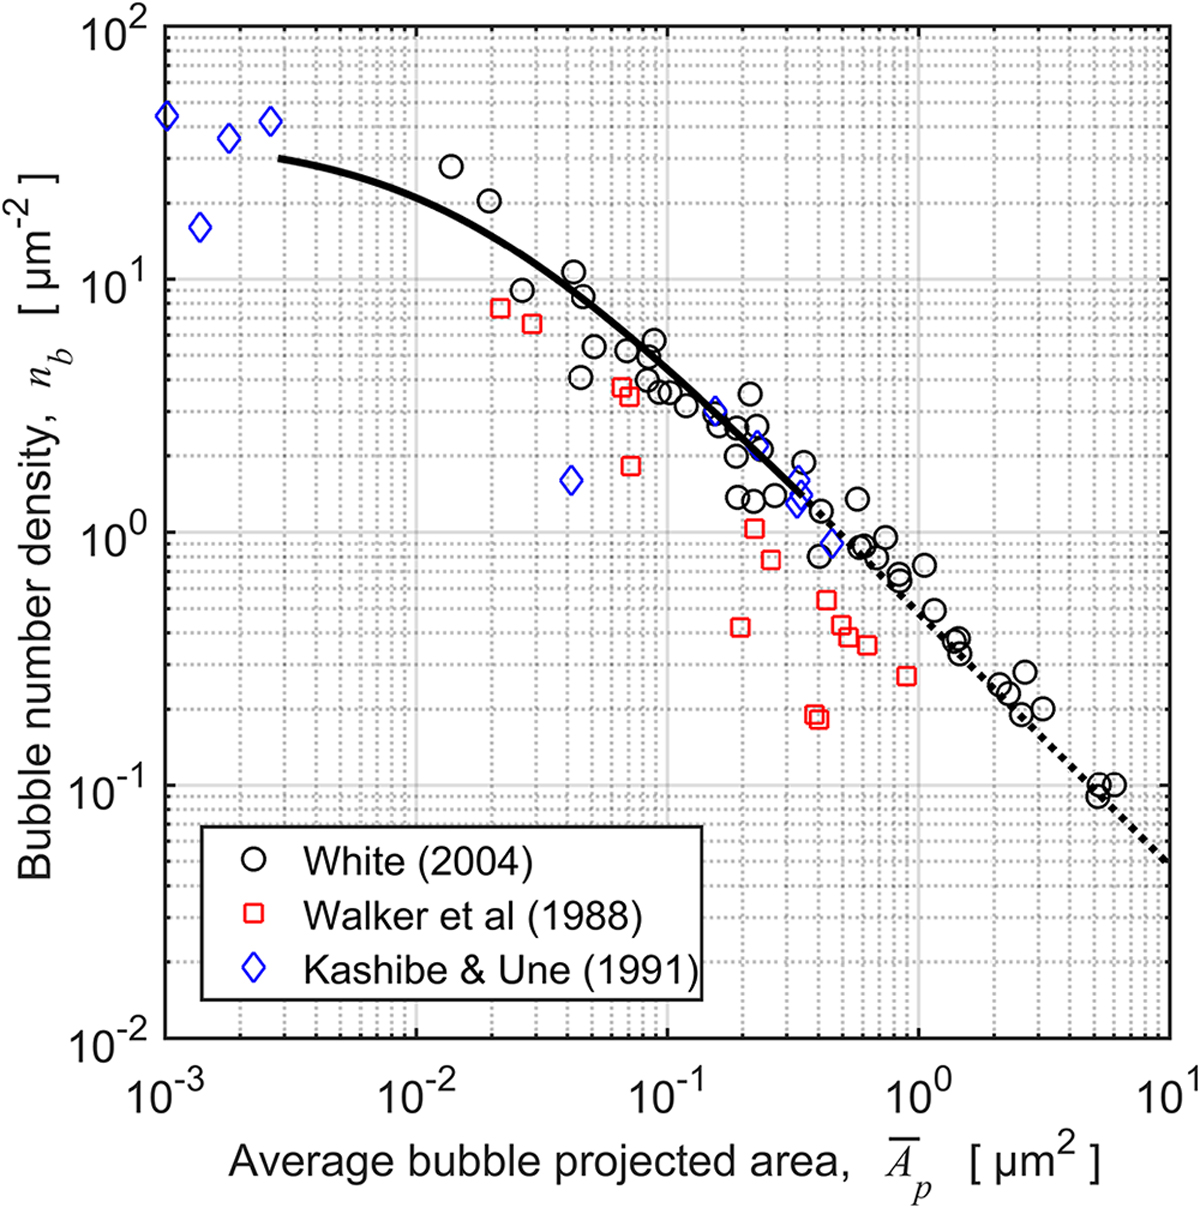
Number density of grain face bubbles versus the average projected area of the bubbles, observed in UO2 fuel with pellet average burnups between 9 and 33 MWd(kgU)−1 by White [62], Walker et al. [59] and Kashibe and Une [61]. The solid line is a plot of equation (12) over its range of application in the model. The dashed line represents the saturated grain face condition ϕ2 = nb Āp = 0.48.
Current usage metrics show cumulative count of Article Views (full-text article views including HTML views, PDF and ePub downloads, according to the available data) and Abstracts Views on Vision4Press platform.
Data correspond to usage on the plateform after 2015. The current usage metrics is available 48-96 hours after online publication and is updated daily on week days.
Initial download of the metrics may take a while.