| Issue |
EPJ Nuclear Sci. Technol.
Volume 4, 2018
Special Issue on 4th International Workshop on Nuclear Data Covariances, October 2–6, 2017, Aix en Provence, France – CW2017
|
|
|---|---|---|
| Article Number | 29 | |
| Number of page(s) | 6 | |
| Section | Covariance Evaluation Methodology | |
| DOI | https://doi.org/10.1051/epjn/2018032 | |
| Published online | 14 November 2018 | |
https://doi.org/10.1051/epjn/2018032
Regular Article
Evaluating nuclear data and their uncertainties
Nuclear Physics Group, Theoretical Division, Los Alamos National Laboratory,
LosAlamos, USA
* e-mail: This email address is being protected from spambots. You need JavaScript enabled to view it.
Received:
8
December
2017
Received in final form:
21
February
2018
Accepted:
17
May
2018
Published online: 14 November 2018
Abstract
In the last decade or so, estimating uncertainties associated with nuclear data has become an almost mandatory step in any new nuclear data evaluation. The mathematics needed to infer such estimates look deceptively simple, masking the hidden complexities due to imprecise and contradictory experimental data and natural limitations of simplified physics models. Through examples of evaluated covariance matrices for the soon-to-be-released U.S. ENDF/B-VIII.0 library, e.g., cross sections, spectrum, multiplicity, this paper discusses some uncertainty quantification methodologies in use today, their strengths, their pitfalls, and alternative approaches that have proved to be highly successful in other fields. The important issue of how to interpret and use the covariance matrices coming out of the evaluated nuclear data libraries is discussed.
© P. Talou, published by EDP Sciences, 2018
 This is an Open Access article distributed under the terms of the Creative Commons Attribution License (http://creativecommons.org/licenses/by/4.0), which permits unrestricted use, distribution, and reproduction in any medium, provided the original work is properly cited.
1 The current paradigm
The last two decades have seen a significant rise in efforts to quantify uncertainties associated with evaluated nuclear data. Most general purpose libraries now contain a relatively large number of covariance matrices associated with various nuclear data types: reaction cross sections, neutron and γ multiplicities, neutron and γ spectra, angular distributions of secondary particles. The evaluation process often follows a common procedure:
-
collect and analyze experimental differential data on specific reaction channels;
-
perform model calculations to represent those data;
-
apply a Bayesian or other statistical approach to tune the model input parameters to fit the experimental differential data;
-
use the newly evaluated data in transport simulations of integral benchmarks;
-
cycle back to original evaluation to improve performance of the library on those benchmarks;
-
continue cycle until “satisfied”.
Differential data correspond to those that pertain to specific physical quantities associated with a single reaction channel, e.g., (n, 2n) cross sections (see Fig. 1). Oftentimes, cross sections are not measured directly but instead only their ratio to another cross section such as a “standard” are reported. Such data also fall in the “differential data” category.
On the other hand, integral data represent those that can only be obtained by a more or less complex combination of differential quantities. Perhaps the most emblematic integral data in our field is the neutron multiplication factor keff of the Jezebel Pu fast critical assembly (see Fig. 2). This factor does not represent a quantity intrinsic to the isotope (239Pu) or to a particular reaction channel, as opposed to differential data. Its modeling requires a careful representation of the geometry of the experimental setup and the use of more than one nuclear data set: average prompt fission neutron multiplicity  , average prompt fission neutron spectrum (PFNS), neutron-induced fission cross section σf of 239Pu are the most important data for accurately simulating Jezebel keff. Such integral data are incredibly useful to complement sparse differential data, limited physics models, and are broadly used to validate nuclear data libraries.
Figure 3 shows several C/E calculated-over-experiment ratios of basic benchmarks used to validate the latest U.S. ENDF/B-VIII.0 library [3]. Most points cluster around C/E = 1.0, demonstrating that the simulations reproduce the experimental values extremely well. The high performance of the library to reproduce this particular suite of benchmarks is no accident, but instead the result of various little tweaks that have been applied to the underlying evaluated nuclear data to reproduced those benchmarks accurately. This fine-tuning of the library is a very contentious point, which is discussed in this contribution.
If the uncertainties are based solely on differential data, the uncertainties associated with the evaluated nuclear data and propagated through the transport simulations produce very large uncertainties on the final simulated integral numbers. For instance, propagating the very small (less than 1% at the time of the referenced work) evaluated uncertainties in the 239Pu fission cross sections to the prediction of Jezebel keff still led to a spread in the distribution of calculated keff of 0.8% [4]. This is to be compared with a reported experimental uncertainty of about 0.2% for this quantity. This is reasonable since our knowledge of the integral benchmarks has not been folded in the evaluation process. However, the expected distribution of C/E values across many benchmarks should reflect these relatively large errors. It is not the case, as shown in Figure 3, for the reason that the library was slightly tuned to reproduce this limited set of benchmarks.
If, on the other hand, the uncertainties are based solely on model calculations, the standard deviations tend to get rather small with large correlated terms, i.e., strong off-diagonal elements of the covariance matrix.
Another point of contention has been the lack of cross-correlation between the low-energy, resolved and unresolved resonance range, and the higher fast energy range evaluations, as seen for instance in Figure 4 for the 239Pu(n, γ) correlation matrix in ENDF/B-VIII.0. This is not a mistake but simply the reflection that two evaluation procedures were used to produce this combined picture of the uncertainties. Since the two energy ranges of the evaluation were done independently, using distinct experimental information and model calculations, it is not unreasonable to obtain null correlation terms between the two blocks. However, better approaches being developed [5] would create more realistic correlations between those energy ranges.
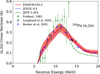 |
Fig. 1 The ENDF/B-VIII.0 evaluated 239Pu(n, 2n) cross section and one-sigma uncertainty band are shown in comparison with several experimental data sets. |
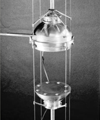 |
Fig. 2 The Jezebel 239Pu critical assembly shown above is widely used by nuclear data evaluators to constrain their evaluations of neutron-induced reactions on 239Pu, creating hidden correlations between different quantities such as |

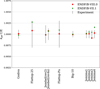 |
Fig. 3 Basic benchmarks used in the validation of the ENDF/B-VIII.0 library [3]. Overall the ENDF/B-VIII.0 library (in red) performs even better than the ENDF/B-VII.1 (in green) for this particular suite of integral benchmarks. |
 |
Fig. 4 The correlation matrix evaluated for 239Pu (n, γ) in ENDF/B-VII.1 shows two uncorrelated blocks for two energy regions, meeting at 2.5 keV, the upper limit of the unresolved resonance range. |
2 An ideal evaluation
The promise of an evaluated nuclear data library is to report values of nuclear physical quantities as accurately as possible, given the state of our knowledge at the time the library is produced. With this in mind, all pertinent information and data related to the quantity of interest should be used to infer its most accurate value and uncertainty. So not only differential data, model calculations, but any other relevant data, including integral data should naturally enter into the evaluation process. The current paradigm is a bit murkier, blending the line between differential and integral data, and “calibrating” evaluated data in order for the library to perform well when used in benchmark calculations. Although the mean values of the evaluated data are readjusted slightly to improve the performance of the library against critical benchmark validations, this readjustment is typically not included in the derivation of the associated covariance matrices, leading to an inconsistency in the evaluation process. A more rigorous approach would definitely have to include this step explicitly.
In the following, I describe what could be considered an “ideal” evaluation, including a realistic quantification of experimental uncertainties and correlations, the inclusion of all available information, the use of comprehensive physics models, the respect of basic physics constraints, and finally an estimation of unknown systematic biases.
2.1 Realistic experimental uncertainties and correlations
Most often, experimental differential data are conveniently retrieved from the EXFOR database [6]. This is a powerful tool for the evaluator who is trying to mine data related to specific isotopes and reactions, often spanning a wide range of years when the experiments were performed. Its potential use is however limited. Besides being incomplete, sometimes difficult to navigate because of the possibility to store the same data in different categories, or simply not flexible enough to accommodate complicated data sets (e.g., multi-dimensional data sets), it also lacks an important feature for use with modern data mining algorithms: meta-data. Although the information is often present in the original reports and published journal articles, it is often missing in the terse summary provided in EXFOR, or if present, can be buried in text that would be difficult to interpret using simple algorithms.
Such information is crucial in trying to estimate cross-experiment correlations. As an example, Figure 5 shows the correlation matrix obtained by Neudecker et al. [7] for the 235U thermal PFNS, covering four distinct but correlated experimental data sets. Missing such type of correlations can lead to much smaller final estimated uncertainties when using any least-square or minimization technique. A recent example is the uncertainty associated with the standard 252Cf (sf)  previously estimated at 0.13% [8] and now revised to 0.4% [9] simply based on the inclusion of cross-experiment correlations.
In the case of integral data, DICE [10], Database for the International Criticality Safety Benchmark Evaluation Project Handbook [11] is a relational database that goes a long way toward this goal of organizing complex and multi-dimensional information. A rather extensive set of queries can be performed, e.g., experimental facility, isotope, fuel-pin cell composition, and can be used efficiently to investigate the importance of specific nuclear data for particular applications. A similar approach should be undertaken for storing and mining a database of experimental differential data.
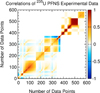 |
Fig. 5 Correlation matrix across four (4) different experimental data sets for the thermal neutron-induced prompt fission neutron spectrum of 235U. Correlations across different experiments are clearly visible below about N = 350 points. Figure taken from Neudecker et al. [7]. |
2.2 Use of all information
A controversial question surrounding the current paradigm is the somewhat arbitrary separation in the use of differential versus integral data in the nuclear data evaluation process. By siding on the side of caution and not including (properly) integral data into this process, the evaluation of uncertainties becomes inconsistent and somewhat difficult to defend and interpret. It is important to understand that the current evaluated covariances do not reflect our complete knowledge on the underlying data. For instance, the experimental uncertainty on the keff of Jezebel estimated to be about 0.2%. When uncertainties stemming from nuclear data (neutron-induced cross sections, PFNS,  , angular distributions of secondary particles) are propagated in the transport simulation of Jezebel, the calculated uncertainty [3] on keff is greater than 1%. Although the mean value of Jezebel is used as a “calibration” point for the library, this information is not reflected or used in the evaluation of the data covariance matrices. When looking more broadly at a suite of benchmarks, the C/E values cluster around 1.0 with a distribution much narrower than would be obtained if the nuclear data covariance matrices were sampled (see Fig. 3 for instance).
“Good” reasons abound for why this separation of integral vs. differential data exist in the first place, and why we face this somewhat inconsistent situation. One of those reasons is that integral data cannot provide a unique set of nuclear data that represent the measured data. To again consider the example of Jezebel, many combinations of PFNS,  and σf of 239Pu would be consistent with the measured data, leading to correlations [2] not taken into account in current evaluations. Smaller effects, such as impurities of 240Pu, would also impact the result. Besides nuclear data, uncertainties in the geometry, mass, impurities could be underestimated leading to a misstated overall uncertainty on keff. Also, and most importantly, the creation of an adjusted library would tend to tune nuclear data in the wrong place, away from what differential information indicates.
How does this situation differ from differential experimental measurements? Not very much, in fact. The nature of the data extracted is indeed different, as it is a combination of more “elemental” differential data. However, differential measurements suffer from similar limitations and sources of uncertainties, which to be precisely taken into account, should be simulated using modern transport codes. The Chi-Nu experimental team at LANSCE, aiming at measuring the PFNS of 239Pu and 235U with great accuracy, devoted significant efforts to the accurate modeling of the detector setup [12]. In doing so, they also studied past experiments and demonstrated that multiple scattering corrections were largely underestimated in the low-energy tail of the spectrum. Only detailed MCNP simulations could provide a more accurate picture of the experiment and its associated uncertainties.
Quasi-differential or semi-integral experiments provide another example blurring the line between differential and integral experiments. Measuring the total double-differential neutron inelastic scattering [13] or the spectrum-average cross sections of threshold reactions [14] produce data that cannot be directly compared to theoretically-predicted physical quantities. They do however offer valuable constraints on imprecise evaluated data, and are being used to validate and often correct data evaluations.
2.3 Comprehensive physics models
A model, no matter how elaborate, is always an imperfect representation of reality. However, the more elaborate and predictive the model is, the better it is at predicting physical quantities away from its calibration points, and as a consequence, uncertainties obtained from variations of the model parameters are much more likely to be reasonable. It is therefore very important to keep improving the physics models to lead realistic uncertainty estimates.
To continue with the example of the PFNS, a common approach to evaluating it uses a Maxwellian or Watt function, with only one or two parameters to tune to available experimental data. A more realistic representation uses the Madland-Nix model [15], which accounts in an effective and average way for the decay of some or all excited fission fragments. This model has been used extensively in most evaluated nuclear data libraries thanks to its simplicity, its limited number of parameters, and to its relatively good representation of the observed actinide PFNS. This model remains crude though in dealing with the complexity of the fission process, the many fission fragment configurations produced in a typical fission reaction, the nuclear structure of each fragment, and the competition between prompt neutrons and γ rays. The relatively small number of model input parameters leads naturally to very rigid and highly-correlated PFNS covariance matrices if obtained by simple variation of those parameters around their best central values.
A more realistic but also more complex model has been developed in recent years, using the statistical Hauser-Feshbach theory to describe the de-excitation of each fission fragment through successive emissions of prompt neutrons and γ rays. It was implemented in the CGMF code [16], for instance, using the Monte Carlo technique to study complex correlations between the emitted particles. Similar codes have been developed by other various institutes: FIFRELIN [17], GEF [18], FINE [19], EVITA [20] and a code by Lestone [21]. While the Madland-Nix model can only predict an average PFNS, CGMF can account for all characteristics of the prompt neutrons and γ rays in relation to the characteristics of their parent fragment nuclei, on an event-by-event basis. While the Madland-Nix model could use input parameters with limited resemblance with physical quantities, parameters entering in the more detailed approach are often directly constrained by experimental data different than just the PFNS. For instance, the average total kinetic energy ⟨TKE⟩ of the fission fragments plays a key role in determining accurately the average prompt neutron multiplicity  . In the ENDF/B-VII evaluation, a constant ⟨TKE⟩ was used as a function of incident neutron energy, contrary to experimental evidence [22]. Because the Madland-Nix model was not used directly to estimate
  , and because the influence of ⟨TKE⟩ on PFNS is a second-order correction only, this problem was somehow solved by using artificially high effective level density parameter to estimate the temperature of the fragments.
On the contrary, in CGMF, the correct incident neutron energy dependence of ⟨TKE⟩ is used and is important to correctly account for the measured PFNS, the neutron multiplicity, as well as many other correlated prompt fission data, e.g., γ-ray characteristics. Another example is given in Figure 6 where the angular distribution of prompt fission neutrons with respect to the direction of the light fragments is plotted for the thermal neutron-induced fission reaction of 235U, for a given light fragment mass, AL = 96. The experimental data are by Göök et al. [23] and the calculated points were obtained using the CGMF code. The correct representation of this mass-dependent angular distribution can only be obtained if the proper excitation energy, kinetic energy, and nuclear structure of the fragments are relatively well reproduced in the calculations. For instance, placing too much energy in the heavy fragment compared to the light fragment would have tilted this distribution toward large angles. An anisotropy parameter, which aims at accounting for the anisotropic emission of the prompt neutrons in the center-of-mass of the fragments due to their angular momentum, is often used in modern Madland-Nix model calculations [24] to better account for the low-energy tail of the PFNS. However, no angular distribution of the prompt neutrons can be inferred from such calculations and therefore this parameter is only constrained by the agreement between the calculated and experimental PFNS. CGMF-type calculations can better address this type of questions by calculating consistently the angular distributions of the prompt neutrons as well as their energy spectrum.
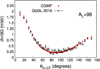 |
Fig. 6 Angular distribution of the prompt fission neutrons vs. the light fragment direction in the thermal neutron-induced fission of 235U, for the pre-neutron emission light fragment mass AL = 96, as calculated using the CGMF Monte Carlo Hauser-Feshbach code [16] and compared to experimental data by Göök et al. [23]. |
2.4 Basic physics constraints
As explained in the previous section, models are imperfect and therefore uncertainty estimates based solely on the variation of their input parameters cannot capture deviations from the model assumptions, therefore leading to underestimated evaluated uncertainties. In some extreme cases, where experimental data exist only very far from the phase space of interest, one is forced to rely on imposing basic physics constraints to avoid non-physical extensions of the models. Examples abound: a PFNS or a cross section cannot be negative; fission yields remain normalized to 2.0, energy balance is conserved, etc. This topic is discussed at length in reference [25]. An interesting application of those principles is in astrophysics, and in particular on the impact that nuclear mass model uncertainties have on the production rate of the elements in the universe through the r-process and fission recycling [26].
2.5 Unknown unknowns
What about those now infamous “unknown unknowns”? It is too often evident that such unrecognized and missing biases and uncertainties exist in reported experimental data, whenever different data sets are discrepant beyond their reported uncertainties. While it is sometimes possible to uncover a missing normalization factor or a neglected source of error, it also often happens that one is left with discrepant data even after careful consideration of sources of uncertainty. Gaussian processes [27] could be used to some extent to account for systematic discrepancies between model calculations and experimental data, possibly revealing model defects. Of course, the very notion of “model defects” relies on accurate experimental data trends.
3 Putting it all together
As mentioned earlier, there are legitimate reasons for the separation of differential and integral information used in the evaluation process of nuclear data. However, it is also obvious that this “strict” separation is often breached for the sake of optimizing the performance of data libraries in the simulation of integral benchmarks. Specific and supposedly well-known integral benchmarks are often used to find a set of correlated quantities, e.g., ( , PFNS, σf) of 239Pu, which leads to the correct prediction of keff of Jezebel. Using this integral information but not incorporating it into the associated covariance matrices is inconsistent at best. However, and because the “adjustment” procedure is done within the estimated one-sigma uncertainties of those nuclear data, this inconsistency is of limited importance. As mentioned earlier, it also means that the evaluated uncertainties propagated through transport simulations lead to uncertainties on integral quantities much larger than the reported experimental uncertainties.
However, and as argued in this paper, this somewhat artificial separation between differential and integral information should be eliminated and that all information available should be used in a comprehensive nuclear data evaluation approach. For that to happen however, and to avoid the classic trap of past “adjusted” libraries that would perform extremely well for benchmarks for which they were adjusted and rather poorly when extrapolated away from their calibration point, one has to be very cautious.
The use of physics-informed deep-learning algorithms is revolutionizing many pans of scientific research from genome exploration to the development of new materials and the discovery of faint objects in the deep sky. The field of nuclear physics is also rich in data, and machine learning techniques could be used to guide our next evaluation efforts. Logistics in terms of organization and formatting of all nuclear data, differential, quasi-differential, semi-integral, integral, have to be developed. The EXFOR experimental database of differential data is an important tool, which could be extended further to make a more efficient use of metadata. The DICE database represents an important step in the same direction for integral benchmarks this time. Powerful machine learning algorithms are now ubiquitous, open-source and free for anyone to use. Our community is not quite prepared to use those modern tools, given the fragmented and limited databases of nuclear data that can be used at this point, but the path is rather clear.
Acknowledgments
The author would like to acknowledge insightful and stimulating discussions with M.B. Chadwick, T. Kawano, D. Neudecker, D.K. Parsons, D. Sigeti, S. Van der Wiel, D. Vaughan, and M.C. White.
References
- E. Bauge, D. Rochman, EPJ Nuclear Sci. Technol. 4, 35 (2018) [CrossRef] [EDP Sciences] [Google Scholar]
- D. Rochman, E. Bauge, A. Vasiliev, H. Ferroukhi, EPJ Nucl. Sci. Technol. 3, 14 (2017) [Google Scholar]
- D. Brown, M.B. Chadwick et al., to appear in Nucl. Data Sheets (2018) [Google Scholar]
- T. Kawano, K.M. Hanson, S. Frankle, P. Talou, M.B. Chadwick, R.C. Little, Nucl. Sci. Eng. 153, 1 (2006) [Google Scholar]
- G. Noguere et al., in Proc. of the Int. Conf. on Nuclear Data for Science & Technology ND2016, Bruges, Belgium, 2016 , EPJ Web Conf. 146, 02036 (2017) [CrossRef] [Google Scholar]
- N. Otuka, E. Dupont et al., Nucl. Data Sheets 120, 272 (2014) and https://www-nds.iaea.org/exfor/exfor.html [CrossRef] [Google Scholar]
- D. Neudecker, P. Talou, T. Kawano et al., to appear in Nucl. Data Sheets (2018) [Google Scholar]
- A. D. Carlson et al., Nucl. Data Sheets 110, 3215 (2009) [CrossRef] [Google Scholar]
- A. D. Carlson et al., to appear in Nucl. Data Sheets (2018) [Google Scholar]
- A. Nouri et al., Nucl. Sci. Eng. 145, 11 (2003) [Google Scholar]
- J.B. Briggs et al., Nucl. Sci. Eng. 145, 1 (2003) [Google Scholar]
- T. N. Taddeucci et al., Nucl. Data Sheets 123, 135 (2015) [Google Scholar]
- A. M. Daskalakis et al., Ann. Nucl. Energy 73, 455 (2014) [CrossRef] [Google Scholar]
- R. Capote et al., Nucl. Data Sheets 131, 1 (2016) [CrossRef] [EDP Sciences] [Google Scholar]
- D. G. Madland, J. R. Nix, Nucl. Sci. Eng. 81, 213 (1982) [CrossRef] [Google Scholar]
- P. Talou, B. Becker, T. Kawano, M. B. Chadwick, Y. Danon, Phys. Rev. C 83, 064612 (2011) [CrossRef] [Google Scholar]
- O. Litaize, O. Serot, L. Bergé, Eur. Phys. J. A. 51, 177 (2015) [Google Scholar]
- K.-H. Schmidt, B. Jurado, C. Amouroux, C. Schmitt, Nucl. Data Sheets 131, 107 (2016) [CrossRef] [Google Scholar]
- N. Kornilov, Fission Neutrons: Experiments, Evaluation, Modeling and Open Problems (Springer, NY, USA, 2015) [Google Scholar]
- B. Morillon, P. Romain, private communication [Google Scholar]
- J.P. Lestone, Nucl. Data Sheets 131, 357 (2016) [CrossRef] [Google Scholar]
- K. Meierbachtol, F. Tovesson, D.L. Duke, V. Geppert-Kleinrath, B. Manning, R. Meharchand, S. Mosby, D. Shields, Phys. Rev. C 94, 034611 (2016) [CrossRef] [Google Scholar]
- A. Göök, W. Geerts, F.-J. Hambsch, S. Oberstedt, M. Vidali, S. Zeynalov, Nucl. Instrum. Method Phys. Res. A 830, 366 (2016) [Google Scholar]
- D. Neudecker, P. Talou, T. Kawano, D.L. Smith, R. Capote, M.E. Rising, A.C. Kahler, Nucl. Instrum. Method Phys. Res. A 791, 80 (2015) [CrossRef] [Google Scholar]
- D.E. Vaughan, D.L. Preston, Los Alamos Technical Report LA-UR-14-20441, 2014 [Google Scholar]
- M. Mumpower, G.C. McLaughlin, R. Surman, A.W. Steiner, J. Phys. G 44, 034003 (2017) [Google Scholar]
- C.E. Rasmussen, C.K.I. Williams, Gaussian Processes for Machine Learning (The MIT Press, Cambridge, MA, USA, 2006) [Google Scholar]
Cite this article as: Patrick Talou, Evaluating nuclear data and their uncertainties, EPJ Nuclear Sci. Technol. 4, 29 (2018)
All Figures
|
Fig. 1 The ENDF/B-VIII.0 evaluated 239Pu(n, 2n) cross section and one-sigma uncertainty band are shown in comparison with several experimental data sets. |
| In the text | |
|
Fig. 2 The Jezebel 239Pu critical assembly shown above is widely used by nuclear data evaluators to constrain their evaluations of neutron-induced reactions on 239Pu, creating hidden correlations between different quantities such as |
| In the text | |
|
Fig. 3 Basic benchmarks used in the validation of the ENDF/B-VIII.0 library [3]. Overall the ENDF/B-VIII.0 library (in red) performs even better than the ENDF/B-VII.1 (in green) for this particular suite of integral benchmarks. |
| In the text | |
|
Fig. 4 The correlation matrix evaluated for 239Pu (n, γ) in ENDF/B-VII.1 shows two uncorrelated blocks for two energy regions, meeting at 2.5 keV, the upper limit of the unresolved resonance range. |
| In the text | |
|
Fig. 5 Correlation matrix across four (4) different experimental data sets for the thermal neutron-induced prompt fission neutron spectrum of 235U. Correlations across different experiments are clearly visible below about N = 350 points. Figure taken from Neudecker et al. [7]. |
| In the text | |
|
Fig. 6 Angular distribution of the prompt fission neutrons vs. the light fragment direction in the thermal neutron-induced fission of 235U, for the pre-neutron emission light fragment mass AL = 96, as calculated using the CGMF Monte Carlo Hauser-Feshbach code [16] and compared to experimental data by Göök et al. [23]. |
| In the text | |
Current usage metrics show cumulative count of Article Views (full-text article views including HTML views, PDF and ePub downloads, according to the available data) and Abstracts Views on Vision4Press platform.
Data correspond to usage on the plateform after 2015. The current usage metrics is available 48-96 hours after online publication and is updated daily on week days.
Initial download of the metrics may take a while.