Open Access
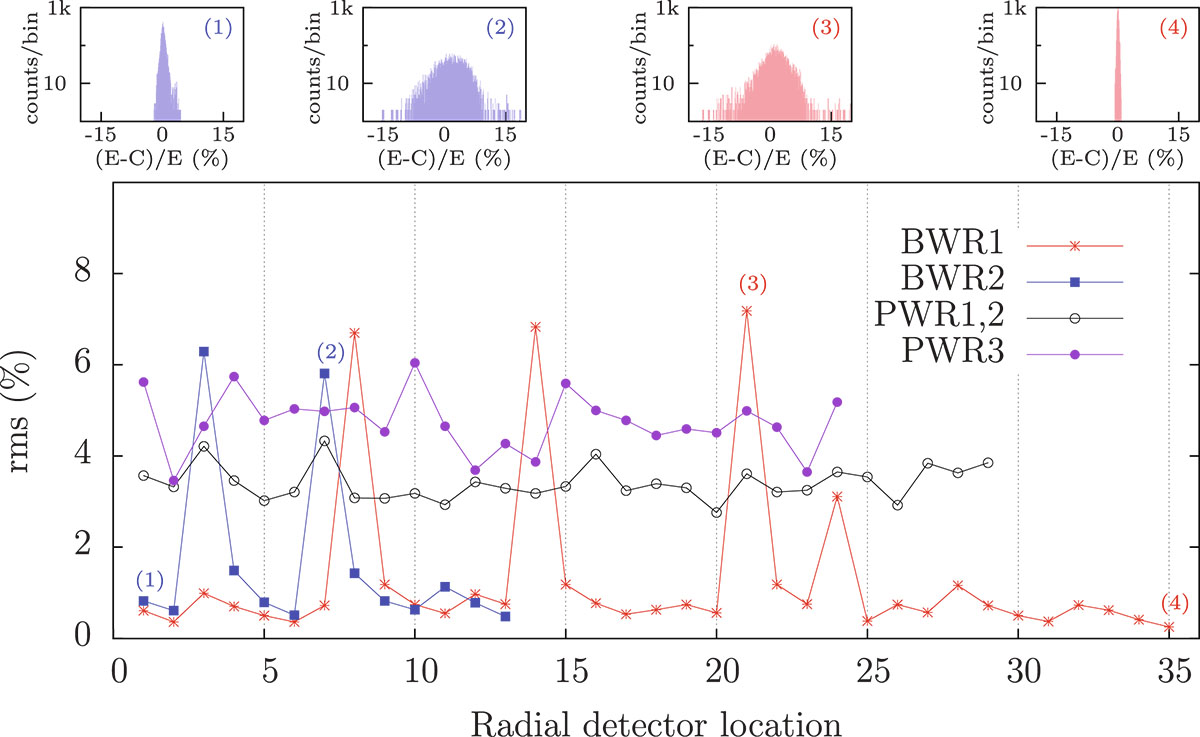
Fig. 6.
Download original image
Bottom: same as Figure 5 but a function of the radial position of detectors. Top inserts: the four figures correspond to the labels (1) to (4) given in the bottom figure.
Current usage metrics show cumulative count of Article Views (full-text article views including HTML views, PDF and ePub downloads, according to the available data) and Abstracts Views on Vision4Press platform.
Data correspond to usage on the plateform after 2015. The current usage metrics is available 48-96 hours after online publication and is updated daily on week days.
Initial download of the metrics may take a while.