Open Access
Fig. 12.
Download original image
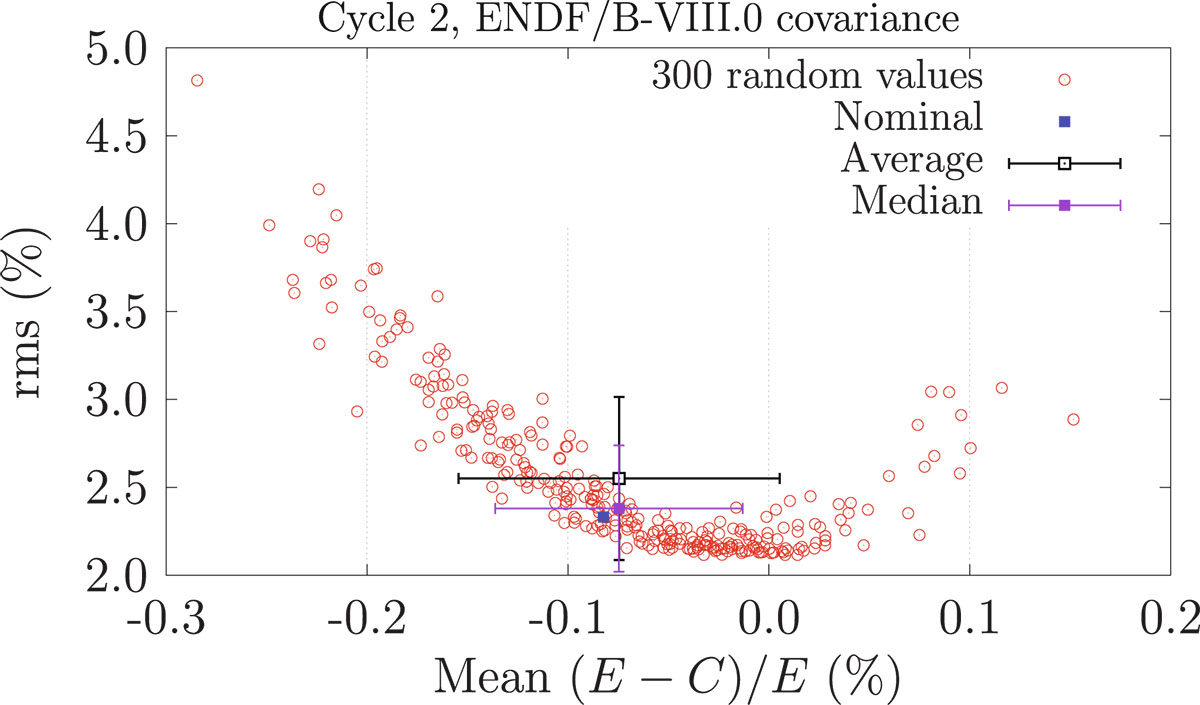
Example for the Cycle 2 and the ENDF/B-VIII.0 covariance with the 300 calculated mean (E − C)/E and rms. Note that the distribution is strongly skewed. The uncertainties on the average correspond to the standard deviation, while for the median, the median average deviation (or MAD) is used.
Current usage metrics show cumulative count of Article Views (full-text article views including HTML views, PDF and ePub downloads, according to the available data) and Abstracts Views on Vision4Press platform.
Data correspond to usage on the plateform after 2015. The current usage metrics is available 48-96 hours after online publication and is updated daily on week days.
Initial download of the metrics may take a while.