Open Access
Fig. 1.
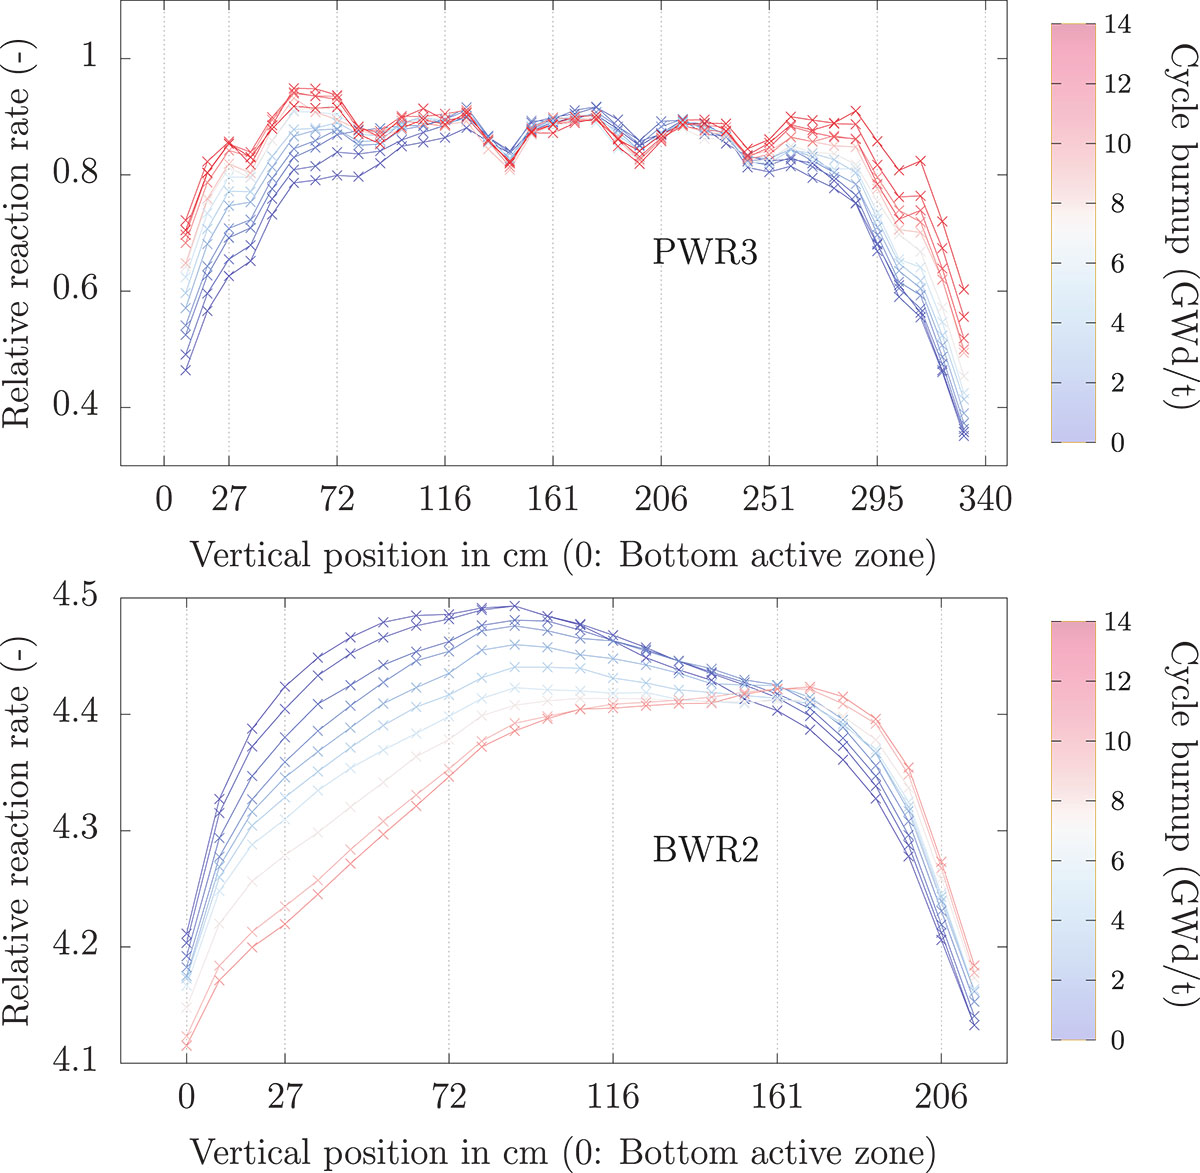
Download original image
Examples of relative measured reaction rates for the PWR3 and BWR2, at the same radial positions and for various vertical elevation (or axial position), in a specific cycle, for different cycle core burnup. Colors indicate the core burnup values.
Current usage metrics show cumulative count of Article Views (full-text article views including HTML views, PDF and ePub downloads, according to the available data) and Abstracts Views on Vision4Press platform.
Data correspond to usage on the plateform after 2015. The current usage metrics is available 48-96 hours after online publication and is updated daily on week days.
Initial download of the metrics may take a while.