


| Issue |
EPJ Nuclear Sci. Technol.
Volume 12, 2026
|
|
|---|---|---|
| Article Number | 17 | |
| Number of page(s) | 16 | |
| DOI | https://doi.org/10.1051/epjn/2026008 | |
| Published online | 12 June 2026 | |
https://doi.org/10.1051/epjn/2026008
Regular Article
Experimental uncertainty quantification using templates of expected measurement uncertainties for fast neutron-induced total, capture, and scattering cross sections
Los Alamos National Laboratory, Los Alamos, NM, USA
* e-mail: This email address is being protected from spambots. You need JavaScript enabled to view it.
Received:
27
August
2025
Received in final form:
24
December
2025
Accepted:
17
April
2026
Published online: 12 June 2026
Abstract
Careful experimental uncertainty quantification (UQ) is key for developing trustworthy evaluated nuclear data. Templates to account for missing or under-reported experimental uncertainties were recently developed by the covariance committee of Cross Section Evaluation Working Group (CSEWG). In this work, we illustrate the practical application and limitations of these templates for selected neutron-induced reactions, including (n, tot), (n, γ), and (n, xn) in the fast energy range, to illustrate their use in data analyses for nuclear data evaluations. We show that while the templates provide consistent framework, proper implementation still requires detailed knowledge of experimental conditions and careful treatment of nonlinear effects in cross section derivation. Case studies highlight how template-assisted UQ improves consistency with previous evaluations such as ENDF/B and reveals open challenges in propagating uncertainties across different energy regimes. The main contribution of this paper is to connect formal template recommendations with their use in practical evaluation workflows, clarifying both their benefits and current limitations.
© A. Khatiwada et al., Published by EDP Sciences, 2026
 This is an Open Access article distributed under the terms of the Creative Commons Attribution License (https://creativecommons.org/licenses/by/4.0), which permits unrestricted use, distribution, and reproduction in any medium, provided the original work is properly cited.
1. Introduction
In the last few decades, there have been significant efforts worldwide in the nuclear data community to provide trustworthy covariance matrices associated with evaluated nuclear data to the users [1, 2]. Since the accuracy and precision of the evaluated nuclear data are dependent on the input experimental data and their associated covariance matrices, proper quantification of the uncertainties and covariances is imperative. These covariance matrices not only provide bounds to the values of the evaluated data, but also provide weights to the individual datasets that influence the evaluation. Missing or under reported uncertainties could provide false confidence in the experimental data, and mis-characterization of the experimental correlation could lead to inaccurate evaluation [3]. As a part of such an effort to provide reliable nuclear data, the covariance committee of CSEWG (Cross Section Evaluation Working Group), a collaboration that releases the U.S. ENDF/B nuclear data libraries, has published templates [4] of expected uncertainties and correlations in measured quantities for neutron-induced total cross sections [5], neutron-induced capture and charged-particle cross sections [6],  reaction cross sections [7], prompt fission neutron spectra (PFNS) [8], and average prompt and total fission neutron multiplicities [9]. The templates serve to provide recommendations for experimentalists to report all pertinent uncertainties and for data evaluators to estimate missing uncertainty sources.
Although these recommended templates serve as a good starting point and guideline for experimental uncertainty quantification (UQ), the process of curating experimental data, in practice, is strongly dependent on the quality of the experimental information supplied by the experimentalists. The use of these templates alone does not guarantee proper treatment of the uncertainties in the absence of basic understanding of the experimental setup, measurement type, underlying physics, uncertainty sources, sensitivities associated with those uncertainty sources, whether or not the assumptions made in the template recommendations are applicable for a specific scenario, etc. For example, the templates for total cross section measurements provide uncertainty recommendations with respect to the uncertainty source parameters as opposed to the total cross section; therefore, an additional step is required to propagate the individual sources of uncertainties to the observable of interest. The non-linear relationship between the derived total cross section with the measured transmission data and sources of error poses an additional complication in the propagation of error in the absence of adequate information about the experimental setup/sample.
Another example requiring careful attention to the assumptions in template-based uncertainty recommendations is the propagation of energy resolution uncertainty from measurements to cross sections. Cross sections exhibit distinct behavior across energy regimes: smooth variation in the fast region, rapid fluctuations in the resolved resonance region (RRR), and broader and statistically averaged fluctuations in the unresolved resonance region (URR). These regions are not defined by fixed energy boundaries and vary by isotope due to differences in nuclear structure and level density. Evaluated nuclear data libraries often combine cross sections modeled using fundamentally different theoretical approaches in each regime: for example, R-matrix formalism in the RRR [10, 11] and Hauser-Feshbach statistical models [12–14] in the fast region. Consequently, experimental datasets that span multiple regimes may involve correlations across physically and theoretically distinct regions. Currently, no standard method exists to consistently propagate uncertainties or correlations across these regimes, making such treatments evaluator-dependent and sensitive to methodological choices [15].
While previous work have demonstrated the impact of applying templates for experimental UQ of fission observables [4, 16], specific examples have not yet been shown for  ,
,  and
and  cross sections, which is the focus of this paper. We examine the applicability, limitations, and open questions surrounding the template-based UQ in nuclear data, supported by selected examples. These include detailed discussion of the sensitivities in connection to the propagation of template recommended uncertainties for
  cross section, an illustration of template-assisted UQ using
 experimental data, a demonstration of potential issues when applying templates to data in the EXFOR database [17] using
 experimental data, and a discussion on energy resolution effects and correlation treatment across energy ranges using using
 data. The structure of the paper is as follows. Section 2 outlines the observables, template recommendations, and associated uncertainties; Section 3 details the methodology; Section 4 presents example applications and discussion; and Section 5 provides conclusion. Additionally, Appendix contains lists of historical datasets on which experimental UQ was performed, following guidelines outlined in the templates.
2. Observables and uncertainty characterization
2.1. Total cross section
Experiments providing total cross sections are typically derived from transmission measurements by measuring the attenuation of neutrons through a sample of known properties [18]. The intensity, I, of the neutron beam follows the exponential attenuation law,
 (1)
(1)
where, I 0 is the original/un-attenuated beam intensity, σ tot is the total cross section, and n is the target areal mass density expressed in the units of atoms/barns. The transmission, T th, as a function of incident neutron energy is given by,
 (2)
(2)
T is equation 1 for attenuated neutron beam through the sample to the un-attenuated neutron beam in a separate sample-out measurement. Transmission as a function of time t measured as;
 (3)
(3)
where, N is the flux-normalization factor, C is the signal count, and B is the background correction. Subscripts in and out refer to the measured quantities in sample-in and sample-out measurements. The experimental and theoretical transmissions are related through additional corrections, such as the facility response function.
2.1.1. Uncertainty sources and template recommendations
The template for  in reference [5] provides uncertainty recommendations for the following sources: (a) δn arising from the determination of the target areal mass density, (b) δN from the normalization of the neutron flux (not relevant for monoenergetic measurements), and (c) δB from various contributions to the background. The recommended type of correlation for (a)–(c) are fully-positive correlation. The template breaks down the background uncertainty in various components depending on whether it is a time of flight (TOF) or a monoenergetic measurement. In practice, however, background uncertainty values are seldom reported separately for different sources. δB is very rarely broken into a time dependent and a time independent component; but if this is the case, the time-dependent component is recommended to be best characterized by a Gaussian correlation matrix. Additionally, (d) δF uncertainty related to optional self-shielding [19] correction, (e) δc uncertainty related to the neutron counts (which are measured separately for sample-in and -out scenarios in Eq. (3)), and (f) δE uncertainty related to the incoming neutron energy determination or resolution are also recommended. Since differential cross sections are often measured as a function of incoming neutron energy, accurate knowledge of the neutron energy is critical for proper interpretation of experimental results. Neutron energy is typically determined using time-of-flight or reaction kinematics, both of which introduce energy-dependent uncertainties. Although the values for δE are not provided in the templates due to the expected large variability from one experiment to another, if adequate information on the facility and experiment are provided, this can be supplemented with expert judgment. The recommended correlation for these (d)–(f) sources are fully correlated, uncorrelated, and strong Gaussian correlation, respectively.
2.1.2. Sensitivities
To properly propagate uncertainties from each individual source to the final observable, the sensitivity of the cross section to the uncertainty component must be applied at both correlated energy points. The sensitivity coefficient, S k, σ tot , quantifies the fractional change in the reported total uncertainty σ tot due to a fractional change in the uncertainty contribution from source k, and is defined as,
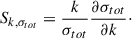 (4)
(4)
This first-order sensitivity treatment linearizes the relationship between the derived cross section and the underlying experimental parameters. In the fast-neutron region, where cross sections vary smoothly and the experimental resolution function is narrow relative to the energy scale of variation, this linear approximation is sufficient. In regions with strong resonances or significant Doppler broadening, the mapping between measured quantities and derived cross sections becomes highly nonlinear, and a full forward model, including convolution with the instrument resolution function, would be required before computing sensitivities.
Accordingly, the covariance matrix element between E i and E j becomes,
 (5)
(5)
 (6)
(6)
 (7)
(7)
where, Cor(E
i
, E
j
)
k, σ
tot
is the corresponding element in the correlation matrix and δk is the uncertainty associated with the parameter k. For simplicity, the uncertainty and sensitivity terms can be combined into a quantity represented as  . Based on equation (3), the sensitivities for n and N are 1 and 1/(nσ
tot
) respectively. The uncertainty related to B is often not reported separately for in and out scenarios. In the limit where the background to the total yield ratio is small, the sensitivity related to B approaches X/(nσ
tot
), where X is background fraction, defined as the ratio of background counts to the total measured counts. During the experimental UQ, the partial uncertainties
. Based on equation (3), the sensitivities for n and N are 1 and 1/(nσ
tot
) respectively. The uncertainty related to B is often not reported separately for in and out scenarios. In the limit where the background to the total yield ratio is small, the sensitivity related to B approaches X/(nσ
tot
), where X is background fraction, defined as the ratio of background counts to the total measured counts. During the experimental UQ, the partial uncertainties  and
and  can be combined with their sensitivities as,
 (8)
(8)
and
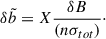 (9)
(9)
 and
and  can be applied to the respective correlation matrices to obtain the corresponding covariance matrices as with other partial uncertainties as shown in equation (7). Note that the computation of
  and
and  requires information about the sample areal mass density. Computation of
  from equation (9) also requires further information on the magnitude of background.
2.2. Capture and elastic cross section
Although the experimental details of capture [6] and elastic cross sections [7] are quite distinct, from the point of view of application of the recommended uncertainties, there are some common relevant features between these two types of measurements. As with  measurements, these cross sections can be measured with white or mono-energetic neutron sources. However, unlike in the
  measurements, the measured quantities, i.e., experimental counts/yields, are linearly related to the observables of interest, i.e., the
  and
and  cross sections. In case of capture cross sections, the measured yields are photon yields, while in case of
  measurements, the measured quantity is yield of scattered neutrons at a particular angle. In both cases, various kinds of normalization factors, such as flux-normalization (N), background corrections (B), efficiency corrections (ε) and self-shielding normalization (F), may be relevant, all of which are independent variables that relate to the cross section in a multiplicative (or additive) way. A generic form of equation for measured
  or
or  cross section, σ(n, z), is of the form,
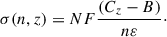 (10)
(10)
Here, z represents the outgoing particle, which is photon for  and a neutron for
  cross section measurements. The total cross section uncertainty can be estimated by combining the individual contributions from each variable, typically using relative uncertainties. Because of the linear structure of the measurement equation, this process does not require computation of sensitivities. As a result, uncertainties reported in the literature or the ones recommended in the templates can be applied directly to the correlation matrix as,
 (11)
(11)
where the variables have a similar definition as in equation (7).
The elastic cross section measurement is done relative to well-known monitor/reference reactions. The capture cross section can be either an “absolute” measurement or “ratio”. Monitor/reference reactions may be used to monitor the neutron flux or to calibrate the efficiency of the experiment, where systematics due to many uncertainty sources cancel out or are simplified. In the former scenario, the monitor reaction that was used for flux-normalization is noted. However, in the latter case where the final observable is a ratio with a well-known cross section, we characterize those measurements as “absolute ratio” instead of “absolute” [16]. In the absolute ratio case, when evaluating the uncertainty of the cross section quantity, the uncertainty in the cross section of the monitor reaction needs to be propagated accordingly. Depending on what observable is reported by the experimentalists, uncertainties from monitor reactions may have already been propagated to the total uncertainty. In the example cases provided in this paper, we use latest ENDF/B-VIII.0 evaluations for monitor cross section, and, hence, substitute the experimentalists’ provided uncertainties for this source with the covariance information from ENDF files, as recommended in the template. To do so, if it is indicated that the reference cross section uncertainty is included in the total uncertainty reported in the EXFOR, we first assume that the total uncertainty includes this partial uncertainty added in quadrature and subtract it out from rest of the reported uncertainties. In some cases, even if the measurement was a “ratio” measurement, information on the reference reaction may not be available. In such case, the dataset is treated as “absolute” data.
The template recommended sources of uncertainty common for both capture [6] and elastic [7] are (a) δB, (b) δN, (c) δw, (d) δE, and (e) δc, related to the background contribution, flux-normalization, target areal density determination, sample composition, incoming neutron energy determination, and counting, respectively. Capture cross section has additional uncertainty recommendation for (f) δn related to the target areal mass density determination. Additional partial uncertainties (g) δg, (h) δa, (i) δε
n
, and (j) δy
e
are recommended for  cross section. These additional uncertainties are related to geometric effects, flux attenuation and multiple scattering, neutron detection efficiency, and yield extraction, respectively. Furthermore, for ratio measurements, (k) δR uncertainty associated to the reference reaction needs to be propagated to the total cross section uncertainty. If self-shielding effects are notable, (l) δF may also be specified. The suggested correlation matrix are fully positive correlation associated with δw, δg, and Gaussian for δa, δε
n
, δy
e
and δF. All the other uncertainty sources defined earlier for
cross section. These additional uncertainties are related to geometric effects, flux attenuation and multiple scattering, neutron detection efficiency, and yield extraction, respectively. Furthermore, for ratio measurements, (k) δR uncertainty associated to the reference reaction needs to be propagated to the total cross section uncertainty. If self-shielding effects are notable, (l) δF may also be specified. The suggested correlation matrix are fully positive correlation associated with δw, δg, and Gaussian for δa, δε
n
, δy
e
and δF. All the other uncertainty sources defined earlier for  have similar recommended correlation matrices associated with them. The covariance matrix for reference cross section is obtained from the evaluated nuclear data files similar to the mean values.
3. Methodology
We implemented the following general methodology for the UQ of the dataset provided in this paper. This can serve as a guideline for the steps to be followed by an evaluator to generate experimental covariances of the reactions discussed herein. All the work presented in this paper utilized a Python tool called ARIADNE [20], developed to provide evaluators with a consistent method for estimating detailed uncertainties and covariances in experimental data. It was originally designed for the UQ of Prompt Fission Neutron Spectra (PFNS) in the fast energy region, where cross sections exhibit relatively smooth behavior and the overall impact of effects such as Doppler broadening and detailed resolution-function folding is modest. These effects are, however, discussed in the context of total cross section measurements, where they enter the derivation of cross sections through the model connecting measured transmission data to the theoretical quantity. While the present work references such effects to maintain completeness, it does not explicitly model them, as their influence on the observables examined here is small in the fast-energy regime. The methodology has since been extended to additional observables and applied in the intermediate-energy region to explore its broader applicability. In that region, some of the simplifying assumptions used in the fast range, particularly those related to resolution treatment and cross-region correlations, become less accurate. The corresponding challenges are discussed in later sections. The current results therefore represent validated applications of the templates and propagation methods in the fast-energy region, along with a preliminary assessment of their limitations when extended toward intermediate energies.
3.1. Preparation of input data
As indicated in earlier sections, applying template-based uncertainty and correlation methods requires detailed knowledge of the experimental data, including hardware configuration, measurement methodology, applied corrections, and bibliographic references. In this work, the experimental UQ process began with a systematic review of the available data and supporting sources to identify the information necessary for constructing covariance matrices. This documentation step also ensured that corrections could be applied at a later time when required.
Often, additional sources of uncertainty not included in EXFOR entries were identified in the original publications or associated documentation. A common issue was that the total uncertainties listed in EXFOR did not match those reported in the literature, even when the authors provided a detailed breakdown of uncertainty components. The 
 measurement from reference [21] is one such example. In this case, the EXFOR total uncertainty column reports values that range from approximately 1.25–2.5%, while the statistical uncertainties alone ranged from about 0.5–2.1%. The accompanying documentation further identified uncertainty contributions associated with sample properties, deadtime corrections, and self-shielding. When these documented contributions are combined in quadrature with the statistical uncertainties, the resulting total uncertainties are consistently larger across the incident-energy range. Figure 1 illustrates the impact of this conservative treatment by comparing the EXFOR-reported total uncertainties with those obtained by augmenting the statistical component using the documented systematic effects, as well as with totals derived from a more comprehensive UQ guided by the template recommendations. The latter treatment additionally incorporates effects such as flux normalization (1.2–2.5%) and energy uncertainty (0–3%), leading to visibly larger uncertainty estimates. These discrepancies suggest that certain systematic components documented by the experimentalist may not be fully reflected in EXFOR’s total uncertainty column. When the EXFOR entry lacked a clear breakdown of included uncertainty components (e.g., statistical, normalization, background), we incorporated additional systematic uncertainties based on published documentation. In such cases, a practical approach, albeit conservative, was to treat the EXFOR value as representing primarily counting uncertainty unless otherwise indicated. This enabled consistency with the more complete uncertainty descriptions available in the original sources.
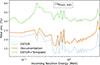 |
Fig. 1. Total uncertainties for 239Pu(n, tot) data from reference [21], shown using three treatments: EXFOR-reported total uncertainties (blue dots), combined uncertainties obtained by adding EXFOR statistical values and documented systematic uncertainties in quadrature (orange solid line), and total uncertainties derived from a comprehensive uncertainty quantification process aided with template recommendations (green dashed line). |
This issue was not limited to a single dataset. Among the 25 datasets analyzed in this work (see Appendix), 6 reported only statistical uncertainties. Of the remaining 19 that provide systematic uncertainties, only 10 provide relatively comprehensive information on the sources of these uncertainties and information on how they are reported. For instance, EXFOR entry 10280.007 for Schmidt et al. data [22] provided several partial uncertainties, yet the total reported value was smaller than the quadrature sum of even a few of them–again suggesting that only statistical uncertainty was included. A similar pattern was seen in Foster et al. data [23], where detailed breakdowns in the original publication did not appear in the EXFOR totals.
Accordingly, the data presented in the Appendix include both partial uncertainties derived using templates and any additional components drawn from literature that were not explicitly included in EXFOR. This approach ensured that database entries were consistent with the information available in the original source documentation, even in cases where the uncertainty classifications were ambiguous or incomplete.
During the course of this work, several recurring issues were identified when applying experimental UQ templates to the datasets under study. These issues are summarized below, based on both the information available in the published literature and the specific observations made in this analysis. While some points align with previously documented challenges, others arose directly from implementation in the present study.
-
For all types of measurements, counting or statistical uncertainties were explicitly extracted from the documentation and are a required input.
-
Experimental details on energy uncertainty/resolution, time-of-flight, flight path, and related parameters were noted. When these uncertainties were not explicitly provided, information on the facility and similar experiments in the literature was used to estimate their values.
-
For (n, tot) reactions, when relevant uncertainties were not reported directly, template-based estimates for partial uncertainties related to N and B were applied using the sensitivities documented in Section 2.1.2.
-
In the case of (n, γ) and (n, xn) reactions, information was recorded to determine whether the measurement was “absolute” or “ratio.” For ratio measurements, if the reported observable was a cross section, the reference evaluation used to derive the cross section was documented.
-
Experimental publications and EXFOR entries very rarely provided explicit correlation information. When such information was available, it sometimes differed from the default assumptions in the templates due to experiment-specific effects. For example, in the Foster et al. [23] (n, tot) dataset, the authors reported a covariance matrix for the counting statistics arising from zero-time resolution. This leads to event migration between neighboring incident-energy bins, producing correlated statistical fluctuations. As a result, adjacent energy bins are positively correlated, while correlations at larger separations are weaker and may change sign due to compensating migration effects. By contrast, the template’s default treatment considers counting uncertainties to be uncorrelated between energy bins. In this work, the origin of this discrepancy was examined and, to remain consistent with the measurement, the correlation matrix terms in Figure 2, derived from reported covariance, were used for the counting component, with the total covariance construction adjusted accordingly.
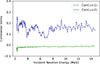 |
Fig. 2. Correlation terms associated with the counting uncertainty for the Foster et al. |

3.2. Evaluator considerations in data use
At LANL, internal databases of experimental data with detailed uncertainty quantification (UQ) were developed to support evaluation efforts, with a focus on  and
and  . The examples presented here are drawn from those efforts. For the
 evaluation, no prior covariance data were available, so a set of experimental datasets was assembled and categorized based on the completeness of their uncertainty information. Some
  measurements, such as those by Brandenberger1975 [24], Cabe1972 [25], and Towle1965 [26], only reported statistical uncertainties (e.g., counting errors) and, in some cases, energy resolution. These datasets lacked detailed treatment of systematic effects such as detector efficiency, background subtraction, and normalization. However, since the experimental setup was sufficiently described, we applied the recommended
  templates to estimate missing systematic uncertainties. These datasets were included in the evaluation but classified as “low fidelity” due to their limited direct uncertainty reporting. This reflects a broader challenge in evaluation work, where many historical datasets lack detailed uncertainty breakdowns and must nevertheless be utilized because of the limited availability of higher-fidelity data. In contrast, high-confidence datasets, such as Schmidt1996 [22] and Harith1976 [27], provided comprehensive uncertainty breakdowns, including both statistical and systematic components.
Despite including datasets with incomplete information, applying the template-based uncertainty quantification process allowed for the construction of more realistic covariance matrices. This approach led to evaluated cross sections with meaningful uncertainty structure and correlated behavior across energy bins. In fact, correlations introduced by propagating experimental uncertainties influenced neighboring reaction channels and energy regions, improving the physical consistency of the evaluation even where direct uncertainty data were not available [28].
In contrast,  cross section datasets required more detailed knowledge of the experimental setup, particularly the sample’s areal density n, to accurately estimate certain uncertainties. Unlike reaction channels like
  , where the measured yield is directly proportional to the cross section, transmission measurements involve an exponential relationship. As a result, the sensitivity to uncertainties in flux normalization and background subtraction is non-linear (non-unitary), and the impact of missing or inaccurate information on n can be substantial. Since sample thickness varies widely depending on the target energy range, uncertainty estimates in
  measurements can differ by orders of magnitude without detailed sample information. Therefore, template-based estimates were not applied when this critical information is missing. As an example, the EXFOR documentation for Smith1973 [29] data does not clearly indicate if the data provided correspond to the sample with a thickness of 1.8 cm or that with 2.0 cm, both of which were used in the experiment. When the template-recommended uncertainty of 4.0% relative to the flux-normalization value is propagated to the cross section, the mere 2 mm difference in sample thickness leads to relative percentage difference of about 10% in the uncertainty value, as shown in Figure 3.
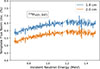 |
Fig. 3. Template recommended uncertainty of 4% on the flux-normalization, when propagated to the Smith1973 (n, tot) cross section data, and accounting for the associated sensitivities, results in different values for flux-normalization uncertainties at different sample thicknesses. |
3.3. Application of template
If it was determined that the provided uncertainties and associated experimental details, such as sample properties, applied corrections, and measurement conditions, were sufficient to apply the templates, missing uncertainties were supplemented from the templates. Where applicable, sensitivities were used to propagate the recommended uncertainties for each source to the final observable of interest. For e.g., in the Foster1971 data, the sample thickness was given as 1.8 in the units of mean free path. The sensitivity associated with δN was then 1/1.8. However, in most scenarios, the sample thickness was provided either in the units of atoms/b or in other units that required conversion to atoms/b before being multiplied by the cross section in the units of b.
In the fast region, evaluations are typically performed on effective cross sections rather than on pointwise, instrument-resolution-corrected values. Experimental measurements are each reported on different and often nonuniform energy grids, reflecting the specific detector setup, resolution, and binning choices used in each experiment. As a result, horizontal (energy) uncertainty becomes an intrinsic component of the evaluation problem: each data point represents an effective value over a finite energy interval whose width is determined by the experimental TOF resolution, the analysis procedure, or the grid structure of the underlying model. The most rigorous treatment of TOF resolution represents the measured cross section, σ meas , at energy E 0 as a convolution,
 (12)
(12)
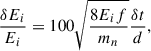
where R E is the energy-resolution function obtained from the timing response R t through the nonlinear mapping E = 1/2m n (d/t)2, d is the flight path, m n is the neutron mass, and t is the measured time-of-flight. In practice, however, detailed timing-response functions are rarely available for fast neutron measurements, and experiments instead report a single timing resolution δt or an effective energy “resolution” δE. Under the usual fast-region assumption that δt is small and σ(E) varies slowly, one can approximate the finite resolution by a first-order uncertainty in the mean reconstructed energy,
 (13)
(13)
leading to,
 (14)
(14)
where, f = 1.6021 × 10⁻¹³ is an energy conversion factor from the units of MeV to Joules, and m n is in units of kg. It should be noted that the timing resolution is energy dependent and arises from several experiment-specific contributions whose relative importance varies across the neutron energy range. Typically, the quantities that affect neutron time-of-flight resolution are the characteristics of the neutron source, such as the pulse width for pulsed sources, characteristics of the neutron moderators, and the timing resolution of the detector system, and δt is commonly approximated as the quadrature sum of these components,
 (15)
(15)
where δt pulse relates to the timing resolution of the source pulse width, δt moderator is the term related to moderator time spread, and δt detector is the detector timing resolution. At thermal energies, neutron flight times are long, but moderator time spread becomes dominant. At resonance regions, both the moderator response and source pulse width become substantial. While at fast energies, as the neutron flight time becomes short, the detector timing resolution becomes dominant.
Given these various contributions to the time-of-flight resolution, experiments in the fast-neutron region rarely report the full timing-response function or the corresponding energy-resolution kernel. Instead, most datasets provide only an effective timing width or an estimated uncertainty in the reconstructed energy of each point. In the absence of a reported resolution function, and because fast region cross sections vary smoothly with energy, it is common practice to treat the finite timing resolution as an uncertainty in the mean neutron energy rather than perform an explicit resolution convolution, or even ignore the contribution of these effects in the total uncertainty. For e.g., in the code GMApy [30] underlying the Neutron Data Standards evaluation [31], although one can provide both energy uncertainty (termed “energy error”) and energy resolution in dedicated columns as described in reference [32], no use of these provided data is made for the actual uncertainty estimate of total uncertainties. Approximating instrumental resolution as an uncertainty in the mean energy neglects the curvature-induced bias term 1/2σ′′(E 0)< (ΔE)2> , which is typically modest, but may not be negligible in all cases. This present work adopts this standard approximation, while the corresponding biases and their dependence on energy regime are examined in detail in a forthcoming study by the authors and collaborators, which extends the present methodology to intermediate energies, where the effects are expected to be more pronounced.
Upon the identification of all partial uncertainty sources k, correlation matrices associated with each uncertainty source were constructed. Separate Python classes in ARIADNE were used for constructing the covariance suitable for each observable and types of associated correlation matrices. Here, three major types of correlation matrices were considered: (1) Diagonal, (2) fully positively correlated, and (3) Gaussian-correlated. The correlation matrices for Diagonal have 0 for the cross-correlation terms and 1 for the diagonal terms, while fully positively correlated matrices have unitary correlation coefficient terms everywhere. The Gaussian-correlated matrix was constructed such that the correlation decreases exponentially with squared distance between the energy groups, and larger values of mean energy values in bin i or j, E i or E j , lead to stronger correlations over the same distance compared to the smaller values. The correlation Cor(E i , E j ) between E i and E j is mathematically given by,
 (16)
(16)
for Diagonal correlation;
 (17)
(17)
for fully positive correlation; and
![Mathematical equation: $$ \begin{aligned} Cor(E_i, E_j) = \exp \left[ - \left( \frac{E_i - E_j}{\max (E_i, E_j)} \right)^2 \right] \end{aligned} $$](/articles/epjn/full_html/2026/01/epjn20250060/epjn20250060-eq70.gif) (18)
(18)
for Gaussian correlation. Once the correlation matrices were constructed for all the sources of uncertainties and their partial uncertainties were known, this information was used to construct the relevant covariance matrix for uncertainty source k using equation (11). The total covariance matrix was obtained by summing the individual covariance contributions:
 (19)
(19)
The total uncertainty in the i energy bin, δ i , represents the standard deviation and is given by the square root of the corresponding diagonal element of the covariance matrix,
 (20)
(20)
Finally, all the relevant features, total uncertainty computed, as well as the total covariance matrix were stored in a consistent manner in json formatted files.
4. Examples and discussion
Some examples of experimental UQ using the recommended templates and the problems encountered, as well as the solutions, are presented below. Supplementary details for each example are included in tables in Appendix.
4.1. Schmidt1996
This dataset by Schmidt et al. [22] on 
 cross section does not have any associated documentation other than what is provided in the EXFOR database. This measurement was made in 1996 using the Turnable CV-28 Compact Cyclotron and multi-angle neutron time-of-flight spectrometer at the Physikalisch-Technische Bundesanstalt in Germany. NE213 neutron detectors were used to detect neutrons at different angles as well as for monitoring of the neutron fluence using the
 reaction.
4.1.1. Information for UQ
The information provided in EXFOR entry 22409.008 is rich in experimental uncertainty information, with characterization and quantification of partial uncertainties from major sources. Partial uncertainties related to the detector efficiency, angle determination, monitor, multiple scattering correction, and energy center were available, although not explicitly included in the EXFOR total uncertainty estimate. As noted in Section 3.2, EXFOR often reports total uncertainties without fully accounting for systematic contributions. This is evident in the Schmidt1996 entry where the reported total uncertainty is smaller than the quadrature sum of just a few of the individual components reported. In the absence of additional documentation clarifying this discrepancy, we conservatively interpreted the EXFOR total as reflecting only the statistical component.
To supplement the missing components, we applied the recommended  template. Figure 4 shows the resulting partial uncertainty breakdown.
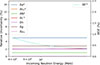 |
Fig. 4. Partial uncertainty for the Schmidt1996 data, with the uncertainties provided in either EXFOR or a separate documentation by authors designated by an asterisk, ‘*’, next to the source. The remaining partial uncertainties are filled in from the templates. Note that the energy uncertainty is relative to the centroid value of the incoming neutron energy bin. |
4.1.2. Impact of results
As shown on Figure 5, detailed UQ of Schmidt1996 dataset for 
 cross section using the template method increased the total uncertainty estimate across the incoming neutron energy range. Without detailed UQ, the experimental data appear to be in disagreement with the ENDF/B-VIII.0 evaluation. However, after thorough experimental UQ, the evaluation curve is closer to the 1σ uncertainty in the experimental data, indicating no significant discrepancy.
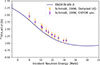 |
Fig. 5. Cross section for Schmidt1996 data as shown with uncertainties reported on EXFOR (purple) and after detailed UQ using templates of expected experimental uncertainties (orange). |
4.2. Schwartz1974
The Schwartz1974 data [33, 34] on 
 cross section measurement were taken by Schwartz et al. in 1974 using an electron linear accelerator at U.S. National Bureau of Standards as a pulsed neutron source. The measurement spanned incoming neutron energy in the range of 0.496–15.17 MeV. A liquid scintillator detector of thickness 12.7 cm and diameter 33.02 cm was used together with a sample of 0.2207 atoms/b thickness.
4.2.1. Information for UQ
The supporting documentation for this dataset has a thorough discussion on information relevant for uncertainty sources, although only  is explicitly stated in the EXFOR.
  is inferred from the documentation. The sample type is unknown; however, most
  samples in the literature have been found to be metallic. The recommended partial uncertainty for a metallic sample is in line with the 1% uncertainty reported in the documentation. Figure 6 shows the provided partial uncertainty values, designated by an “*” after the uncertainty source. These data have a reported total uncertainty of ≈1%, which is contradictory to the observation that simply adding the EXFOR statistical uncertainty and the reported sample uncertainty in quadrature results in larger total uncertainty. Although not uncommon for
  experiments, considering all the sources of the template recommendation, it is expected that the total uncertainty should be at least at the level of 2–3%.
The EXFOR database provides 1680 data points for this measurement. Based on the information in the documentation, the energy resolution/uncertainties below 750 keV have a contribution from effects due to neutron transit time in the scintillator, whereas at higher energies, the main contributor is from neutron time-of-flight uncertainty. This information was utilized to compute the energy uncertainty for the measurement. Although dead-time correction and correction for in-scattering and background are made, they are mentioned to be negligible, and the associated partial uncertainties are not provided. This magnitude of the background/in-scattering correction was utilized to estimate the template recommendation for associated uncertainties. No information was found on beam cycling, which resulted in relatively conservative estimate for  . The partial uncertainties from the templates using information available in the documentation are provided in Figure 6.
4.2.2. Problems encountered
With the information mentioned in Section 4.2.1, the computed energy resolution for the provided dataset is many factors bigger than the binning of this data, particularly at higher energies. Figure 7 shows the estimated bin width given the centroid of adjacent mean neutron energy values in the EXFOR as well as the computed neutron energy resolution. Naturally, any information that is within the energy resolution of the experiment is smeared due to detector effects. Choosing an energy bin width that is smaller than the energy resolution may result in large sensitivity to random fluctuations and sharp features within the bin and also “migration” of counts between adjacent bins. In terms of correlation, this will cause large anti-correlations between the neighboring bins since counts that should have been recorded in bin i, for instance, may be recorded in bin i − 2, i − 1, i, i + 1, i + 2, etc. Therefore, in such a scenario, the simple assumption that the correlation matrix associated with counting uncertainty being diagonal is no longer valid, as was presented for the Foster1971 dataset in Section 3. Indeed, the impact was seen in the adjustment of nuclear data for the PARADIGM (PARallel Approach of Differential and InteGral Measurements) [35] project that is currently being pursued at the Los Alamos National Laboratory (LANL). An example Figure 8 (top) shows the impact of an adjustment using only this data to a theory prior given by the  [12] model. Despite the dataset being statistically consistent with the theory curve, well within its prior uncertainty band, the adjusted evaluation deviates significantly in high energy region. This unexpected behavior arises because the data are finely binned and highly correlated, and in the absence of other constraining datasets in those energy regions, the adjustment algorithm interprets the correlated structure as physically meaningful variation. As a result, the evaluation is pulled away from both the theory and the experimental data. While adding other datasets would likely stabilize the evaluation by providing constraints in broader phase space, isolating this dataset in the adjustment helped reveal a deeper issue: the binning was too fine relative to the resolution and physics content of the measurement, resulting in artificial correlations that dominated the fit.
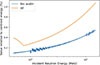 |
Fig. 7. Comparison of the estimated bin width for the incoming neutron energy and the energy uncertainty/resolution, δE, of the measurement. |
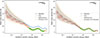 |
Fig. 8. Evaluation of nuclear data using |

4.2.3. Solutions
The problem encountered with the Schwartz1974 dataset prompted further investigation into whether the structure of the dataset itself, such as its fine energy binning, was contributing to the artificial correlations in the covariance matrix. Ideally, one would reconstruct the true distribution from the measured data using detailed resolution unfolding techniques. This class of inverse problems to uncover the underlying true distribution from measurements distorted by finite resolution and acceptance effects has been extensively explored in fields such as image reconstruction, particle physics, and nuclear physics [36–38]. If the resolution function is well known via detailed simulations using MCNP [39] or GEANT [40] and the detector geometry and conditions are well characterized, one can construct a forward model to map true counts to observed counts. This mapping can then be used to infer the true distribution. However, in the absence of this information for this dataset, as is frequently the case for historical measurements, this level of transport-based unfolding could not be undertaken here.
We addressed the problem of too finely binned data in EXFOR entry 10280.007 for 
 in the unresolved resonance region (URR) by grouping adjacent bins in sets of 10, such that the rebinned bin width exceeded the energy resolution of the experiment. Cross sections were averaged and statistical uncertainties recalculated by grouping adjacent energy bins. A simple arithmetic (non-flux-weighted) average was used, as detailed flux information was not available for the original experiment. While total cross sections derived from transmission measurements are nonlinearly related to counts through an exponential relationship, the narrow energy width within each rebinned group justifies this approximation: both the flux and the transmission are assumed to vary slowly enough that a constant-flux and locally linear behavior of the cross section is reasonable. Under this assumption, unweighted averaging introduces minimal bias. This rebinning effectively suppressed spurious experimental correlations arising from oversampling. After rebinning, the covariance matrix was constructed directly on the new energy grid using the rebinned uncertainties and the template-recommended correlation structures. In this way, the influence of the experimental energy resolution is retained through the δE component and its associated correlation model, even though the coarse-bin width exceeds the original instrument resolution. Using these rebinned experimental data and covariances as input for the evaluation produced a more stable and physically consistent posterior evaluated mean value, as shown in the bottom panel of Figure 8.
4.3. Mosby2018
The measurement for Mosby2018 [41] on 
 cross sections was made at the Los Alamos Neutron Science Center (LANSCE) using the “Detector for Advanced Neutron Capture Experiments” (DANCE). This measurement covers an energy range of 0.00106–1.335 MeV. It makes use of BaF
2 scintillators for photon detection, and a Parallel Plate Avalanche Counter (PPAC) detector for characterizing coincident photons from fission events.
cross sections was made at the Los Alamos Neutron Science Center (LANSCE) using the “Detector for Advanced Neutron Capture Experiments” (DANCE). This measurement covers an energy range of 0.00106–1.335 MeV. It makes use of BaF
2 scintillators for photon detection, and a Parallel Plate Avalanche Counter (PPAC) detector for characterizing coincident photons from fission events.
4.3.1. Information for UQ
The EXFOR database for this data includes asymmetric uncertainty on data with origins from PPAC efficiency, scattered background scaling, cross section normalization, reference  cross section, and counting, as detailed in the supporting document from 2014 [42]. Based on the type of the sample, the other missing information on sample related uncertainties, such as
  and
and  are filled in from the templates. Furthermore, the energy uncertainty is estimated using the known pulse shape and flight path information from the DANCE experiment, applying the relevant equation (14).
This is a ratio measurement with respect to the 
 cross section; however, the data provided in EXFOR are already converted into
  cross sections using ENDF/B-VII.1 cross sections for
 . For accurately accounting and propagating the covariance from reference cross section, and to perform the UQ directly on the ratio measurement data, the EXFOR data were converted to ratio data prior to the UQ after direct communication with the author on how the derived cross section values were obtained. Furthermore, the flat uncertainty of 1.0% provided by the authors associated with reference cross section was replaced by full ENDF/B-VIII.0 covariances in order to convert the ratio data to cross section data after the detailed UQ using templates. The uncertainty sources accounted for are provided in Figure 9.
4.3.2. Propagation of energy uncertainty to cross section
As previously mentioned, the UQ is based on ARIADNE code that was originally developed for UQ in the fast energy range. In the fast energy range, the  cross sections show smooth behavior due to overlapping and broadening of resonances. Due in part to this behavior, the experimentally measured cross sections in the i
th energy bin, σ
i
, are average values weighted by the flux as,
cross sections show smooth behavior due to overlapping and broadening of resonances. Due in part to this behavior, the experimentally measured cross sections in the i
th energy bin, σ
i
, are average values weighted by the flux as,
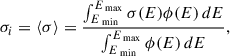 (21)
(21)
where σ(E) is the energy-dependent cross section, ϕ(E) is the neutron flux as a function of energy, E min and E max define the energy range.
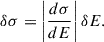
Due to the smoothly varying nature of cross section with respect to energy, the  uncertainty can be propagated to uncertainty in cross section using slope,
  , of the cross section,
 (22)
(22)
The same energy uncertainty propagation procedure is applied to all observables discussed in this paper. The cross section slope with respect to energy, |dσ/dE|, is determined numerically using past ENDF/B evaluations. This slope quantifies how sensitive the observable is to small energy shifts. Where the slope is steep, even a small uncertainty in energy leads to a disproportionately large uncertainty in the cross section, amplifying the effect. This behavior is particularly relevant in regions of rapid cross section variation, such as near resonance structures or thresholds.
4.3.3. Problems encountered
It was observed that the detailed UQ of the Mosby2018 data resulted in uncertainty values that are similar in magnitude to the EXFOR reported values for most energy bins as shown in Figure 10. This is not entirely unexpected since the EXFOR total uncertainty included contributions from systematic sources, along with counting uncertainties. The detailed UQ process was, nevertheless, useful in propagating correlations from experimental sources and to account for the missing uncertainties related to the sample used and energy determination. As indicated in various examples earlier, EXFOR dataset very rarely has stored correlation information, and guessing the total correlation, in particular for (n, tot) cross section, can be highly challenging given the dependence of the cross section on experimental parameters and sensitivities. Educated guesses on correlation structures based on template guidelines enables building the total correlation from a ground-up approach where only the missing information is supplemented with templates.
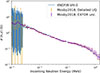 |
Fig. 10. Derived |


Despite the usefulness of the templates, the detailed UQ produces several pronounced spikes in the 1–3 keV region of Figure 11. These arise because the relative energy uncertainty δE/E, derived from the time-of-flight resolution, shown in Figure 9, is propagated to the cross section through the slope |dσ/dE| as expressed in equation (22). This slope-based treatment is well suited for the fast-energy region where σ(E) varies smoothly and the flux-weighted averages lead to small |dσ/dE| values. However, in the 1–3 keV range, the cross section exhibits rapid resonance-driven structure, resulting in large slopes. Even a modest δE is therefore amplified into a large δσ, producing the spikes. This behavior do not represent physical features of the cross section but instead arise from methodological limitations of extending a fast-region UQ treatment into an adjacent energy region with substantial structure.
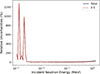 |
Fig. 11. Partial uncertainty for the Mosby2018 data after propagating to cross section uncertainty. The origin of the spikes are same as in Figure 10. |
4.3.4. Current limitations and path forward
ENDF/B evaluations consist of region-specific modeling approaches tailored to different energy regimes. At low energies, where nuclear structure effects dominate, cross sections fluctuate rapidly. In the resolved resonance region (RRR), codes such as SAMMY [10] use R-matrix formalism to fit resonance parameters to datasets like transmission, capture yield, and fission yield, explicitly incorporating experimental effects such as resolution functions and Doppler broadening during the fitting process. In the unresolved resonance region (URR), where resonances are too closely spaced to resolve individually, evaluations use statistical models based on average resonance parameters and generate probability tables. These tables encode the distribution of cross sections within each bin, and are preprocessed to account for resolution effects, self-shielding, and other experimental artifacts.
In contrast, evaluations in the fast energy region typically rely on the optical model to describe neutron-nucleus interactions and the Hauser-Feshbach formalism to model compound nucleus decay. These approaches assume smooth cross section behavior and generally do not fold in experimental resolution during fitting, treating measured cross sections as approximations of the true value.
The ARIADNE code propagates experimental energy uncertainty to the measured cross section using the same approach applied to other sources of uncertainty, as described in Sections 3 and 4.3.2. However, the application of equation (22) to estimate δσ corresponding to a small  in URR and RRR could result in large contribution to δσ, as shown in this example. And, yet, it remains essential to account for energy uncertainty, as each experiment features different resolution characteristics. A potential solution is to compute the slope dσ/dE on an energy grid that matches the binning used in the experiment, rather than on the typically finer evaluation grid. Since the experimental binning implicitly reflects the instrument’s energy resolution, this approach better represents the smearing effect present in the measured data and avoids artificially inflating the slope in regions where structure exists at finer scales than the resolution. However, for total cross sections derived from transmission measurements, this approach is less straightforward. The reported cross section values are not direct measurements, but are inferred from transmission, which is itself an exponential function of cross section and integrated over the energy-dependent flux and resolution function. As a result, the reported data already embody averaging effects, and computing dσ/dE without access to the underlying transmission spectrum and resolution model may not faithfully reflect the sensitivity to energy uncertainty. Therefore, applying slope-based energy uncertainty propagation requires additional experimental information or modeling to be used reliably.
In the absence of proper characterization of this energy uncertainty, it is easy to get false confidence in the precision of the reported data. Furthermore, issues as observed in the example in Section 4.2.1 can go unnoticed, where choices by the experimentalists, such as choice in neutron energy bin width, can have impact in the experimental covariances. As mentioned, the evaluation processes in RRR and URR differ significantly from evaluation process in fast regions, with different ways of treating different sources of uncertainties. Since the treatment of energy uncertainty in RRR is embedded in the resonance fitting procedure itself, it is not transferable to UQ in the fast energy region, where resonance parameters are not characterized. However, as seen in this Mosby2018 data, experiments may provide data crossing over RRR, URR and fast energy regions. Separate UQ techniques for each will result in neglecting correlations between measurements in different energy regimes by the same experiment using same detector, beam, samples and other common features. Therefore, inflation of δσ due to propagation of  at low-mid energy range currently remains an open challenge.
5. Conclusions
This paper presents example implementation of recommended experimental uncertainty quantification (UQ) templates for  ,
,  , and
, and  cross section measurements. We demonstrate through case studies, the required input information, the application procedure, and challenges that arise when using these templates in practice. The
  templates require extra information to compute the relevant sensitivities, and special attention needs to be given in applying the recommended uncertainty values since they are often not propagated to the cross section space. Examples from the
 are presented to demonstrate the impact of these templates in obtaining high fidelity experimental data and covariances for evaluations. An example case from Schwartz1974 data on
 was also presented to show the need for careful consideration of factors that may influence the underlying physics assumption in the template recommendation. The default choice of binning in the aforementioned data had adverse affect in the Nuclear Data evaluation done for PARADIGM project due to strong anti-correlation of counts in the adjacent energy bins. Lastly, an example case from Mosby2018
  was provided to illustrate the need for a common UQ technique that can be applied from the resolved resonance to the fast energy range to properly account for correlations that may exist between experimental data spanning RRR, URR and fast energy regions.
These examples underscore both the utility and the limitations of template-based UQ, and point to the need for improved methodologies that integrate physics-informed models with experimental metadata across energy domains.
Funding
The work was carried out under the auspices of the National Nuclear Security Administration (NNSA) of the U.S. Department of Energy (DOE) under contract 89233218CNA000001. Research reported in this publication was partially supported by the U.S. Department of Energy LDRD and the Advanced Science and Computing program at Los Alamos National Laboratory.
Conflicts of interest
The authors declare that they have no competing interest to report.
Data availability statement
The raw data associated with this manuscript are all referenced within in the main text, figures and tables. Data generated through the UQ process is under the stewardship of Los Alamos National Laboratory and could be made available upon request following the necessary protocol.
Author contribution statement
Conceptualization: A. Khatiwada and D. Neudecker; Methodology: A. Khatiwada and D. Neudecker; Software: A. Khatiwada and D. Neudecker; Investigation: A. Khatiwada; Resources: D. Neudecker; Data Curation: A. Khatiwada; Writing – Original Draft Preparation: A. Khatiwada; Writing – Review & Editing: A. Khatiwada, D. Neudecker and E.C. Thompson; Visualization: A. Khatiwada, E.C. Thompson and N.A.W. Walton.
Acknowledgments
AK thanks Thanos Stamatopoulos, Esther Leal Cidoncha and Matthew James Devlin, and entire team of the LANL LDRD funded project PARADIGM for relevant discussions and help with selection of some of the historical dataset.
References
- Special issue on workshop on neutron cross section covariances Port Jefferson, New York, USA, Nucl. Data Sheets 109 (2008) [Google Scholar]
- Special issue on international workshop on nuclear data covariances 1 (2015) [Google Scholar]
- D. Neudecker, R. Capote, H. Leeb, Impact of model defect and experimental uncertainties on evaluated output, Nucl. Instrum. Methods Phys. Res. Sect. A: Accel. Spectrom. Detect. Assoc. Equip. 723, 163 (2013). ISSN 0168-9002. https://doi.org/10.1016/j.nima.2013.05.005. https://www.sciencedirect.com/science/article/pii/S0168900213005238 [Google Scholar]
- D. Neudecker, A.M. Lewis, E.F. Matthews, J. Vanhoy, R.C. Haight, D.L. Smith, P. Talou, S. Croft, A.D. Carlson, B. Pierson, A. Wallner, A. Al-Adili, L. Bernstein, R. Capote, M. Devlin, M. Drosg, D.L. Duke, S. Finch, M.W. Herman, K. Kelly, A. Koning, A.E. Lovell, P. Marini, K. Montoya, G.P.A. Nobre, M. Paris, B. Pritychenko, H. Sjöstrand, L. Snyder, V. Sobes, A. Solders, J. Taieb, Templates of expected measurement uncertainties, EPJ Nuclear Sci. Technol. 9, 35 (2023). https://doi.org/10.1051/epjn/2023014 [CrossRef] [EDP Sciences] [Google Scholar]
- A.M. Lewis, A.D. Carlson, D.L. Smith, D.P. Barry, R.C. Block, S. Croft, Y. Danon, M. Drosg, M.W. Herman, D. Neudecker, N. Otuka, H. Sjöstrand, V. Sobes, Templates of expected measurement uncertainties for total neutron cross-section observables, EPJ Nuclear Sci. Technol. 9, 34 (2023). https://doi.org/10.1051/epjn/2023018 [CrossRef] [EDP Sciences] [Google Scholar]
- A.M. Lewis, D. Neudecker, A.D. Carlson, D.L. Smith, I. Thompson, A. Wallner, D.P. Barry, L.A. Bernstein, R.C. Block, S. Croft, Y. Danon, M. Drosg, R.C. Haight, M.W. Herman, H.Y. Lee, N. Otuka, H. Sjöstrand, V. Sobes, Templates of expected measurement uncertainties for neutron-induced capture and charged-particle production cross section observables, EPJ Nuclear Sci. Technol. 9, 33 (2023). https://doi.org/10.1051/epjn/2023015 [CrossRef] [EDP Sciences] [Google Scholar]
- J.R. Vanhoy, R.C. Haight, S.F. Hicks, M. Devlin, D. Neudecker, M. Herman, A. Koning, K.J. Kelly, I. Thompson, Templates of expected measurement uncertainties for (n, xn) cross sections, EPJ Nuclear Sci. Technol. 9, 31 (2023). https://doi.org/10.1051/epjn/2023019 [CrossRef] [EDP Sciences] [Google Scholar]
- D. Neudecker, M. Devlin, R.C. Haight, K.J. Kelly, P. Marini, A.D. Carlson, J. Taieb, M.C. White, Templates of expected measurement uncertainties for prompt fission neutron spectra, EPJ Nuclear Sci. Technol. 9, 32 (2023). https://doi.org/10.1051/epjn/2023013 [CrossRef] [EDP Sciences] [Google Scholar]
- D. Neudecker, A.D. Carlson, S. Croft, M. Devlin, K.J. Kelly, A.E. Lovell, P. Marini, J. Taieb, Templates of expected measurement uncertainties for average prompt and total fission neutron multiplicities, EPJ Nuclear Sci. Technol. 9, 30 (2023). https://doi.org/10.1051/epjn/2023016 [CrossRef] [EDP Sciences] [Google Scholar]
- N.M. Larson, Updated user’s guide for SAMMY: multilevel r-matrix fits to neutron data using Bayes’ equations. Technical Report, Oak Ridge National Lab. (ORNL), Oak Ridge, TN (United States), 2008 [Google Scholar]
- B. Becker, C. Baspian, F. Emiliani, F. Gunsing, J. Heyse, K. Kauwenberghs, S. Kopecky, C. Lampoudis, C. Massimi, N. Otuka, P. Schillebeeckx, I. Sirakov, Data reduction and uncertainty propagation of time-of-flight spectra with AGS, J. Instrum. 7, P11002 (2012). https://doi.org/10.1088/1748-0221/7/11/P11002 [CrossRef] [Google Scholar]
- T. Kawano, The coupled-channels and Hauser-Feshbach code, Springer Proc. Phys. 254, 28 (2021) [Google Scholar]
- A.J. Koning, D. Rochman, Modern nuclear data evaluation with the TALYS code system, Nucl. Data Sheets 113, 2841 (2012). ISSN 0090-3752. https://doi.org/10.1016/j.nds.2012.11.002. https://www.sciencedirect.com/science/article/pii/S0090375212000889. Special Issue on Nuclear Reaction Data [CrossRef] [Google Scholar]
- M. Herman, R. Capote, B.V. Carlson, P. Obložinský, M. Sin, A. Trkov, H. Wienke, V. Zerkin, Empire: nuclear reaction model code system for data evaluation, Nucl. Data Sheets 108, 2655 (2007). ISSN 0090-3752. https://doi.org/10.1016/j.nds.2007.11.003. https://www.sciencedirect.com/science/article/pii/S0090375207000981. Special Issue on Evaluations of Neutron Cross Sections [CrossRef] [Google Scholar]
- C. De Saint Jean, P. Archier, E. Privas, G. Noguére, B. Habert, P. Tamagno, Evaluation of neutron-induced cross sections and their related covariances with physical constraints, Nucl. Data Sheets 148, 383 (2018). ISSN 0090-3752. https://doi.org/10.1016/j.nds.2018.02.010. https://www.sciencedirect.com/science/article/pii/S0090375218300292. Special Issue on Nuclear Reaction Data [CrossRef] [Google Scholar]
- D. Neudecker, D.L. Smith, F. Tovesson, R. Capote, M.C. White, N.S. Bowden, L. Snyder, A.D. Carlson, R.J. Casperson, V. Pronyaev, S. Sangiorgio, K.T. Schmitt, B. Seilhan, N. Walsh, W. Younes, Applying a template of expected uncertainties to updating 239pu(n,f) cross-section covariances in the neutron data standards database, Nucl. Data Sheets 163, 228 (2020). ISSN 0090-3752. https://doi.org/10.1016/j.nds.2019.12.005. https://www.sciencedirect.com/science/article/pii/S0090375219300729 [CrossRef] [Google Scholar]
- N. Otuka, E. Dupont, V. Semkova, B. Pritychenko, A.I. Blokhin, M. Aikawa, S. Babykina, M. Bossant, G. Chen, S. Dunaeva, R.A. Forrest, T. Fukahori, N. Furutachi, S. Ganesan, Z. Ge, O.O. Gritzay, M. Herman, S. Hlavač, K. Katō, B. Lalremruata, Y.O. Lee, A. Makinaga, K. Matsumoto, M. Mikhaylyukova, G. Pikulina, V.G. Pronyaev, A. Saxena, O. Schwerer, S.P. Simakov, N. Soppera, R. Suzuki, S. Takács, X. Tao, S. Taova, F. Tárkányi, V. Varlamov, J. Wang, S.C. Yang, V. Zerki, Y. Zhuang, Towards a More Complete and Accurate Experimental Nuclear Reaction Data Library (EXFOR): International Collaboration Between Nuclear Reaction Data Centres (NRDC), 2014 [Google Scholar]
- P. Schillebeeckx, B. Becker, Y. Danon, K. Guber, H. Harada, J. Heyse, A.R. Junghans, S. Kopecky, C. Massimi, M.C. Moxon, N. Otuka, I. Sirakov, K. Volev, Determination of resonance parameters and their covariances from neutron induced reaction cross section data, Nucl. Data Sheets 113, 3054 (2012). ISSN 0090-3752. https://doi.org/10.1016/j.nds.2012.11.005. https://www.sciencedirect.com/science/article/pii/S0090375212000919. Special Issue on Nuclear Reaction Data [CrossRef] [Google Scholar]
- E.E. Lewis, Fundamentals of Nuclear Reactor Physics (Elsevier Inc, 2008). ISBN 9780123706317. https://doi.org/10.1016/B978-0-12-370631-7.X0001-0. Publisher Copyright: © 2008 Elsevier Inc. All rights reserved [Google Scholar]
- D. Neudecker, ARIADNE – A program estimating covariances in detail for neutron experiments, EPJ Nuclear Sci. Technol. 4, 34 (2018). https://doi.org/10.1051/epjn/2018012 [CrossRef] [EDP Sciences] [Google Scholar]
- W.P. Poenitz, J.F. Whalen, A.B. Smith, Total neutron cross sections of heavy nuclei, Nucl. Sci. Eng. 78, 333 (1981). https://doi.org/10.13182/NSE81-A21367 [Google Scholar]
- IAEA Nuclear Data Section, EXFOR: Experimental Nuclear Reaction Data Database, ID: 22409.008, 2024. https://www-nds.iaea.org/exfor/servlet/X4sGetSubent?reqx=50283&subID=22409008&plus=1. Accessed: 2024-12-05 [Google Scholar]
- D.G. Foster Jr., D.W. Glasgow, Neutron total cross sections, 2.5–15 mev. I. Experimental, Phys. Rev. C 3, 576 (1971) [Google Scholar]
- IAEA Nuclear Data Section, EXFOR: Experimental Nuclear Reaction Data Database, ID: 10578.009, 2024. https://www-nds.iaea.org/exfor/servlet/X4sGetSubent?reqx=50281&subID=10578009&plus=1. Accessed: 2024-12-05 [Google Scholar]
- IAEA Nuclear Data Section, EXFOR: Experimental Nuclear Reaction Data Database, ID: 20408.002, 2024. https://www-nds.iaea.org/exfor/servlet/X4sGetSubent?reqx=42947&subID=20408002&plus=1. Accessed: 2024-12-05 [Google Scholar]
- IAEA Nuclear Data Section, EXFOR: Experimental Nuclear Reaction Data Database, ID: 21328.004, 2024. https://www-nds.iaea.org/exfor/servlet/X4sGetSubent?reqx=50282&subID=21328004&plus=1. Accessed: 2024-12-05 [Google Scholar]
- IAEA Nuclear Data Section, EXFOR: Experimental Nuclear Reaction Data Database, ID: 30464.003, 2024. https://www-nds.iaea.org/exfor/servlet/X4sGetSubent?reqx=42944&subID=30464003&plus=1. Accessed: 2024-12-05 [Google Scholar]
- A. Lovell, I. Stetcu, D. Neudecker, A. Khatiwada, T. Kawano, M. Herman, P. Talou, N. Gibson, Creation of covariances for 51v. Technical Report LA-UR-25-24079, Los Alamos National Laboratory, 2025 [Google Scholar]
- A.B. Smith, P. Guenther, R. Larsen, C. Nelson, P. Walker, J.F. Whalen, Multi-angle fast neutron time-of-flight system, Nucl. Instrum. Methods 50, 277 (1967) [Google Scholar]
- G. Schnabel, V. Pronyaev, W. Poenitz, gmapy: a Python package for nuclear data evaluation. https://github.com/IAEA-NDS/gmapy, 2025. Python package for producing nuclear data evaluations of cross sections including uncertainties from combined experimental data. Accessed 2025 [Google Scholar]
- A.D. Carlson, V.G. Pronyaev, R. Capote, G.M. Hale, Z.-P. Chen, I. Duran, F.-J. Hambsch, S. Kunieda, W. Mannhart, B. Marcinkevicius, R.O. Nelson, D. Neudecker, G. Noguere, M. Paris, S.P. Simakov, P. Schillebeeckx, D.L. Smith, X. Tao, A. Trkov, A. Wallner, W. Wang, Evaluation of the neutron data standards, Nucl. Data Sheets 148, 143 (2018). ISSN 0090-3752. https://doi.org/10.1016/j.nds.2018.02.002. https://www.sciencedirect.com/science/article/pii/S0090375218300218. Special Issue on Nuclear Reaction Data [CrossRef] [Google Scholar]
- W.P. Poenitz, S.E. Aumeier, The simultaneous evaluation of the standards and other cross sections of importance for technology. Technical Report ANL/NDM-139 [ENDF-358], Argonne National Laboratory, 1997. https://www-nds.iaea.org/standards/Reports/ANL-NDM-139.pdf. Office of Scientific & Technical Information (OSTI) Report DE98004912 [Google Scholar]
- R.B. Schwartz, R.A. Schrack, H.T. Heaton II, Total neutron cross sections of uranium-235, uranium-238, and plutonium-239 from 0.5 to 15 mev, Nucl. Sci. Eng. 54, 322 (1974). https://doi.org/10.13182/NSE74-A23422 [Google Scholar]
- Neutron standards and flux normalization, in Proceedings of a Symposium Held at Argonne National Laboratory, Argonne, Illinois (1970). https://www.osti.gov/biblio/4754692 [Google Scholar]
- D. Neudecker, T.E. Cutler, M. Devlin, P. Brain, N. Gibson, M.J. Grosskopf, M.W. Herman, J. Hutchinson, T. Kawano, A. Khatiwada, N. Kleedtke, E. Leal-Cidoncha, R.C. Little, A.E. Lovell, A. Stamatopoulos, E.C. Thompson, S.A. Vander Wiel, E. Williamson, Machine learning to select experiments driven by fundamental science and applications for targeted nuclear data improvement, Phys. Rev. X 15, 021086 (2025). https://link.aps.org/doi/10.1103/PhysRevX.15.021086 [Google Scholar]
-
The CMS Collaboration, Measurement of the top quark polarization and
 spin correlations using dilepton final states in proton-proton collisions at
  , Phys. Rev. D 100, 072002 (2019). https://link.aps.org/doi/10.1103/PhysRevD.100.072002
[Google Scholar]
, Phys. Rev. D 100, 072002 (2019). https://link.aps.org/doi/10.1103/PhysRevD.100.072002
[Google Scholar]
- R. Gold, An iterative unfolding method for response matrices. Technical Report, Argonne National Lab., Ill., 1964. https://www.osti.gov/biblio/4634295 [Google Scholar]
- W.H. Richardson, Bayesian-based iterative method of image restoration, J. Opt. Soc. Am. 62, 55 (1972). https://doi.org/10.1364/JOSA.62.000055 [NASA ADS] [CrossRef] [Google Scholar]
- J.F. Briesmeister, MCNP-a general Monte Carlo n-particle transport code. Technical Report LA–13709–M, Los Alamos National Laboratory, 1993 [Google Scholar]
- S. Agostinelli, J. Allison, K. Amako, J. Apostolakis, H. Araujo, P. Arce, M. Asai, et al., GEANT4: a simulation toolkit, Nucl. Instrum. Methods Phys. Res. Sect. A: Accel. Spectrom. Detect. Assoc. Equip. 506, 250 (2003). https://doi.org/10.1016/S0168-9002(03)01368-8 [Google Scholar]
- S. Mosby, T.A. Bredeweg, A. Couture, M. Jandel, T. Kawano, J.L. Ullmann, R.A. Henderson, C.Y. Wu, Unifying measurement of 239Pu(n, γ) in the kev to mev energy regime, Phys. Rev. C 97, 041601 (2018). https://link.aps.org/doi/10.1103/PhysRevC.97.041601 [CrossRef] [Google Scholar]
- S. Mosby, T.A. Bredeweg, A. Chyzh, A. Couture, R. Henderson, M. Jandel, E. Kwan, J.M. O’Donnell, J. Ullmann, C.Y. Wu, Improved neutron capture cross section of 239Pu, Phys. Rev. C 89, 034610 (2014). https://link.aps.org/doi/10.1103/PhysRevC.89.034610 [Google Scholar]
- W.P. Poenitz, J.F. Whalen, Neutron total cross section measurements in the energy region from 47 kev to 20 mev. Technical Report, ANL, 1983 [Google Scholar]
- J.M. Peterson, A. Bratenahl, J.P. Stoering, Neutron total cross sections in the 17- to 29-mev region, Phys. Rev. 120, 521 (1960) [Google Scholar]
- A. Bratenahl, J.M. Peterson, J.P. Stoering, Neutron total cross sections in the 7- to 14-mev region, Phys. Rev. 110, 927 (1958) [CrossRef] [Google Scholar]
- J.H. Coon, E.R. Graves, H.H. Barschall, Total cross sections for 14-mev neutrons, Phys. Rev. 88, 562 (1952) [Google Scholar]
-
M.S. Pandey, J.B. Garg, J.A. Harvey, Neutron total cross sections and resonance parameters of
 and
and  . I, Phys. Rev. C 15, 600 (1977). https://link.aps.org/doi/10.1103/PhysRevC.15.600
[CrossRef]
[Google Scholar]
. I, Phys. Rev. C 15, 600 (1977). https://link.aps.org/doi/10.1103/PhysRevC.15.600
[CrossRef]
[Google Scholar]
- J.C. Hopkins, B.C. Diven, Neutron capture to fission ratios in u233, u235, pu239, Nucl. Sci. Eng. 12, 169 (1962). https://doi.org/10.13182/NSE62-A26055 [CrossRef] [Google Scholar]
- L.W. Weston, J.H. Todd, Neutron capture cross section of plutonium-240, Nucl. Sci. Eng. 63, 143 (1977). https://doi.org/10.13182/NSE77-A27017 [Google Scholar]
- M. Weigand, C. Beinrucker, A. Couture, S. Fiebiger, M. Fonseca, K. Göbel, M. Heftrich, T. Heftrich, M. Jandel, F. Käppeler, A. Krása, C. Lederer, H.Y. Lee, R. Plag, A. Plompen, R. Reifarth, S. Schmidt, K. Sonnabend, J.L. Ullmann, 63Cu(n, γ) cross section measured via 25 kev activation and time of flight, Phys. Rev. C 95, 015808 (2017). https://link.aps.org/doi/10.1103/PhysRevC.95.015808 [Google Scholar]
- C.J. Prokop, A. Couture, S. Jones, S. Mosby, G. Rusev, J. Ullmann, M. Krtička, Measurement of the 65Cu(n, γ) cross section using the detector for advanced neutron capture experiments at LANL, Phys. Rev. C 99, 055809 (2019). https://link.aps.org/doi/10.1103/PhysRevC.99.055809 [CrossRef] [Google Scholar]
- R.C. Allen, R.B. Walton, R.B. Perkins, R.A. Olson, R.F. Taschek, Interaction of 0.5- and 1.0-mev neutrons with some heavy elements, Phys. Rev. 108, 1647 (1957). https://link.aps.org/doi/10.1103/PhysRev.108.1647.3 [Google Scholar]
- Ch. Lagrange, J. Jary, J. Sigaud, G. Haouat, J. Lachkar, Y. Patin, Neutron scattering cross sections for 232th, 233u, 235u, 238u, 239pu, and 242pu between 0.6 and 3.4 mev, Nucl. Sci. Eng. 81, 491 (1982). https://doi.org/10.13182/NSE82-A21439 [Google Scholar]
- IAEA Nuclear Data Section, EXFOR: Experimental Nuclear Reaction Data Database, ID: 20036.015, 2024. https://www-nds.iaea.org/exfor/servlet/X4sGetSubent?reqx=50284&subID=20036015&plus=1. Accessed: 2024-12-05 [Google Scholar]
- N.P. Glazkov, Cross sections of the inelastic scattering of neutrons with energies of 0.4-1.2 mev on medium and light nuclei, At. Energ. 15, 416 (1963) [Google Scholar]
Cite this article as: Ajeeta Khatiwada, Denise Neudecker, Elizabeth Christine Thompson, Noah A. W. Walton. Experimental uncertainty quantification using templates of expected measurement uncertainties for fast neutron-induced total, capture, and scattering cross sections, EPJ Nuclear Sci. Technol. 12, 17 (2026). https://doi.org/10.1051/epjn/2026008
Appendix A
The uncertainty sources that were added (either from templates or from available documentation) for experimental datasets of (n, tot) reactions for various nuclei. The notations for uncertainty sources are discussed in the Section 2, namely δn for target areal mass density, δN for flux-normalization uncertainty, δF for self-shielding uncertainty, δE for energy uncertainty, and δB for background correction uncertainty.
Same as Table A.1 for(n, γ) reactions. The notations for uncertainty sources are discussed in the Section 2, namely δn for target areal mass density, δN for flux-normalization uncertainty, δw for sample composition uncertainty, δR for reference cross section uncertainty, δE for energy uncertainty, and δB for background correction uncertainty.
Same as Table A.1 for (n, el) reactions. The notations for uncertainty sources are discussed in the Section 2, namely δn for target areal mass density, δN for flux-normalization uncertainty, δw for sample composition uncertainty, δR for reference cross section uncertainty, δE for energy uncertainty, and δB for background correction uncertainty, δg for geometric effects uncertainty, δy e for yield extraction uncertainty, δa for attenuation uncertainty, δε n for neutron detection efficiency uncertainty.
Same as Table A.3 for (n, inl) reactions.
All Tables
The uncertainty sources that were added (either from templates or from available documentation) for experimental datasets of (n, tot) reactions for various nuclei. The notations for uncertainty sources are discussed in the Section 2, namely δn for target areal mass density, δN for flux-normalization uncertainty, δF for self-shielding uncertainty, δE for energy uncertainty, and δB for background correction uncertainty.
Same as Table A.1 for(n, γ) reactions. The notations for uncertainty sources are discussed in the Section 2, namely δn for target areal mass density, δN for flux-normalization uncertainty, δw for sample composition uncertainty, δR for reference cross section uncertainty, δE for energy uncertainty, and δB for background correction uncertainty.
Same as Table A.1 for (n, el) reactions. The notations for uncertainty sources are discussed in the Section 2, namely δn for target areal mass density, δN for flux-normalization uncertainty, δw for sample composition uncertainty, δR for reference cross section uncertainty, δE for energy uncertainty, and δB for background correction uncertainty, δg for geometric effects uncertainty, δy e for yield extraction uncertainty, δa for attenuation uncertainty, δε n for neutron detection efficiency uncertainty.
All Figures
|
Fig. 1. Total uncertainties for 239Pu(n, tot) data from reference [21], shown using three treatments: EXFOR-reported total uncertainties (blue dots), combined uncertainties obtained by adding EXFOR statistical values and documented systematic uncertainties in quadrature (orange solid line), and total uncertainties derived from a comprehensive uncertainty quantification process aided with template recommendations (green dashed line). |
| In the text | |
|
Fig. 2. Correlation terms associated with the counting uncertainty for the Foster et al. |
| In the text | |
|
Fig. 3. Template recommended uncertainty of 4% on the flux-normalization, when propagated to the Smith1973 (n, tot) cross section data, and accounting for the associated sensitivities, results in different values for flux-normalization uncertainties at different sample thicknesses. |
| In the text | |
|
Fig. 4. Partial uncertainty for the Schmidt1996 data, with the uncertainties provided in either EXFOR or a separate documentation by authors designated by an asterisk, ‘*’, next to the source. The remaining partial uncertainties are filled in from the templates. Note that the energy uncertainty is relative to the centroid value of the incoming neutron energy bin. |
| In the text | |
|
Fig. 5. Cross section for Schmidt1996 data as shown with uncertainties reported on EXFOR (purple) and after detailed UQ using templates of expected experimental uncertainties (orange). |
| In the text | |
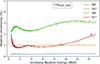 |
Fig. 6. Same as Figure 4 for Schwartz1974 data. |
| In the text | |
|
Fig. 7. Comparison of the estimated bin width for the incoming neutron energy and the energy uncertainty/resolution, δE, of the measurement. |
| In the text | |
|
Fig. 8. Evaluation of nuclear data using |
| In the text | |
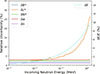 |
Fig. 9. Same as Figure 4 for Mosby2018 data. |
| In the text | |
|
Fig. 10. Derived |
| In the text | |
|
Fig. 11. Partial uncertainty for the Mosby2018 data after propagating to cross section uncertainty. The origin of the spikes are same as in Figure 10. |
| In the text | |
Current usage metrics show cumulative count of Article Views (full-text article views including HTML views, PDF and ePub downloads, according to the available data) and Abstracts Views on Vision4Press platform.
Data correspond to usage on the plateform after 2015. The current usage metrics is available 48-96 hours after online publication and is updated daily on week days.
Initial download of the metrics may take a while.