Open Access
Fig. 2.
Download original image
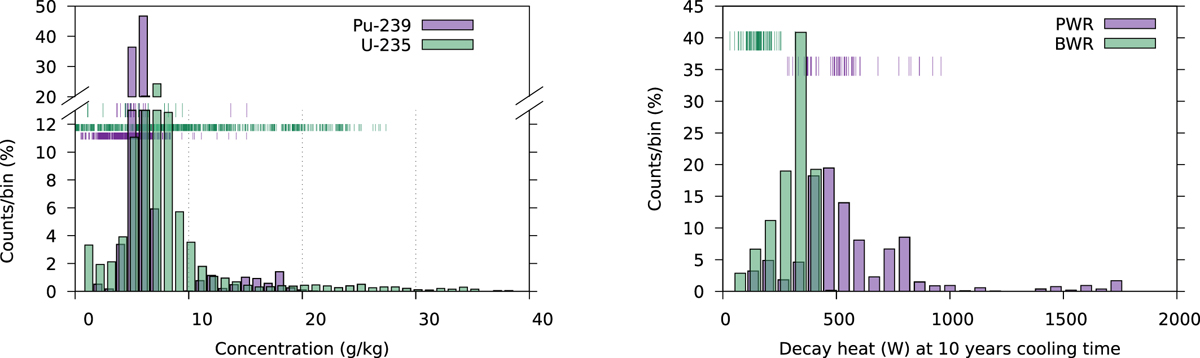
Right: example of assembly decay heat at 10 years cooling time, based on realistic irradiation history for a number of existing PWR and BWR plants. Left: same for the assembly average 235U and 239Pu concentrations.
Current usage metrics show cumulative count of Article Views (full-text article views including HTML views, PDF and ePub downloads, according to the available data) and Abstracts Views on Vision4Press platform.
Data correspond to usage on the plateform after 2015. The current usage metrics is available 48-96 hours after online publication and is updated daily on week days.
Initial download of the metrics may take a while.