| Issue |
EPJ Nuclear Sci. Technol.
Volume 8, 2022
Fuel Cycle Simulation TWoFCS 2021
|
|
|---|---|---|
| Article Number | 7 | |
| Number of page(s) | 14 | |
| DOI | https://doi.org/10.1051/epjn/2022002 | |
| Published online | 25 May 2022 | |
https://doi.org/10.1051/epjn/2022002
Regular Article
Coupling reactor design and scenario calculations: a promising method for scenario optimization
1
CEA, DES, IRESNE, DER, SPRC, LE2C, Cadarache, 13108 Saint Paul Lez Durance, France
2
CEA, DES, IRESNE, DER, SPESI, LP2E, Cadarache, 13108 Saint Paul Lez Durance, France
3
Laboratoire de Physique Subatomique et de Cosmologie (LPSC), Centre National de la Recherche Scientifique (CNRS), 53 rue des Martyrs, 38026 Grenoble, France
* e-mail: This email address is being protected from spambots. You need JavaScript enabled to view it.
Received:
14
July
2021
Received in final form:
18
February
2022
Accepted:
24
February
2022
Published online: 25 May 2022
Abstract
The link between reactor design studies and scenarios calculations is usually sequential. From a list set of objectives, a reactor design is produced and passed to the scenarist in the form of a numeric irradiation model. This approach assumes that the reactor design is fixed from the scenarist perspective. The method presented in this article proposes to use a flexible reactor model, built with artificial neural networks, that gives the possibility to the scenarist to change a reactor design directly during the scenario calculations. Doing so, the reactor design is no longer an imposed parameter but a tool to find new optimal trajectories. Moreover, this flexible model is able to exploit the historical loaded fuel compositions generated by the scenario calculations in order to monitor the reactor performances over time. In this paper, the flexible reactor model construction is detailed and the interest of such method is highlighted with an application case that consists in the transition from a PWR fleet, similar to the French one, towards a PWR − SFR fleet stabilizing plutonium inventory.
© K. Tirel et al., Published by EDP Sciences, 2022
 This is an Open Access article distributed under the terms of the Creative Commons Attribution License (https://creativecommons.org/licenses/by/4.0), which permits unrestricted use, distribution, and reproduction in any medium, provided the original work is properly cited.
1 Introduction
Fast reactors are strong candidates to achieve nuclear sustainability in the long run. Thanks to their fast spectrum, they are able to multirecycle plutonium, to offer a better management of minor actinides and to produce fissile material from depleted uranium, making possible fuel cycle closure. This is why some countries like France have included the future commissioning of fast reactors in their energy strategy [1–3]. There is currently no definitive design adopted in France despite several propositions done in the past for sodium-cooled fast reactors (SFR): the V2B concept [4] which is an homogeneous break-even core without fertile blanket, the CFV core [5] that aims to minimize the void coefficient, the CAPRA core [6] which purpose is to burn plutonium and minor actinides, or the CADOR concept [7] that seeks the maximization of Doppler effect for safety purpose. These designs have been developed to answer specific goals about the fuel cycle, e.g. the V2B core is a break-even core that can become breeder by adding fertile material which facilitates the deployment of a 100% SFR fleet, or about given performances related to safety, e.g. the CFV or CADOR concepts. Once the design is set, scenario calculations are done to determine the different ways to integrate this new design in the future nuclear fleet. More precisely, scenario calculations simulate the evolution of a given fleet during a timeline by modeling the different fuel cycle facilities (reactors, fabrication plants, reprocessing plants, storages, etc.) and the material flows between them. With such simulations, it is possible to determine whether a reactor concept achieves its goal in the fleet.
At CEA, the current link between reactor design and scenario calculations is usually sequential. First, a reactor design is set up to fulfil a list of objectives regarding its function in the fleet, its performances and its safety. Regarding fuel isotopy, the design phase is generally done with a limited number of plutonium isotopic vectors, which are representative of the expected reactor life and come from previous scenario studies. Then, a numerical model can be produced and passed to the scenarist. This numerical model aims to simulate irradiation during the scenario calculation. Usually, it adapts the flux and cross sections for each fresh fuel composition, making possible a precise tracking of the irradiated fuel isotopy. However, such a model is bounded to a given reactor design most of the time, meaning that the scenarist cannot change the reactor design as he pleases. Among all parameters that define scenario calculations, such as deployment timeline, reprocessing strategy or resource management, reactor models are generally used as fixed inputs and reactor safety parameters and performances, such as maximum linear power or reactivity coefficients, are not systematically checked during the simulation.
Improvements could be obtained by strengthening the coupling between reactor design and scenario calculations. For scenario calculations, the use of a flexible reactor model could give more levers to the scenarist to make his trajectories of interest work. For example, a lack of plutonium that occurred during the transition between a PWR − SFR mixed fleet and a 100% SFR fleet in [8] is fixed by adding fertile blankets in the SFR of the starting fleet. By extending the flexibility to the entire reactor design, more viable trajectories should be accessible and reactor design trends could be associated to some trajectory performances such as plutonium inventory, natural uranium consumption or facility capacities. For the reactor design phase, the design trends highlighted by the scenarist can serve as a starting point to guide the designer, putting fuel cycle needs at the heart of reactor design. In addition, instead of using a limited number of fuel compositions to evaluate upstream the reactor performances, the entirety of loaded fuel compositions could be used to monitor the reactor performances. This piece of information could then be used to adjust the reactor design in order to ensure optimal reactor performances during the trajectory study. In the case of a 400 MWth SFR core for instance, it is shown in [9] that a change in plutonium isotopy leads to some constraints on the fuel assembly geometry in order to maintain acceptable plutonium content and maximum linear power.
From these observations, this paper proposes a new approach that aims to reinforce the link between reactor design and scenario calculations based on the use of flexible reactor models that are compatible with the scenario calculation code used at CEA, COSI [8]. As there is currently no definitive designs for the SFR in France, it seems relevant to try this method in the case of SFR, even if it could be used for any kind of reactor.
The first section of this paper is focused on the presentation of the general method, the flexible SFR models and the place of this work among what is done in the scenario field. In the second section, an application case about the stabilization of plutonium inventory in a fleet similar to the French one is detailed. The purpose of this application case is double. First of all, it aims to show that using flexible reactor models in a scenario calculation is useful to establish links between reactor design parameters and trajectory performances, putting scenario considerations at the heart of the design process. Secondly, the feasibility of reactor performance monitoring is demonstrated, which could be useful to make sure that the reactor is working properly during its entire life.
2 Method
The coupling between reactor design and scenario calculations is based on the use of flexible reactor models as a replacement for fixed models that are currently used. First, the approach is presented and compared to what is currently done at CEA. Then, a brief state of the art about the use of flexible reactor models provides the element necessary to understand this work contribution. Finally, the SFR models used are presented.
2.1 General logic
Figure 1 illustrates the differences between current scenario calculation logic and the methodology developed. The usual logic appears in blue. A trajectory is first defined by setting up the timeline, the different fleet facilities (reactors, fabrication plants, reprocessing plants, initial stocks…), the reprocessing strategy… After the calculation, depending on the results obtained, only the trajectory definition can be modified in order to improve the results concerning the goals that should be achieved by the fleet considered.
Some additions to the current logic provided by our approach are shown in red. Instead of using a fixed reactor model in the scenario calculations, the scenarist can tune the SFR flexible model parameters before each calculation. This could be done by hand, with a design of experiment for an exploratory analysis, as it is done in the application case presented in this paper, or else the design parameters could be passed as input to an optimization routine. Once the flexible model parameters are set, the scenario calculation is done and SFR performance monitoring is obtained in addition to the classical outputs. It is then possible to modify the trajectory definition and/or the SFR design parameters to improve the scenario results or the SFR performances. The additions that appear in red give more levers for the scenarist to work with and to better exploit available data about fuel composition to make sure SFR are working in acceptable conditions.
 |
Fig. 1 Illustration of our approach in comparison to the current logic. |
2.2 Use of flexible SFR models: a brief state of the art
Our method is based on the use of flexible SFR models. Surrogate models such as Artificial Neural Networks (ANN) have been used both in scenarios and reactor design studies to build models in order to reduce calculation time and to make possible exploratory and optimization studies. In the scenario field, ANN have been used as irradiation model since irradiation, alongside depletion calculations, is the most time consuming operation during a scenario [10]. The use of ANN in scenarios enables uncertainty propagation studies [10] or multiobjective optimization [11]. However, each ANN used in these studies has been built for a given reactor core. In other words, these ANN are all bounded to a given reactor design that cannot be modified.
On the other hand, ANN have been used to build flexible models for SFR design optimization [12–14]. In these works, the flexible model takes dozens of design parameters such as pellet radius, cladding thickness or fissile column height as input and returns core performances (breeding ratio, maximum linear power, feedback coefficients…). With that many degrees of freedom, the authors are able to find SFR cores that are optimized for a given performance, or that show the better compromise between several performances. Nevertheless, these studies do not take into account the variability of plutonium vector during the reactor life, which may change the optimal cores encountered.
A recent study has demonstrated the interest of using flexible SFR models in scenario calculations [15]. They built a SFR model that is driven by a limited number of design parameters, which are the core power, radius and height, the amount of radial fertile blanket, the irradiation time and the plutonium content ratio between the outer and the inner core. The assembly geometry, and consequently, the fuel fraction, as well as the power density are remained constant to avoid considerations about fuel mechanical behavior and thermos-hydraulics. Their model take as a plutonium vector as input, defined on a given isotopic range, and is used both as an equivalence model, to define the fresh fuel composition, and as an irradiation model, to define the irradiated fuel composition. With an example, they show that they are able to tune the SFR breeding ratio thanks to their flexible model, which makes possible the study of different kind of scenario, from one that breeds plutonium to one that burns it.
Some areas of improvement are available to us. First of all, it seems relevant to be able to change the fuel fraction and the power density of the core with our flexible model because these design parameters have a noticeable impact on the plutonium mass in the core and on the breeding ratio. Moreover, apart from the breeding ratio, core performances and safety estimators are not evaluated during the reactor life. This could be an improvement from the designer perspective to make sure that the core is correctly behaving at each instant. Our flexible SFR model, presented in the next section, aims to bring an answer to these observations.
2.3 Flexible SFR models used in this work
The flexible SFR model has several roles. Within the scenario calculations, it should act both as an equivalence model, for the determination of fresh fuel plutonium content, and as an irradiation model that gives the SFR irradiated fuel composition. After the scenario post-processing, it should be able to use the loaded fuel composition in SFR to return the evolution of SFR performances. Moreover, it should give access to a wide range of different SFR designs with the use of a limited number of impactful parameters. By keeping a low number of tunable parameters, potential further optimization calculations are simpler to do. In summary, the flexible SFR model should take as input relevant design parameters and fresh fuel composition, while giving as output the fresh fuel plutonium content, the irradiated fuel composition and some core performances. Flexible model inputs and outputs are summed up on Figure 2.
The SFR flexible model consists in a set of artificial neural networks (ANN) built with the statistical platform URANIE [16]. The ANN built here are multi-layer perceptron with one hidden layer that contains between 6 and 12 neurons. LHS sampling performed on the definition domain shown in Table 1 has been used to generate SFR cores and initial plutonium vectors. Then, two databases used to train and validate the ANN have been built with the ECCO/ERANOS code package [17] using the transport option and the JEFF 3.1 cross sections library [18]. Two sets of ANN have been built depending on the core volume in order to improve the model precision. For volumes lower than 2.5 m3, training and validation databases contain 750 sampled cores. For volumes higher than 2.5 m3, training and validation databases contain 900 sampled cores. The distinction on the core volume has appeared to be necessary to enhance the precision and the accuracy of the ANN.
The base geometry is a RZ model of a SFR V2B core [4] and is shown in Figure 3. When a volume modification is needed, the proportions of each illustrated zone are maintained constant. Tunable parameters of the flexible model and their variation domain are listed in Table 1. These global parameters are sufficient to modify the core behavior regarding inventories, burn-up and to get a good estimation of global safety parameters such as maximum power density, maximum DPA or void coefficient. As it can be seen in Table 1, the definition domain is wide enough to simulate a large diversity of cores. Regarding ANN validity, mean relative error obtained on plutonium mass and isotopy after irradiation is lower than 0.1% in fissile zones. Regarding fertile zones, the mean relative error on 239Pu fraction is lower than 0.1%, but increases for the heavier plutonium isotopes. It actually can reach several percent in the case of 242Pu for the largest cores. The reason behind this result is that fertile blankets are made of depleted uranium at the start of irradiation and are exposed to a lower neutron flow, especially in the case of large cores. Consequently, plutonium isotopes with a mass number higher than 239 are barely produced. In other words, their fraction is close to zero which can explain the mean error observed. For these isotopes, the mean absolute error is about 0.01 kg which is under the uncertainty caused by the model. Mean relative error committed on core performances is lower than 1% compared to calculations, which is acceptable as the purpose of the flexible model is to find SFR design trends and not a definitive core.
 |
Fig. 2 SFR flexible model inputs and outputs. |
Flexible SFR model definition domain.
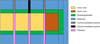 |
Fig. 3 RZ reference model of the V2B core. |
3 Application case: transition from current French fleet towards a PWR − SFR that stabilizes plutonium inventory
The following application case aims to highlight viable trajectories that lead to PWR − SFR mixed fleets able to stabilize plutonium inventory by only changing the SFR design thanks to the flexible model presented before. Plutonium stabilization is a case of interest since it is a necessary step towards fuel cycle closure. A trajectory is considered viable if there is always enough plutonium to build fresh fuel. SFR design parameters are sampled using a factorial design approach and are gathered in Table 2. Parameter values are selected to explore a large part of the definition domain while keeping the number of calculations relatively low. In this case, 720 SFR designs have been used.
SFR design parameters used for the factorial design.
3.1 Static study for the target fleet definition
As SFR design is flexible and is modified before each trajectory calculation, the target fleet has to be flexible too. This is why a static analysis is carried out beforehand in order to find a fleet composition that actually stabilizes plutonium inventory. A simple methodology has been presented and validated in [19] for plutonium stabilization calculation in a steady state fleet. Plutonium equilibrium is achieved when plutonium consumption is equal to plutonium production at fleet scale, while the plutonium isotopy available to build fresh fuel is converged. In the present case, plutonium flows in the steady state fleet are shown on Figure 4.
Equations that describe the system are:
 (1)
(1)
 (2)
(2)
 (3)
(3)
 (4)
(4)
where fUOX, fMOX, fSFR: fractions in the fleet of PWR UOX, PWR MOX and SFR respectively. mMOX, mSFR: plutonium mass annually used in fresh fuel for PWR MOX and SFR respectively [t yr−1]. MUOX, MMOX, MSFR: plutonium mass annually extracted from irradiated fuel of PWR UOX, PWR MOX and SFR respectively [t yr−1]. gMOX, gSFR: mean plutonium grade in fresh fuel for PWR MOX and SFR respectively. GUOX, GMOX, GSFR: mean plutonium grade in irradiated fuel of PWR UOX, PWR MOX and SFR respectively. eSFR→MOX, eSFR→SFR: fraction of the plutonium mass extracted from SFR irradiated fuel used in PWR MOX and SFR fresh fuel respectively.
Equations (1) and (3) describe the balance between plutonium production and consumption for PWR MOX and SFR whereas equations (2) and (4) define the convergence of plutonium grade in both PWR MOX and SFR fresh fuels. As it is explained in [19], plutonium mass annually used in fresh fuel m, plutonium mass annually extracted from irradiated fuel M and its associated grade G can be expressed as a linear function of plutonium grade in fresh fuel g. For PWR UOX and PWR MOX, data used in this study are available in Table 3 and have already been used in a previous study [20].
For each set of SFR design parameters, a database is built, using the previously generated ANN, by calculating the plutonium mass in fresh and irradiated fuel for a hundred different plutonium isotopic vectors that are sampled inside the ANN definition domain. A linear regression is then calculated to get the linear expression of mSFR, MSFR and GSFR in function of g. For all reactors, five years cooling time and two years fabrication time are taken into account in the calculation of MSFR and GSFR. In addition, gMOX is set to 59% as this plutonium grade corresponds to a plutonium content of 12% in PWR MOX fresh fuel, ensuring a negative void coefficient for current PWR designs [21]. It is worth mentioning that the equivalence between a 12% plutonium content and a 59% plutonium grade is only true for the PWR MOX considered in this study, as the link between plutonium grade and plutonium content strongly depends on the PWR design and its burn-up. The set of equations is solved by using the SciPy package root function [22].
Among the 720 SFR sampled designs, a little less than 700 enable plutonium stabilization in a PWR − SFR mixed fleet. Fleet compositions are shown in Figure 5 in function of the average SFR breeding ratio. It appears that the SFR design sampling covers a wide range of breeding ratios, from plutonium burners with breeding ratio of −0.3 to plutonium breeders with breeding ratio of 0.3. This diversity leads to numerous fleet compositions stabilizing plutonium inventory among which some trends can be identified.
For negative breeding ratios, PWR MOX fraction is constant and equal to 8%. SFR fraction decreases when SFR breeding ratio becomes more negative, while PWR UOX fraction increases. This can be explained by the fact that the more negative the SFR breeding ratio, the lower the plutonium grade in SFR irradiated fuel GSFR, which decreases the fraction of plutonium extracted from SFR irradiated fuel that is used in PWR MOX fresh fuel eSFR→MOX. PWR UOX are then the main plutonium providers for PWR MOX. For the most negative breeding ratios, there are 8 installed PWR UOX for each PWR MOX in the fleet, which is consistent with the results found in [23]. SFR purpose in these fleets is to consume all the plutonium coming from PWR MOX and its own fuel. The more negative its breeding ratio, the more plutonium it can consume and the less SFR are needed in the fleet. In these fleets, plutonium multirecycling is completely handled by SFR.
For positive breeding ratios, PWR UOX and PWR MOX fractions seem to grow at the same rate while SFR fraction decreases. For high breeding ratios, one could have expected PWR UOX fraction to tend toward 0. In [19], plutonium equilibrium in a PWR MOX − SFR fleet is proved to be achievable with a plutonium grade in PWR MOX fresh fuel of 63% or 66% depending on the reprocessing strategy. However, we consider in this article that plutonium quality in PWR MOX fresh fuel is set to 59%. In order to reach this precise quality, SFR need to raise the quality of the plutonium from PWR MOX irradiated fuel close to 59%. This plutonium is then mixed to plutonium from PWR UOX irradiated fuel, which quality is around 62%. In such fleets, both PWR MOX and SFR multirecycle plutonium.
 |
Fig. 4 Plutonium flux in the steady state fleet. |
PWR data.
 |
Fig. 5 Fleet composition vs average SFR breeding ratio. |
3.2 Dynamic study
In this part, trajectories starting with a PWR fleet similar to the French one and ending with target fleets found in the previous section are calculated with the scenario calculation tool COSI7, which is the new version of COSI6 [8]. Common parts to all trajectories are presented before showing the results.
3.2.1 Trajectory definition
Studied trajectories are a succession of three different fleets. The simulation starts with a PWR fleet similar to the 2015 French one. This fleet is composed of 900 MWe, 1300 MWe and 1450 MWe PWR for a total installed power of 63 GWe. All the reactors are loaded with UOX fuel except for half of 900 MWe PWR that are loaded with 30% MOX fuel. At the beginning of the simulation, 11250 tons of irradiated UOX fuels and 2140 tons of irradiated MOX fuels are available in storage [24]. Then, this fleet is renewed between 2020 and 2040 with a PWR UOX − PWR MOX fleet that manages to stabilize the amount of irradiated UOX fuels. Finally, the target fleet is commissioned between 2080 and 2100. For the first two fleets, macro reactors are used to accelerate the calculation. For the target fleet, each reactor is modeled individually in order to have a precise follow up of plutonium need during the transition between the second and the target fleet. An example of fleet evolution over time is shown in Figure 6.
Apart from the composition of the target fleet, the same set of fuel cycle hypotheses is used for all the calculated trajectories. The fresh fuel fabrication time is set to two years while a minimum of five years cooling time is taken into account before reprocessing irradiated fuels. Fabrication plants and reprocessing plants work with infinite capacities, which means that they are not working constantly but only when needed. As a result, there is no stock of separated plutonium. This hypothesis, despite being strong, is satisfactory for this study that aims to evaluate the benefit of using flexible models in a scenario calculation. In the case of a lack of plutonium, an external plutonium source is available and can provide plutonium equivalent to the one extracted from an irradiated UOX fuel.
 |
Fig. 6 Example of fleet evolution over time in the case of a given SFR. |
3.2.2 Results
Figure 7 shows the evolution of plutonium margin over time for the different trajectories calculated. Plutonium margin is the plutonium mass available in spent fuel cooled down long enough to be reprocessed. A negative plutonium margin means that an external plutonium source has been used in order to make the trajectory work. Three types of trajectories are obtained. The first ones, in blue, represent fleets for which plutonium margin becomes negative during the simulation. The second ones, in orange, are fleets for which plutonium margin steadily decreases until the end of the simulation while staying positive. However, given the plutonium margin trend, these fleets will likely lack plutonium eventually. Finally, the third trajectory type, in green, represents fleets that actually manage to commission the PWR − SFR mixed fleet and to stabilize plutonium inventory.
Among all 700 trajectories, 255 are viable. Although the time scale is rather short, it seems that the viable trajectories manage to stabilize the plutonium margin. This tends to validate the steady state results obtained in Section 3.1. Several reasons can explain why other trajectories are not stabilizing the plutonium margin, despite having access to an unlimited plutonium stock if necessary. The first reason is purely numerical. When converting reactor fractions from the steady state analysis into a rounded number of reactors, the equilibrium found may not be respected. A second reason could be that the observation time is too short for the equilibrium to occur.
Figures 8–10 gather histograms of SFR design parameters for the fleets that lack plutonium, that will lack plutonium, that will lack plutonium or that have reached equilibrium. By comparing Figure 10 with Figure 9, it comes out that cores with high power density, high irradiation time and few fertile blankets are more likely to lead to viable trajectories, whereas power and fuel fraction seem to have a second order effect.
Power density is directly linked to the number of assemblies in the core, and thus, to the plutonium mass necessary to commission the SFR. Even if core power also affects the plutonium mass in the core, Table 4 highlights that power density is more impactful by comparing the plutonium mass in the core by unit of power in function of core power and core power density. For a same power produced, doubling the core power reduces the plutonium mass by a factor 1.1 or 1.2 whereas doubling the core power density reduces it by a factor 1.7 or 1.8. By increasing the core power density, it reduces the amount of plutonium necessary to commission the reactor, which relieves the tension on the plutonium margin.
Irradiation time defines the frequency at which the SFR needs to be loaded. With short irradiation times for example, the core needs to be reloaded more often which leads to an increase of the fresh fuels fabrication rate. Stocks will also receive more irradiated fuels. However, the 5 years cooling time and the 2 years fabrication time are not compressible. In other words, the plutonium inside the irradiated fuels will be loaded again in a core after at least 7 years. As a result, reducing the irradiation time increases the tension on plutonium margin during the commissioning phase. The shorter the transition, the greater this effect. On the contrary, longer irradiation times facilitate the transition phase.
Finally, fertile blankets enhance the core breeding ratio by taking advantage of the neutron leakage to produce plutonium. At first, it may seem counter-intuitive that cores with no or few fertile blankets lead to viable trajectory, while cores with several blankets lead to a lack of plutonium. Figure 11 brings out that cores with lower breeding ratio are more likely to lead to a viable trajectory in general for our application case. This is a fleet composition effect. It has been said during the fleet composition analysis in Section 3.1 that PWR MOX fraction increases with SFR breeding ratio, meaning that the number of PWR MOX to deploy during the transition increases. This leads to an increase of the plutonium mass needed during the transition which is not sustainable regarding available plutonium before the transition. In addition, reactors are deployed in this order: PWR UOX, PWR MOX, SFR. Despite being breeder, SFR do not have enough time to produce the plutonium mass needed to make the trajectory viable, making the results obtained here strongly dependent on transition duration. On the contrary, fleets with burner SFR contain about 3 PWR MOX and more than 20 PWR UOX, making them easier to commission. This is a good example to understand the importance of distinguishing fleets that are viable in steady state and the necessary conditions to their commissioning.
Figure 12 shows the plutonium margin evolution over time and in function of SFR average burn-up for the viable trajectories. A clear trend can be observed that is the higher the SFR average burn-up, the higher the plutonium margin. Burn-up is directly linked to power density and irradiation time, which are two tunable parameters of our SFR flexible model. Power density affects the number of fuel assemblies that are loaded in the core, and thus, the plutonium mass needed for each reloading. When power density is high, less fuel assemblies are loaded into the core meaning less plutonium is needed. Irradiation time defines the reloading frequency. SFR cores with long irradiation time will need less reloading which relieves constraints on plutonium margin. To sum up, SFR with high power density and long irradiation time, or in other words, working at high burn-ups, are easier to commission. The difference on plutonium margin between high burn-ups and low burn-ups can reach almost 650 tons which is significant regarding fleet objectives. For example, if the target fleet is supposed to be an intermediary step before commissioning a 100% SFR fleet, then fleet with high plutonium margin are more suitable. However, if the objective is to empty irradiated fuel storages to avoid having high plutonium mass in cooled irradiated fuels, then fleets working with low burn-up SFR are recommended.
To complete this analysis, Figure 13 shows the evolution over time of the mass of irradiated fuels stored for the viable trajectories. We are measuring both hot and cooled irradiated fuel in this case. This graphic is consistent with the previous one: in the case of high burn-ups, when the plutonium margin is maximal, the total mass of irradiated fuel is also maximal. For low burn-ups, the amount of irradiated fuels stored quickly decreases before stabilizing at 5000 tons approximatively. This supports the fact that low burn-up SFR can be key to empty irradiated fuel stocks. For high burn-ups, the total irradiated fuel mass seems to be decreasing over time without stabilizing. This is because we first reprocess the oldest PWR irradiated fuels (MOX and UOX) before starting to reprocess the irradiated SFR fuels. As PWR irradiated fuels contain less plutonium than SFR ones, it is necessary to reprocess a larger quantity of PWR irradiated fuels to get enough plutonium for SFR fresh fuel. This trend should stabilize afterwards, as Figure 12 shows that the plutonium margin is actually stabilized.
Among the viable trajectories, it is possible to add more criteria or constraints in order to choose the best SFR core. For example, the evolution of plutonium content in PWR MOX fuels can be an interesting metric to observe. Figure 14 shows the maximum plutonium content in PWR MOX fuels during the transition towards the PWR-SFR mixed fleet. As a reminder, this maximum plutonium content should be lower than 12% in order to ensure a negative void coefficient. It appears that this limitation is respected principally for SFR with high burn-ups. As it has been explained, for SFR with high burn-ups, less plutonium is necessary over the period studied to commission and feed the SFR, making it possible to keep the good grade plutonium, the one coming from irradiated UOX fuels, for PWR MOX fuels. Moreover, high burn ups SFR, in our case, are usually burner, meaning that the ratio UOX/MOX is favorable. In the case of low burn-ups for the SFR, the plutonium margin is smaller, meaning that it is necessary to partly use the good grade plutonium in the SFR fresh fuel. By taking into account the limitation on plutonium content in PWR MOX, the number of viable trajectories decreases and only cases with high burn-ups SFR are remaining.
Another way to discriminate the obtained results is to look at SFR performances and safety estimators. Figure 15 illustrates maximum DPA in SFR over time as an example of performance monitoring that is possible to do thanks to our flexible model. It appears that the higher the burn-up, the higher the maximum DPA. This behavior was expected as the fuel is exposed to higher neutron fluence at high burn-ups. This kind of monitoring is practical for the designer as it provides precious data that can help for some design choices. For example, it has been said that SFR that are working at high burn-ups lead to fleets with high plutonium margin, which is necessary to consider the potential commissioning of a 100% SFR fleet and close the fuel cycle. The use of an advance material such as ODS steel is then mandatory in order to reach higher burn-ups [25]. On the contrary, if the designer explicitly imposes the use of AIM1, then the scenarist has to work with lower burn-ups in the SFR or to change his trajectory set of hypotheses. In either case, performance monitoring is a great tool for the designer.
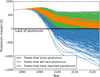 |
Fig. 7 Plutonium margin over time during the target fleet deployment. |
 |
Fig. 8 SFR designs for fleets that lack plutonium. |
 |
Fig. 9 SFR designs for fleets that will lack plutonium. |
 |
Fig. 10 SFR designs for fleets that have reached equilibrium. |
Plutonium mass in SFR core by unit of power produced (in [kg/MWth]) in function of core power and core power density.
 |
Fig. 11 SFR design distributions vs SFR average breeding ratio for the different types of trajectory. |
 |
Fig. 12 Plutonium margin over time in function of SFR average burn-up for viable trajectories. |
 |
Fig. 13 Mass of irradiated fuels stored over time in function of SFR average burn-up for viable trajectories. |
 |
Fig. 14 Maximum plutonium content in PWR MOX over time for the viable trajectories. |
 |
Fig. 15 Maximum DPA in SFR over time. |
4 Conclusions/perspectives
The sequential link that exists between reactor design and scenario calculations suffers from some limitations. The first one is that scenario calculations are most of the time made with fixed design. However, the scenarist could make a great use of a flexible reactor model to make some non viable trajectories work or to find new optimal trajectories. The flexible model settings would then constitute a base for the designer to work with. The second limitation comes from the hard exploitation of the data provided by scenario calculations. Actually, loaded fuel composition history could be used to monitor the performances of the reactors in the fleet. For these reasons, a coupling methodology between reactor design and scenario calculations based on the use of flexible reactor model has been developed and apply in the case of sodium-cooled fast reactors (SFR).
A flexible SFR model has been built by using a set of artificial neural networks (ANN) trained and validated on databases generated with the scientific code ERANOS. The base geometry is a RZ model of a V2B core, and the tunable parameters are the core thermal power, the power density, the fuel fraction, the irradiation time and the fertile blankets thickness. These global parameters make possible the exploration of a wide range of SFR designs. The flexible model serves as an equivalence model, as an irradiation model and is also used for performance monitoring. It is directly coupled to the scenario code COSI7.
To highlight the interest of the methodology, an application case has been presented and consists in the transition from a fleet similar to the French one that is replaced by a PWR UOX − PWR MOX fleet and then by a PWR − SFR mixed fleet that stabilizes plutonium inventory. As the SFR design is flexible, so is the target fleet, which composition is calculated thanks to a static analysis. Among the 720 SFR designs sampled, 255 lead to trajectories that don't lack plutonium. It has been observed that the most impactful SFR design parameters for trajectory viability are the power density, because it defines the in-core plutonium ass, the irradiation time, as it defines the frequency at which the plutonium stock is solicited, and the amount of breeding blankets, that enhance the core breeding ratio. A counter-intuitive result is that fleets with SFR breeder often lead to non-viable trajectories, or in other words, to a lack of plutonium during the transition phase. When the SFR is a breeder, the fleet that enables plutonium stabilization at steady state contains less PWR UOX, that produce plutonium, and more PWR MOX, that consume plutonium. As a result, more plutonium is required during the transition phase to commission all the reactors, which often lead to a lack of plutonium when the SFR is a breeder. For this reason and with the fixed hypotheses considered here, breeder SFR are the hardest to deploy, whereas burner SFR are the easiest.
Among viable trajectories, the ones with SFR that works at high burn-ups have a consequent plutonium margin that can reach almost 650 tons, while fleets with low burn-up SFR have almost no plutonium margin. If the main objective is to close the fuel cycle, then having a consequent plutonium margin seems better since commissioning a 100% SFR fleet requires a large amount of plutonium. If the main objective is more focused on relieving the pressure on storage, then the option with low burn-up SFR is the best. Actually, the difference for the irradiated fuels stored mass between high burn-ups and low burn-ups SFR can reach 30,000 tons.
Finally, two additional criteria have been taken into account to discriminate the viable trajectories. From the scenario point of view, maximum plutonium content in PWR MOX over time have been checked. This analysis has revealed that only the trajectories with high burn-ups SFR are able to respect the 12% constraints on the plutonium content. From the SFR design point of view, maximum DPA have been monitored thanks to our flexible model. This analysis has shown that to work with high burn-ups, the use of advanced alloys such as ODS steel will be mandatory. From the scenario study, constraints on the SFR design have thus been obtained.
To go further, this methodology could be useful in scenario robustness/resilience studies [26,27]. Actually, it would be possible to identify reactor design trends that enhance a trajectory ability to remain viable despite a disruption or a change of objectives. For example, it would be interesting to assess SFR design trends that give the more flexibility regarding the target fleet composition, whether it is 100% SFR or PWR − SFR mixed fleet. Doing so, it would be possible to find out if it exists a unique design trend to maximize a trajectory robustness or resilience, or if different families of reactor designs can be identified depending on the trajectory perturbation.
Conflict of interests
The authors declare that they have no competing interests to report.
Funding
This research did not receive any specific funding.
Data availability
Data associated with this article cannot be disclosed.
Author contribution statement
All the authors were involved in the preparation of the manuscript. All the authors have read and approved the final manuscript.
References
- Loi n°91-1381 du 30 décembre 1991 relative aux recherches sur la gestion des déchets radioactifs, 1991 [Google Scholar]
- Loi n° 2006-739 du 28 juin2006 de programme relative à la gestion durable des matières et déchets radioactifs, 2006 [Google Scholar]
- Ministère de la transition écologique et solidaire, Programmation Pluriannuelle de l'Energie, 2019 [Google Scholar]
- P. Sciora, L. Buiron, G. Rimpault, F. Varaine, A break even oxide fuel core for an innovative SFR: CEA neutronic studies, in Proceedings of the Global 2009 conference, Paris, France (2009) [Google Scholar]
- P. Sciora, D. Blanchet, L. Buiron, B. Fontaine, M. Vanier, F. Varaine, C. Venard, S. Massara, A.-C. Scholer, D. Verrier, Low void effect core design applied on 2400 MWth SFR reactor, in Proceedings of the ICAPP 2011 conference, Nice, France 5, 1 (2011) [Google Scholar]
- A. Languille, J. Garnier, P. Lo Pinto, CAPRA core studies − The oxide Reference Option, in Proceedings of the Global 1995 conference, Versailles, France (1995) [Google Scholar]
- A. Zaetta, B. Fontaine, P. Sciora, R. Lavastre, R. Jacqmin, V. Pascal, M. Pelletier, G. Mignot, A. Jankowiak, CADOR “Core with Adding DOppleR effect” concept application to sodium fast reactors, EPJ Nuclear Sci. Technol. 5, 1 (2019) [CrossRef] [EDP Sciences] [Google Scholar]
- C. Coquelet-Pascal, M. Tiphine, G. Krivtchik, D. Freynet, C. Cany, R. Eschbach, C. Chabert, COS I6: a tool for nuclear transition scenario studies and application to SFR deployment scenarios with minor actinide transmutation, Nucl. Technol. 192, 91–110 (2015) [CrossRef] [Google Scholar]
- T. Kooyman, P. Sciora, C. Coquelet-Pascal, Some considerations on the design of a small versatile fast reactor, in Proceedings of the ICAPP 2019 conference, Juan-les-pins, France (2019) [Google Scholar]
- G. Krivtchik, Analysis of unvertainty propagation in nuclear fuel cycle scenarios, PhD thesis, Université de Grenoble, 2014 [Google Scholar]
- D. Freynet, Développement d'une méthodologie pour l'optimisation multicritère de scénarios d'évolution du parc nucléaire, PhD thesis, Université de Grenoble, 2016 [Google Scholar]
- K. Ammar, Conception multi-physique et multi-objectif des coeurs de RNR-Na hétérogènes: développement d'une méthode d'optimisation sous incertitudes, PhD thesis, Université Paris-Sud 11, 2014 [Google Scholar]
- O. Fabbris, Optimisation multi-physique et multi-critère des coeurs de RNR-Na: application au concept CFV, PhD thesis, Université de Grenoble, 2014 [Google Scholar]
- T. Kooyman, Amélioration des performances de transmutation des actinides mineurs dans les réacteurs de quatrième génération: aspects cycle et coeurs, PhD thesis, Université d'Aix-Marseille, 2017 [Google Scholar]
- M. Ernoult, X. Doligez, N. Thiollière, A. Zakari-Issoufou, A. Bidaud, S. Bouneau, J. Clavel, F. Courtin, S. David, A. Somaini, Global and flexible models for Sodium-cooled Fast Reactors in fuel cycle simulations, Ann. Nucl. Energy 1128, 69–76 (2019) [CrossRef] [Google Scholar]
- J.-B. Blanchard, G. Damblin, J.-M. Martinez, G. Arnaud, F. Gaudier, The URANIE platform: an open-source software for optimisation, meta-modelling and uncertainty analysis, EPJ Nuclear Sci. Technol. 5, 4 (2019) [CrossRef] [EDP Sciences] [Google Scholar]
- J. Ruggieri, J. Tommasi, J. Lebrat, C. Suteau, D. Plisson-Rieunier, G. Rimpault, J. Sublet, ERANOS 2.1: International Code System for GEN IV Fast Reactor, in Proceedings of the ICAPP 2006 conference, Reno, Nevada, USA (2006) [Google Scholar]
- A. Koning, R. Forrest, M. Kellett, R. Mills, H. Henriksson, Y. Rugama, The JEFF-3.1 Nuclear Data Library, 2006 [Google Scholar]
- G. Martin, C. Coquelet-Pascal, Symbiotic equilibrium between sodium fast reactors and pressurized water reactors supplied with MOX fuel, Ann. Nucl. Energy 103, 356–362 (2017) [CrossRef] [Google Scholar]
- K. Tirel, T. Kooyman, C. Coquelet-Pascal, E. Merle, Possibility to stabilize plutonium inventory in a sodium-cooled small modular reactors − Pressurized water reactors fleet, Ann. Nucl. Energy 146, 107632 (2020) [CrossRef] [Google Scholar]
- S. Aniel, J. Bergeron, A. Puill, Evaluation of the maximum content of a MOX-fueled pressurized water reactor versus isotopic composition with respect to the void coefficient, Article publié lors d'un comité technique, n° XA9744117, Newby Bridge, Royaume Uni, 1995 [Google Scholar]
- P. Virtanen, R. Gommers, T.E. Oliphant, M. Haberland, T. Reddy, D. Cournapeau, E. Burovski, P. Peterson, W. Weckesser, J. Bright, S.J.v.d. Walt, M. Brett, J. Wilson, K.J. Millman, N. Mayorov, A.R.J. Nelson, E. Jones, R. Kern, E. Larson, C. Carey, I. Polat, Y. Feng, E.W. Moore, J. VanderPlas, D. Laxalde, J. Perktold, R. Cimrman, I. Henriksen, E. Quintero, C.R. Harris, A.M. Archibald, A.H. Ribeiro, F. Pedregosa, P. van Mulbregt, SciPy 1.0 Contributors, SciPy 1.0: fundamental algorithms for scientific computing in python, Nat. Methods 17, 261–272 (2020) [NASA ADS] [CrossRef] [Google Scholar]
- N. Thiollière, J.-B. Clavel, F. Courtin, X. Doligez, M. Ernoult, Z. Issoufou, G. Krivtchik, B. Leniau, B. Mouginot, A. Bidaud, S. David, V. Lebrin, C. Perigois, Y. Richet, A. Somaini, A methodology for performing sensitivity analysis in dynamic fuel cycle simulation studies applied to a PWR fleet simulated with the CLASS tool, EPJ Nuclear Sci. Technol. 4, 113 (2018) [Google Scholar]
- ANDRA, Inventaire national des matières et déchets radioactifs, Rapport de synthèse, 2018 [Google Scholar]
- D. Gelles, Microstructural examination of commercial ferritic alloys at 200 dpa, J. Nucl. Mater. 1, 293–298 (1996) [CrossRef] [Google Scholar]
- W. Zhou, Resilience analysis of nuclear fuel cycle scenarios, PhD thesis, Université de Grenoble, 2020 [Google Scholar]
- J. Liang, M. Ernoult, X. Doligez, S. David, S. Bouneau, N. Thiollière, G. Krivtchik, F. Courtin, W. Zhou, S. Tillement, Assessment of strategy robustness under disruption of objective in dynamic fuel cycle studies, Ann. Nucl. Energy 154, 108131 (2021) [CrossRef] [Google Scholar]
EFPD = Effective Full Power Day.
Cite this article as: Kévin Tirel, Timothée Kooyman, Christine Coquelet-Pascal, Elsa Merle, Coupling reactor design and scenario calculations: a promising method for scenario optimization, EPJ Nuclear Sci. Technol. 8, 7 (2022)
All Tables
Plutonium mass in SFR core by unit of power produced (in [kg/MWth]) in function of core power and core power density.
All Figures
|
Fig. 1 Illustration of our approach in comparison to the current logic. |
| In the text | |
|
Fig. 2 SFR flexible model inputs and outputs. |
| In the text | |
|
Fig. 3 RZ reference model of the V2B core. |
| In the text | |
|
Fig. 4 Plutonium flux in the steady state fleet. |
| In the text | |
|
Fig. 5 Fleet composition vs average SFR breeding ratio. |
| In the text | |
|
Fig. 6 Example of fleet evolution over time in the case of a given SFR. |
| In the text | |
|
Fig. 7 Plutonium margin over time during the target fleet deployment. |
| In the text | |
|
Fig. 8 SFR designs for fleets that lack plutonium. |
| In the text | |
|
Fig. 9 SFR designs for fleets that will lack plutonium. |
| In the text | |
|
Fig. 10 SFR designs for fleets that have reached equilibrium. |
| In the text | |
|
Fig. 11 SFR design distributions vs SFR average breeding ratio for the different types of trajectory. |
| In the text | |
|
Fig. 12 Plutonium margin over time in function of SFR average burn-up for viable trajectories. |
| In the text | |
|
Fig. 13 Mass of irradiated fuels stored over time in function of SFR average burn-up for viable trajectories. |
| In the text | |
|
Fig. 14 Maximum plutonium content in PWR MOX over time for the viable trajectories. |
| In the text | |
|
Fig. 15 Maximum DPA in SFR over time. |
| In the text | |
Current usage metrics show cumulative count of Article Views (full-text article views including HTML views, PDF and ePub downloads, according to the available data) and Abstracts Views on Vision4Press platform.
Data correspond to usage on the plateform after 2015. The current usage metrics is available 48-96 hours after online publication and is updated daily on week days.
Initial download of the metrics may take a while.