Fig. 4
Download original image
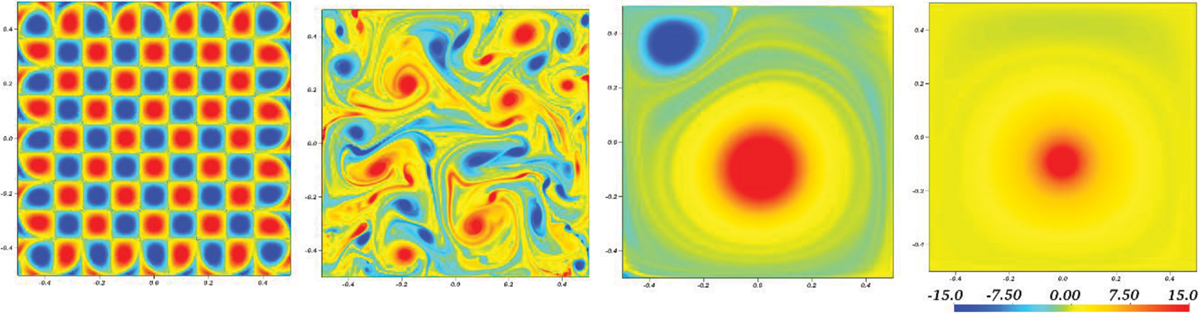
Colour plot of the vorticity field along a free decay 2D simulation in a square, from an array of Taylor-Green vortices to a minimal-enstrophy single vortex.
Current usage metrics show cumulative count of Article Views (full-text article views including HTML views, PDF and ePub downloads, according to the available data) and Abstracts Views on Vision4Press platform.
Data correspond to usage on the plateform after 2015. The current usage metrics is available 48-96 hours after online publication and is updated daily on week days.
Initial download of the metrics may take a while.