Open Access
Fig. 9
Download original image
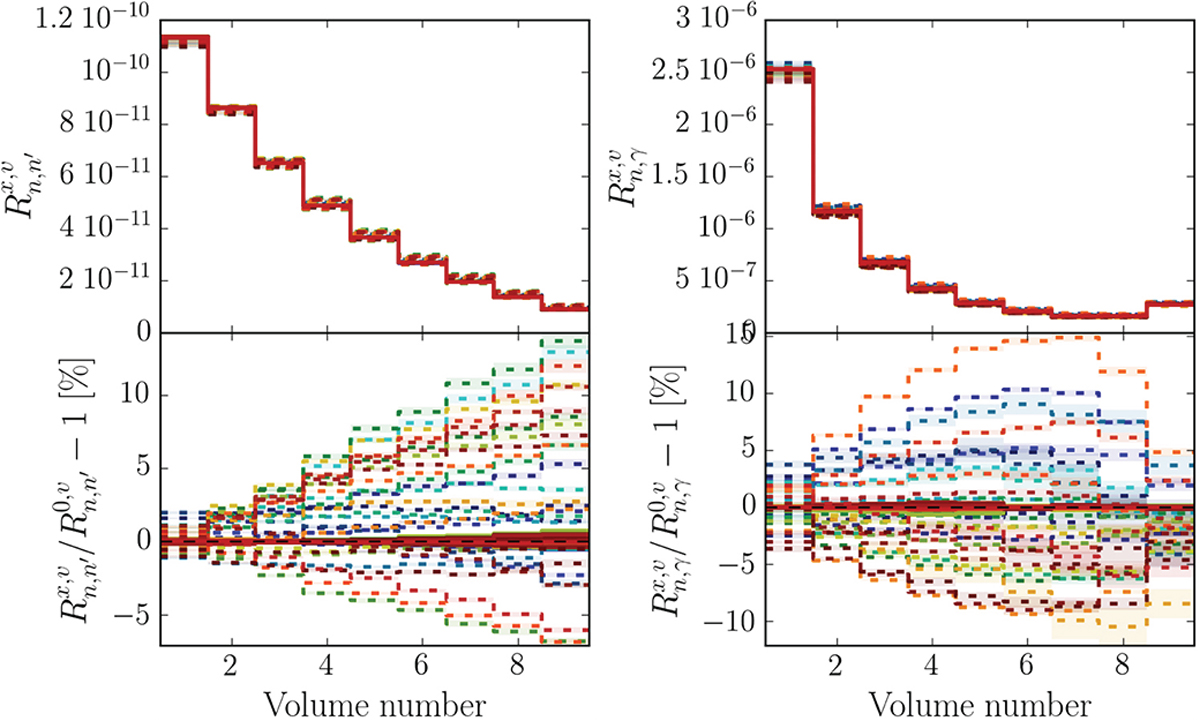
Reaction rates in the foil detectors for the indium inelastic (top-left) and capture (top-right) reactions; the differences between each ACE file and the first ’reference’ ACE file of the iron and the aluminium are represented in colours (middle) respectively in dashed and solid lines.
Current usage metrics show cumulative count of Article Views (full-text article views including HTML views, PDF and ePub downloads, according to the available data) and Abstracts Views on Vision4Press platform.
Data correspond to usage on the plateform after 2015. The current usage metrics is available 48-96 hours after online publication and is updated daily on week days.
Initial download of the metrics may take a while.