Open Access
Fig. 7
Download original image
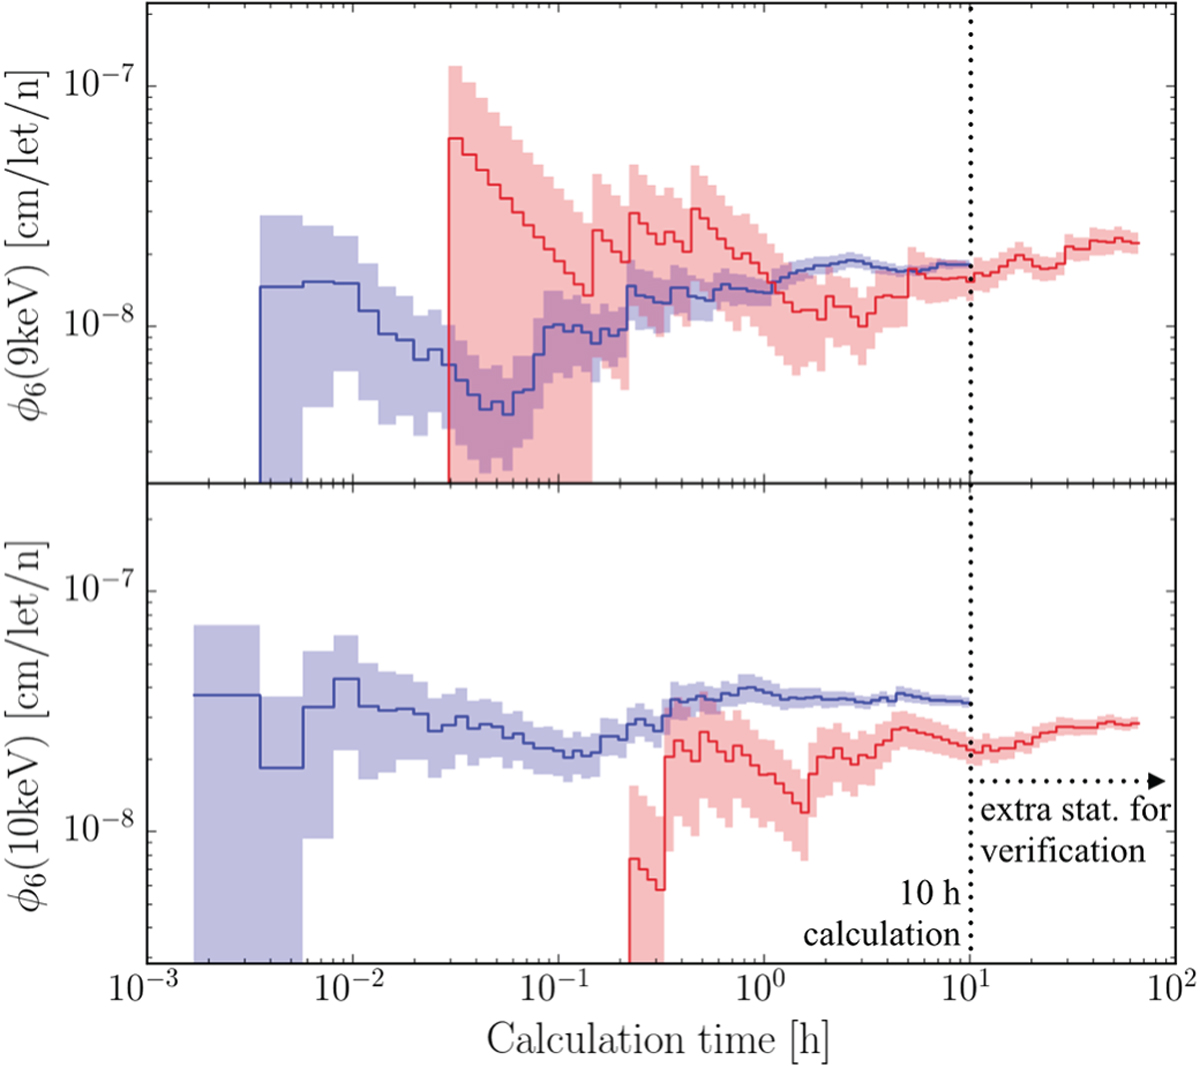
Neutron flux estimation as a function of the calculation time, for the specific bin with a residual of 4.13 at 10 h (bottom) and another bin for comparison (top). The red curve is the reference calculation without biasing, and the blue curve is the result with the biasing.
Current usage metrics show cumulative count of Article Views (full-text article views including HTML views, PDF and ePub downloads, according to the available data) and Abstracts Views on Vision4Press platform.
Data correspond to usage on the plateform after 2015. The current usage metrics is available 48-96 hours after online publication and is updated daily on week days.
Initial download of the metrics may take a while.