Open Access
Fig. 6
Download original image
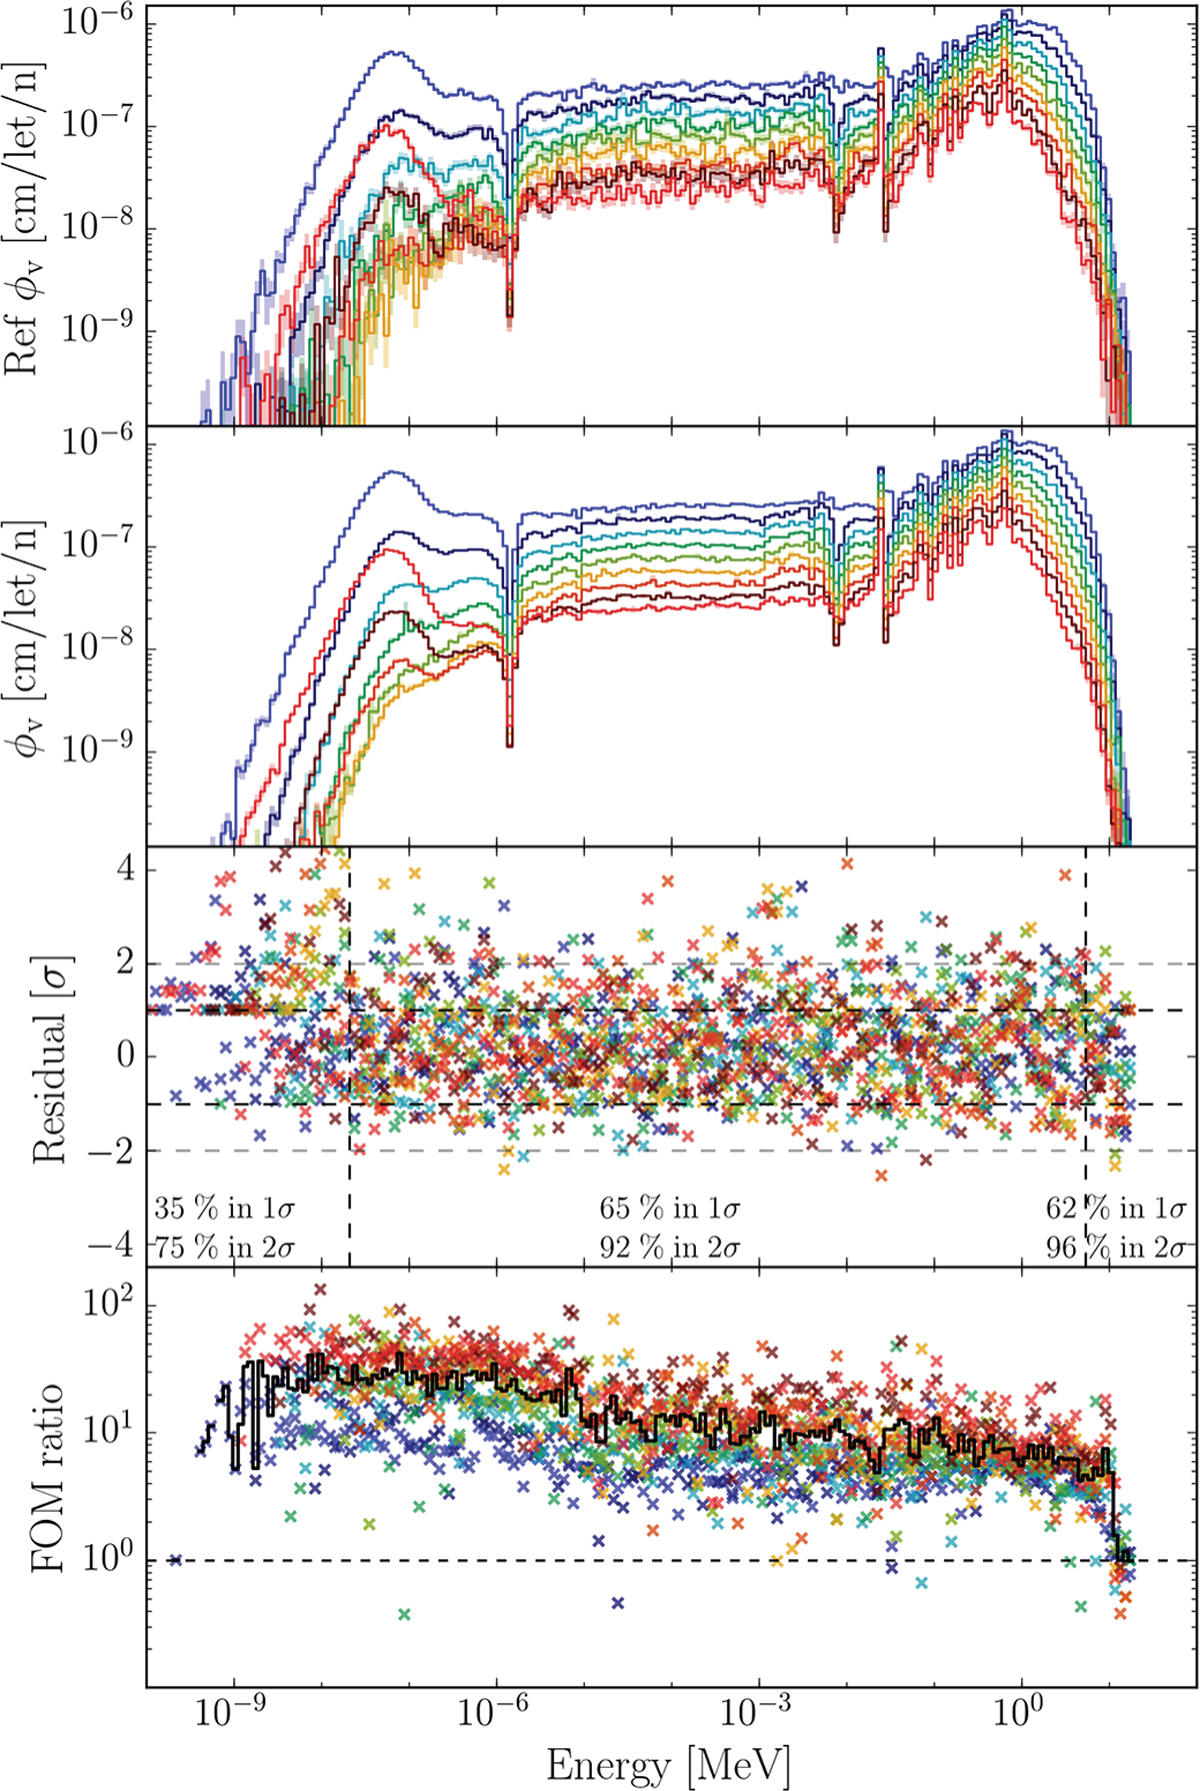
Neutron flux using a color gradient from blue to red when increasing the radial position of the dosimeter: without biasing as reference (top), with biasing (2nd line), residual (3rd line) and figure of merit (last line) with the average in black.
Current usage metrics show cumulative count of Article Views (full-text article views including HTML views, PDF and ePub downloads, according to the available data) and Abstracts Views on Vision4Press platform.
Data correspond to usage on the plateform after 2015. The current usage metrics is available 48-96 hours after online publication and is updated daily on week days.
Initial download of the metrics may take a while.