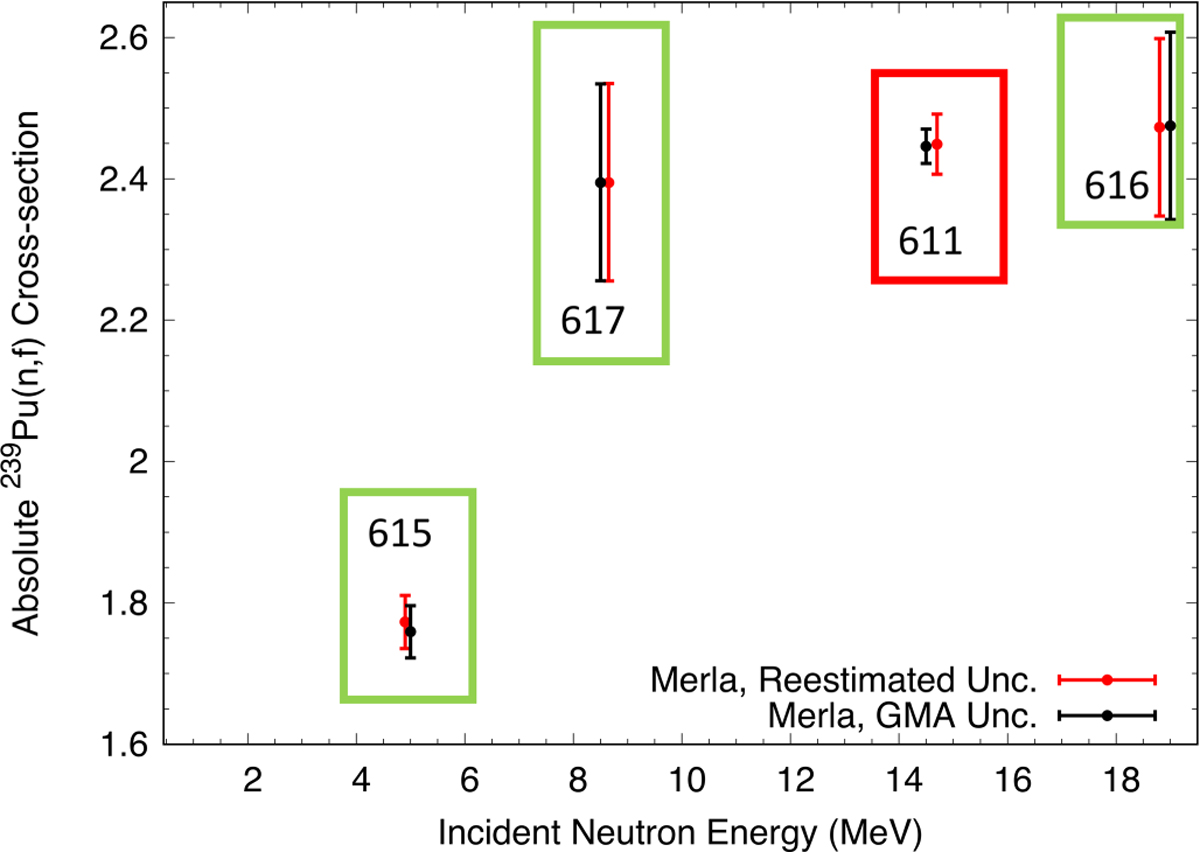
Fig. 1
Download original image
The data of Merla et al. [10–12] are shown as given in the file GMA.res (dated Feb. 3, 2017) of GMA and in EXFOR along with a reestimated total unc. The file GMA.res gives all experimental data with total uncertainties after data reduction to a common energy grid. Therefore, GMA E and cs values differ slightly from their EXFOR values.
Current usage metrics show cumulative count of Article Views (full-text article views including HTML views, PDF and ePub downloads, according to the available data) and Abstracts Views on Vision4Press platform.
Data correspond to usage on the plateform after 2015. The current usage metrics is available 48-96 hours after online publication and is updated daily on week days.
Initial download of the metrics may take a while.