| Issue |
EPJ Nuclear Sci. Technol.
Volume 3, 2017
|
|
|---|---|---|
| Article Number | 22 | |
| Number of page(s) | 15 | |
| DOI | https://doi.org/10.1051/epjn/2017012 | |
| Published online | 05 July 2017 | |
https://doi.org/10.1051/epjn/2017012
Regular Article
Artificial neural network surrogate development of equivalence models for nuclear data uncertainty propagation in scenario studies
Atomic Energy and Alternative Energies Commission, CEA, DEN, Reactor Studies Department (DER),
Cadarache,
13108
Saint-Paul-lez-Durance, France
* e-mail: This email address is being protected from spambots. You need JavaScript enabled to view it.
Received:
4
January
2017
Received in final form:
7
April
2017
Accepted:
9
May
2017
Published online: 5 July 2017
Abstract
Scenario studies simulate the whole fuel cycle over a period of time, from extraction of natural resources to geological storage. Through the comparison of different reactor fleet evolutions and fuel management options, they constitute a decision-making support. Consequently uncertainty propagation studies, which are necessary to assess the robustness of the studies, are strategic. Among numerous types of physical model in scenario computation that generate uncertainty, the equivalence models, built for calculating fresh fuel enrichment (for instance plutonium content in PWR MOX) so as to be representative of nominal fuel behavior, are very important. The equivalence condition is generally formulated in terms of end-of-cycle mean core reactivity. As this results from a physical computation, it is therefore associated with an uncertainty. A state-of-the-art of equivalence models is exposed and discussed. It is shown that the existing equivalent models implemented in scenario codes, such as COSI6, are not suited to uncertainty propagation computation, for the following reasons: (i) existing analytical models neglect irradiation, which has a strong impact on the result and its uncertainty; (ii) current black-box models are not suited to cross-section perturbations management; and (iii) models based on transport and depletion codes are too time-consuming for stochastic uncertainty propagation. A new type of equivalence model based on Artificial Neural Networks (ANN) has been developed, constructed with data calculated with neutron transport and depletion codes. The model inputs are the fresh fuel isotopy, the irradiation parameters (burnup, core fractionation, etc.), cross-sections perturbations and the equivalence criterion (for instance the core target reactivity in pcm at the end of the irradiation cycle). The model output is the fresh fuel content such that target reactivity is reached at the end of the irradiation cycle. Those models are built and then tested on databases calculated with APOLLO2 (for thermal spectra) and ERANOS (for fast spectra) reference deterministic transport codes. A short preliminary uncertainty propagation and ranking study is then performed for each equivalence models.
© G. Krivtchik et al., published by EDP Sciences, 2017
 This is an Open Access article distributed under the terms of the Creative Commons Attribution License (http://creativecommons.org/licenses/by/4.0), which permits unrestricted use, distribution, and reproduction in any medium, provided the original work is properly cited.
1 Introduction
1.1 Nuclear scenario studies
Scenario studies simulate the whole fuel cycle over a period of time, from extraction of natural resources to geological storage. Transition scenario studies compare different reactor fleet evolutions, such as introduction of SFR, and fuel management options, such as plutonium recycling or minor actinides partitioning and transmutation, for the future nuclear fuel cycle. Therefore, such codes constitute a decision-making support. Consequently uncertainty propagation studies, which are necessary to assess the robustness of the studies, are strategic. In the frame of the French act for waste management [1], these studies evaluate the sustainability of Sodium Fast Reactors (SFR) deployment in terms of plutonium availability, as well as the impact on fuel cycle facilities of minor actinides transmutation.
Scenario codes, such as COSI6 [2], contain advanced physical models, validated with reference codes, for cooling, depletion, and equivalence. These codes model the mass flows (actinides, fission products, etc.) and their isotopic composition between the different fuel cycle facilities in dynamic scenarios.
However, several parameters generate uncertainty in scenario studies: (i) nuclear data, such as cross-sections and fission yields; (ii) scenario parameters, for fuel reactors and facilities description, such as fuel burnup or reprocessing plant recovery rate.
Furthermore, recent scenarios have been produced through fuel cycle optimization [3–6], and consequently their sustainability may be more impacted by these sources of uncertainty. The aim of this work is to develop and use an uncertainty propagation method for dynamic transition scenario studies, and to apply this method to reference scenarios.
In this paper, after providing an overview of the whole uncertainty propagation process in scenario studies, an uncertainty propagation technique adapted to one of the physical models used in scenarios, namely the fresh fuel equivalence model, is exposed in more details. This model aims at calculating the fresh fuel fissile content such that the target end of cycle reactivity is reached.
1.2 Uncertainty propagation in nuclear scenarios
Different types of uncertainties have an impact on scenario studies. For instance, the following parameters are associated with uncertainties (although there are more uncertainties than just shown here):
-
–
nuclear data, used for depletion and equivalence models:
-
•
cross-sections: covariance matrices of a high number of nuclides, including actinides and fission products;
-
•
fission yields: spectrum-dependent fission yields uncertainties;
-
•
-
–
scenario parameters, for fuel, reactors and plants description:
-
•
commissioning dates and rates of the different fuel cycle plants;
-
•
fuel burnup and reactor power, yield, load factor, etc.;
-
•
reprocessing strategy (list of batches, fuel types, etc.).
-
•
As the scenario studies belong to the decision-making process, it is necessary to evaluate the impact of the uncertainties. The methodology adopted in order to calculate the impact of these uncertainties on the scenario results is stochastic: sampling the input variables according to their uncertainty probability density function enables to calculate the variance of the scenario results. However, the computation of a scenario with COSI6 lengths between a minute and more than ten hours, depending on the complexity of the scenario. Considering the amount of inputs to be sampled in order to perform a stochastic calculation of the propagated uncertainty, it appears necessary to reduce the calculation time. A scenario computation is a complex object. Recent scenario computations model the behavior and the interaction of dozens of reactors, fuel cycle facilities, mass flows; and timescales can introduce strong non-linearities with the presence of many threshold effects. Furthermore COSI6 bears both continuous and discontinuous models, including:
-
continuous: irradiation and cooling models, recovery rates, mass losses, etc.;
-
discontinuous: fuel management and reprocessing strategy (fuel batches are not homogenized).
A first uncertainty propagation method would be based on perturbation of analytical fuel cycle equations.
However, obtention of analytical formulae for the fuel cycle comes at the price of big simplifications and hypotheses [7] on fluxes, spectra, core geometry, equivalence models, cross-sections, etc. These hypotheses may have a significant impact on both results and their associated uncertainty.
Stochastic uncertainty propagation methods seem well suited to problems as complex as scenario studies: sampling input parameters according to their distribution, with consideration of proper correlation between parameters, and analysis of the system output (variance, correlations, etc.) gives information concerning uncertainty propagation in the system. This method does not require hypotheses nor physical simplification of the model, and is well adapted for interaction analysis between the different variables. One of the main drawbacks of this method is the computation time, and the number of evaluations required to compute variance, or other results of interest, with a satisfying precision. It is difficult to assess such number, but it increases with the number of parameters and the complexity of the system (the total amount of parameters associated with an uncertainty in the present studies is generally around 200).
In scenario studies performed with COSI6, the computation time heavily depends on the scenario complexity and details, the type of reactors, and scenario duration (generally more than 150 years). Taking into account the fact that a COSI6 simulation requires a high amount of RAM, the uncertainty propagation process reaches unreasonable timescales. Therefore, it is necessary to find a method to accelerate such computation.
Given that depletion calculations, which are performed with the code CESAR5.3 [8] represent approximately 95% of the total scenario simulation time, an optimization can be done, with the development and implementation of a surrogate models library of CESAR5.3 in COSI6. A surrogate model is an estimator of the output of a code according to its input, usually built with easy to calculate mathematical functions such as polynomials or neural networks. The different inputs of CESAR5.3 (initial composition for dozen of nuclides, burn-up, power) are sampled by coupling CESAR5.3 and URANIE [9], the CEA uncertainty platform. Several conditions on this sampling enable an optimal coverage of a CESAR5.3 library validity domain. For every sample, the isotopic composition obtained with CESAR5.3 after evolution is stored. Then statistical analysis of the input and output tables allows different strategies to model the behavior of CESAR5.3 on each library, i.e. building a surrogate model. Several quality tests are performed on each surrogate model to insure the prediction capability is satisfying.
Afterwards, a new routine implemented in COSI6 allows reading these surrogate models and using them in replacement of CESAR5.3 calculation. A preliminary study of the calculation time gain showed that the use of surrogate models allows stochastic calculation of the uncertainty propagation. The complete study is discussed in [10].
However, the irradiation model is not the only physical model impacted by uncertainties in the nuclear scenarios. The next section describes the problem of the equivalence model.
2 Equivalence models: overview
In PWR UOX reactors, fuel composed of enriched uranium is irradiated. For a given core, uranium enrichment is invariant, and was once defined such as the core respects a criterion, formulated in terms of reactivity, at the end of every irradiation cycle. This criterion ensures that, considering boron concentration and computation bias, the core is able to remain critical until irradiation cycle is over. However, the problem is different for other fuel types (MOX, Th-233U, repU, etc.) which are not directly made from natural elements. MOX fuel is composed of a mix of depleted uranium and plutonium, in which isotopic vector varies according to its origin; parameters include, inter alia, the nature of the fuel the plutonium comes from (PWR UOX, PWR MOX, SFR MOX, fuel, etc.) and burnup.
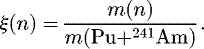
Plutonium isotopes do not contribute equally to reactivity and irradiation in general. For instance, 239Pu is an efficient fissile material, it has relatively high fission cross-section in the thermal domain, fissioning more often than capturing, and has a high multiplicity factor, whereas 240Pu captures more than it fissions. Therefore isotopic composition affects the so-called quality of plutonium. A simple measure of plutonium quality, in terms of reactivity, is the sum of fissile isotopes mass fractions:
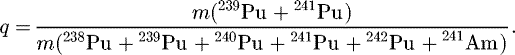 (1)
(1)
Intuitively, quality of a given plutonium vector is linked to the plutonium content necessary to maintain criticity over fuel irradiation: the higher the quality, the lower the plutonium content. However, this relation is qualitative, and gives no information on the numeric value of the content.
The concept of equivalence model generalizes the concept of isotopic quality to quantitative determination of fresh fuel mass content as a function of the isotopic vector:

3 Equivalence models: state-of-the-art
3.1 Presentation
This section summarizes the state of the art of equivalence models used in nuclear scenario computations, and provides a brief analysis of these models, principally in terms of bias and uncertainty propagation. The concepts of perturbative equivalence models, direct transport/depletion computation and tabulated models are exposed. These three models are already implemented in COSI6 [2].
3.2 Perturbative SFR MOX equivalence model
3.2.1 Equivalent plutonium content
The model described hereafter is often denoted as the “Baker and Ross formula”. Let H denote the Boltzmann operator, ρ the reactivity, ϕ and ϕ+ respectively the flux and adjoint flux of a system, ΔH the perturbation operator, P the production operator, and Δρ the reactivity variation due to ΔH. Application of first order perturbation theory on the system (fuel) for reactivity [11] gives:
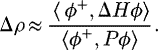 (2)
(2)
Let us consider that two fuel compositions are equivalent if their initial reactivity is equal. It is then possible to define an equivalent fuel composed of 238U and 239Pu only.
Three equivalent fuel compositions are considered:
-
the first (α) fuel defines the reference, its isotopic composition and Pu content are such that its initial reactivity is equal to the target reactivity;
-
the second fuel (β) is the equivalent fuel, composed of 238U and 239Pu. The Pu content of this fuel is called the equivalent plutonium content. This fuel is fictive, and is used as a bridge between a reference (α) and applications (γ);
-
the third fuel (γ) is a fuel whose isotopic composition is known, but not the Pu content. The objective is to find the Pu content of this fuel.
Let yi be the contents of the different isotopes in the first fuel:
 (3)
(3)
Let tβ be the plutonium mass content of the equivalent fuel:
 (4)
(4)
We define σ+(u), with u being the lethargy, σf the fission cross-section, σc the capture cross-section and ν the multiplicity, such as:
 (5)
(5)
We make the hypothesis that the isotopic composition of all three fuels are small enough that cross-sections are approximately the same. We model fuel β as a perturbation of fuel α. The numerator of equation (2) is null for two of the equivalent fuel compositions α and β:
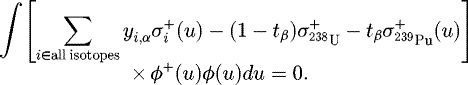 (6)
(6)
We define:
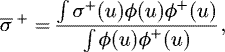 (7)
and
(7)
and
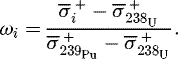 (8)
(8)
We obtain:
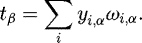 (9)
(9)
The parameter tβ is called the “equivalent plutonium content” of fuel α, and is equal to the actual plutonium content of the fictive fuel β.
We define, ξ(n) the isotopy of a nuclide n ∈ {Pu, 241Am}:
 (10)
(10)
Similarly, the isotopy of a nuclide n ∈ U is defined as:
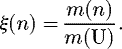 (11)
(11)
The expression of the plutonium content in the fuel γ such that γ is equivalent to α (and β) is:
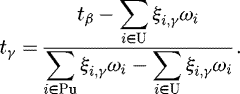 (12)
(12)
The weights ωi associated to reactions are computed on the system α using a lattice/core transport code, such as ERANOS [12] developed at CEA for fast reactors studies. The tβ is calculated once and for all, and used as a reference for the subsequent computations of tγ. As a consequence, only equation (12) is re-evaluated when the equivalence model is used, so as to avoid a new time-consuming ERANOS computation.
This model is implemented in COSI6 and was validated using direct computation with ERANOS [13].
3.2.2 Advantages and drawbacks
This method is easy to implement and to use. Furthermore, its analytical formulation permits to calculate derivatives in order to perform uncertainty propagation.
However, it has the following drawbacks:
-
equivalence is calculated before irradiation, and not at the end of a cycle, with the reactivity loss during irradiation depending on the system characteristics (including fresh fuel composition and cross-sections);
-
the method cannot be applied reliably to PWR because cross-sections are very dependent on slight changes in the system;
-
equation (2) is defined in the frame of the theory of perturbations, and only is reliable in the (fuzzy) domain of small perturbations of the isotopic composition (which tend to change a lot in centuries-long scenarios).
3.3 Iterative calculation of the fissile content using transport/depletion code
3.3.1 Overview
This method calculates iteratively the fissile content using a transport + depletion code, until reaching a satisfying end-of-cycle core reactivity. This method would be compatible with both thermal and fast spectra. However only its application to fast spectrum (with ERANOS) is implemented in COSI6. For this case, the example of a SFR CFV core (Cœur Faible Vidange, meaning low sodium void core) [14] whose fractionation is 5, is directly used. The CFV core is divided into five fractions. Let Lcycle be the burnup associated to one irradiation cycle. At the end of a cycle, the core average burnup is:
 (13)
(13)
On a side note, generalization of this formula is shown in equation (14), n being the core fractionation and  the burnup of an assembly at unloading:
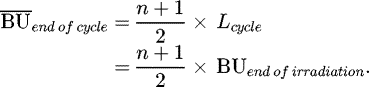 (14)
(14)
The equivalence condition is : the core reactivity at the end of a cycle must be equal to a target reactivity. Let {yi} be the plutonium isotopic vector. The equivalence problem is to find the plutonium content t such that core reaches the target reactivity  at the end of a cycle:
 (15)
(15)
A method implemented in ERANOS [12] resolves this equation iteratively using Newton’s method, with a variable number of steps. Each step corresponds to a new irradiation calculation. The calculated plutonium content satisfies the following condition (ϵ is a convergence criterion):
 (16)
(16)
Numerical values for the computation usually are:
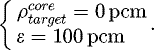 (17)
(17)
3.3.2 Advantages and drawbacks
The advantage is the accuracy and robustness of the result. As it is directly evaluated by a transport code, it is not subject to approximations due to use of first order perturbation theory or statistical estimators. It is worth noting that performing perturbed transport computation allows to compute perturbed equivalence content.
However, the main drawback of this method is the computation time. Indeed as computation of one content takes around one hour (depending on the system), and implementation of the equivalence condition in COSI6 is such that several equivalence computations are often required to evaluate the plutonium content of one batch. Indeed plutonium is obtained from reprocessing of different fuel batches in which composition may differ, and if the plutonium mass required to make fresh fuel is superior to the plutonium mass available in a batch, plutonium from reprocessing of another batch, which has a different composition, has to be added. This phenomenon changes fresh fuel isotopy. Therefore, another iteration of transport computations has to be performed. As a consequence, a single scenario computation using ERANOS as the equivalence model often requires more than 24 hours.
This method is suited to reference computation and validation of other equivalence methods. However, computation of equivalence using this method for stochastic uncertainty propagation is not possible due to constraints on computation time.
3.4 Tabulated PWR MOX equivalence model
3.4.1 Presentation
Several tabulated equivalence models for PWR MOX are implemented in COSI6. These models use regression techniques such as multiple linear regressions on intervals or polynomial regressions, parameterized in isotopy, end-of-irradiation burnup and fractionation. Parameters are obtained through perturbative transport computations. Those models are validated on the MOX fuel loaded in CPY reactors of the French fleet.
3.4.2 Advantages and drawbacks
The main advantage is that these models give an accurate representation of the PWR MOX actual content. However, they cannot perform uncertainty propagation, as they are not parameterized with nuclear data. Furthermore, as they consist in regressions, it is not possible to obtain analytical expressions of the impact of perturbations as in Section 3.2.
3.5 Conclusions
All the models listed in the previous sections cannot be used to perform nuclear data uncertainty propagation studies. Hence, the construction of an equivalence model based on the analytical expression of reactivity at the end of an irradiation cycle would be interesting. However this expression is too complex to be evaluated without strong hypotheses.
Performing nuclear data uncertainty propagation in equivalence models requires constructing a model with the following properties:
-
equivalence condition at the end of a cycle;
-
possibility of parameterization with nuclear data;
-
short computation time.
Innovative models fulfilling these conditions are presented in Section 4.
4 Data-driven equivalence models
4.1 Introduction
Statistical estimators based on perturbative transport computations are good candidates for uncertainty propagation in equivalence models. First of all, they can estimate the fuel enrichment so as to reach a given equivalence condition at the end of a cycle. Then, if their construction process includes parameterization of the transport computation with nuclear data, they can perform nuclear data uncertainty propagation. Finally, as estimators, their computation time is most likely negligible compared to a scenario computation time.
In this work, the nuclear data uncertainty is given as energy-integrated covariance matrix. To obtain this matrix, a 33-groups covariance matrix based on the ENDF B-VII evaluation [15] is produced with NJOY [16]. Then, this matrix is collapsed with different spectra of interest (PWR MOX, SFR), using the method described in [10] to obtain spectrum-dependent, energy-integrated covariance matrices. The matrices used in the present work are detailed in [10].
4.2 SFR MOX equivalence models
4.2.1 Introduction
In Sections 4.2.2 and 4.2.3, enrichment estimators based on unperturbed computations are built, so as to obtain relatively simple equivalence models for scenario studies and compare them. Then, in Section 4.2.4 the method is refined and cross-section perturbations are added as parameters.
4.2.2 Method A: estimator based on iterative transport computations
4.2.2.1 Description of the method
The idea of method A is to produce an estimator of the results given by the method described in Section 3.3.1. The method must produce, as a result, an estimator of the plutonium content as a function of the core plutonium isotopy, such that the reactivity at the end of a cycle is null. The problem is to find  such that:
 (18)
(18)
The following method is proposed:
-
sample the plutonium isotopic vector {yi};
-
for each isotopic vector {yi}, evaluate t such as
 using ERANOS Newton’s algorithm;
 -
build an estimator
 of the plutonium content evaluated by ERANOS.
4.2.2.2 Application
Sampling: This section shows the application of method A to create a fissile fuel in SFR CFV core equivalence model. Parameters are sampled uniformly, and the intervals of variation are summarized in Table 1. Intervals are determined so as to include the whole isotopic range in the scenario studies they are used in e.g. SFR deployment in France, etc. URANIE is used to build the sample.
The plutonium vector isotopy is taken into account, as well as the 235U content in depleted uranium. The isotopy y(240Pu) is large enough to be used as a buffer for the other isotopes.
ERANOS returns the volumetric enrichment in plutonium e. This result is used to calculate the mass enrichment t as a function of the U and Pu density d such as:
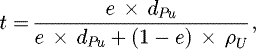 (19)
with
(19)
with
 (20)
(20)
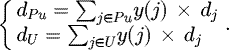
The design of experiments (DOE) consists in 600 points sampled according to Table 1, using LHS as the sampling algorithm. A uniform distribution was chosen for every parameter, with the exception of 240Pu and 238U which are used to normalize the Pu and U sum of isotopes. For each point of the DOE, an ERANOS computation of the plutonium content is performed such as 
Figure 1 illustrates the plutonium content computed by ERANOS as a function of y(239Pu). It is worth noting that the higher the 239Pu isotopy is, the lower the Pu content necessary to achieve  is. The vertical dispersion shows the impact of parameters other than y(239Pu) on the plutonium content.
Regression: The artificial neural networks (ANN) with a single hidden layer were chosen as a regression technique. In our case, URANIE is used to build the ANN. Their generic expression is given in equation (21). S(x) is the activation function defined in equation (22) (here chosen as a sigmoid). The number of neurons in the hidden layer H will be obtained via an optimization study. N is the dimension of xi (i.e. the number of parameters), λi and ωij are real constants calculated by the regression algorithm using backpropagation.
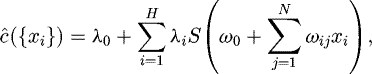 (21)
(21)
 (22)
(22)
Once the surrogate model is created, it is necessary to test it. The results of the surrogate models and CESAR5.3 are compared on a test sample, independent from the training sample. Detailed explanations concerning the validation process are given in references [10,17,4]. We decide to build ANN estimators of the plutonium content. The ANN parameters are those described in Table 1. The complexity of this model is relatively low. Consequently, there is no reason for the choice of ANN over polynomial regressions or any other estimator except the presence in COSI6 of a previous implementation of ANN for another study [10] dedicated to irradiation surrogate models. First, the DOE (Design of Experiment) is divided into two subsets of equal size (300 points): a construction sample (or learning database), and a test sample (or validation database).
The ANN estimators are built based on the construction sample. Table 2 summarizes a few quality criteria for each ANN, calculated on the test sample.
Even the simplest ANN estimator, composed of one neuron in the hidden layer, returns a satisfying plutonium content. On the contrary, increasing too much the number of neurons reduces the overall quality of the estimator because the construction sample is relatively small. According to Table 2, an ANN containing three neurons in the hidden layer seems adequate. For the rest of this study, only the ANN containing three neurons in the hidden layer will be considered.
Figure 2 represents the application of the plutonium content estimator on the test base as a function of the plutonium content, and Figure 3 the absolute error  as a function of t. Globally the prediction quality is satisfying, the ANN with three neurons is a reliable estimator of the plutonium content, and the absolute error remains very low.
In Figure 3 one can remark two zones where prediction worsens: for 22% < t < 23% and t > 25%. The next paragraph is a short study of the reasons for this lack of fit.
Analysis of the lack of fit: Figure 4 represents the evolution of  computed by ERANOS as function of the plutonium content. One can observe two non-physical jumps, around 23% and 25.5% contents. These jumps are due to a difference in the number of iterations in the use of Newton’s algorithm, and their magnitude is the same order as ϵ. Therefore, they are present too in the data-driven function
  .
.
Since these jumps affect the results, it is necessary to assess their impact on the quality of the ANN estimators, but reproducing the results through reproducing a series of ERANOS computation would be time-consuming. However, Figure 1 (and a brief linearity analysis) showed that the plutonium content is close to be linear as a function of the different parameters. A possibility is to represent the difference between a linear regression of the plutonium content, introducing very little non-linearity, and the ANN. A local strong non-linearity would be significant of a non-physical phenomenon.
Figure 5 shows the difference between the ANN estimators of the plutonium content, and the linear regression, for a given plutonium vector, as a function of the plutonium content, for different numbers of hidden neurons. One can remark the jump around a plutonium content of 22.5%, as in Figure 4. Consequently, one can conclude that the jump in reactivity (magnitude: ϵ = 100 pcm) has indeed an impact on the plutonium content, and that the jump is learnt by the ANN estimators. However, the jump in plutonium content is relatively low: approximately 0.2% in relative terms, which means that a plutonium content of 22% will be estimated as 22 ± 0.044%, which is still adequate. Hence this phenomenon does not degrade drastically the prediction of plutonium content as a function of the isotopy. A first solution for this problem would be to reduce ϵ. However computation time would increase accordingly. Another explanation is provided in Section 4.2.3.
Intervals of variation for SFR CFV fissile fuel equivalence model, method A.
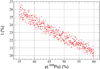 |
Fig. 1 Plutonium content such that |
Bias of the Pu content estimators for SFR CFV equivalence model, method A.
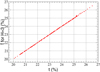 |
Fig. 2 Comparison of the plutonium content (%) computed with ERANOS and its ANN estimator, using H = 3 neurons in hidden layer, method A. |
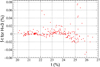 |
Fig. 3 Absolute error of the Pu content (%) estimator as a function of the Pu content (%), using H = 3 neurons in the hidden layer, method A. |
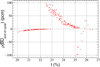 |
Fig. 4 End of cycle reactivity as a function of the plutonium content for SFR CFV core, calculated with ERANOS. |
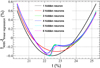 |
Fig. 5 Relative difference with linear regression as a function of the plutonium content for SFR CFV core. |
4.2.3 Method B: straightforward estimation
4.2.3.1 Description of the method
Method B is based on the observation that a significant part of the computation time in method A comes from the successive ERANOS calculations in the Newton’s algorithm: for each point in the design of experiments, it usually takes 3 or more iterations to compute the plutonium content. Furthermore, although useful, the intermediate results (for instance core reactivity computed for a given composition and a plutonium content giving more or less than the target reactivity) are not used. These intermediate results return  . Although they do not correspond to a core composition that will actually have to be calculated by an equivalence model, those results can be used as trends.
Computing a series of ρcore using randomly generated {yi} and t will provide a set of data {ρcore, {yi}, t}. Using this data set, one can build the function 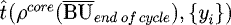 which estimates the plutonium content according to a composition and the core reactivity at the end of irradiation.
If one imposes as an argument  , the estimator will predict the plutonium content as a function of the core composition such as the end of cycle reactivity is
  , which constitutes a solution to our problem.
4.2.3.2 Application
Sampling: This section shows the application of method B to create a CFV core equivalence model. Parameters are sampled uniformly, and the intervals of variation are summarized in Table 3. The core is divided into two zones of different volumetric enrichment, e1 and e2. The mean volumetric enrichment and the plutonium content are calculated as a function of e1 and e2. It has to be noted that contrary to Section 4.2.2, the enrichment is sampled.
The DOE consists in 600 points sampled uniformly according to Table 3, using LHS. For each point of the DOE, an ERANOS computation of the end of cycle reactivity  is performed.
In this method, the plutonium volumetric enrichment and isotopic vector are uncorrelated; however, the end of cycle reactivity depends on both those sets of parameters. Figures 6 and 7 illustrate the end of cycle reactivity as a function of the plutonium content and the 239Pu isotopy. Both plutonium content and isotopy impact the reactivity at the end of cycle. The dispersion in Figure 6 comes from the isotopic vector, and the dispersion in Figure 7 comes from the isotopic vector (except 239Pu) and the plutonium content.
Regression: Our aim is to build ANN estimators of the plutonium content such as  . The parameters of the ANN are Pu content, Pu isotopic vector and
  .
.
The same method as in Section 4.2.2 is used: division of the DOE into two subsets, construction of the ANN on the first one and testing on the second one, selection of the most adequate number of neurons in the hidden layer, denoted by H in the Table 4. Table 4 summarizes a few quality criteria for each ANN, calculated on the test sample.
There are two main differences in the results of methods A and B.
-
The ANN containing one hidden neuron has poor prediction properties in method B, whereas it is not so different from other estimators in method A. This phenomenon probably comes from the fact that in method B there is one more parameter,
 , which interacts with other parameters in a non-negligible manner, which is not taken into account with only one neuron;
 -
ANN containing three or more hidden neurons are much better with method B than with method A. A plausible explanation is the absence of jump in plutonium content linked to Newton’s method.
According to these results, we choose to use an ANN with 5 hidden neurons for the rest of the study. It is worth noting that the number of neurons is case-dependent, and should generally be determined by a screening or an optimization study.
Figure 8 represents the application of this estimator of the plutonium content on the same DOE as in method A (iterative computation of the Pu content with ERANOS). One can observe that this ANN is a reliable estimator of the plutonium content computed iteratively by ERANOS. The method also generates less lack of fit in the regions wherein method A introduced non-linear trends due to algorithm-dependent jumps. However, as discussed earlier in this paper, those jumps do not represent physical trends, and the local linearization provided by method B appears preferable. Overall one can conclude that method B produces better estimators than method A. Furthermore, the sample construction of method B is faster because of the absence of transport iterations – in other words method B learns trends from data that are useless from the point of view of method A.
Intervals of variation for CFV equivalence model, method B.
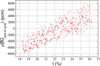 |
Fig. 6 End of cycle reactivity as a function of the plutonium content for SFR CFV core, method B. |
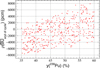 |
Fig. 7 End of cycle reactivity as a function of the 239Pu isotopy for SFR CFV core, method B. |
Bias of SFR CFV Pu content estimators, calculated on the test sample, method B.
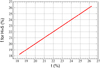 |
Fig. 8 Comparison of the plutonium content computed iteratively with ERANOS and the ANN estimator made according to method B (H = 5 neurons in hidden layer). |
4.2.4 Equivalence models for uncertainty propagation studies
4.2.4.1 Introduction
The previous sections were aimed at producing accurate SFR fuel equivalence models for scenario studies. These models have a low intrinsic bias, they fit the physical models in a very accurate way. However, they do not take nuclear data into account, although these data may have a significant impact on the equivalence criteria, and consequently on the fuel enrichment.
4.2.4.2 Parameters
The aim of this section is to build an equivalence model able to perform nuclear data uncertainty propagation in scenario studies.
In the present study, the impact of the capture and fission cross-section uncertainty of 14 isotopes is considered: 235U, 238U, 238Pu, 239Pu, 240Pu, 241Pu, 242Pu, 241Am, 243Am, 237Np, 242Cm, 243Cm, 244Cm, 245Cm.
This list should be extended in future works in order to include:
-
fission and capture cross-section uncertainties of other isotopes including the capture cross-sections of fission products;
-
scattering cross-section uncertainty;
-
fission yields uncertainty;
-
effective fission energy uncertainty;
-
decay energy uncertainty;
Table 5 summarizes the parameters taken into account (tagged “Yes”) or neglected (tagged “No”). Neglected parameters are only taken into account as their mean value. While one can reasonably expect to expand the model to a larger number of parameters (e.g. wisely selected actinides and fission products cross-sections), taking into account all the parameters described in Table 5 into account at once for all of the nuclides seems beyond the capabilities of the present method, mostly due to regression step.
Summary of the parameters taken into account for SFR CFV equivalence models.
4.2.4.3 Sampling
The number of parameters for equivalence model able to perform cross-sections uncertainty propagation (37) is much higher than in the case of the regular equivalence model (9). Therefore the DOE size has to be increased. We chose to build our models on a DOE containing 2000 points, divided equally into a construction and test subsets. It is worth noting that the sample size was determined after a sensitivity study (evolution of the accuracy as a function of the sample size) not detailed in this work.
The sample construction for this equivalence model is based on the same principles as method B: the plutonium content is sampled, and there is no iteration. The content and isotopy parameters are the same as defined in Table 3. Cross-section perturbations are defined according to their uncertainty distribution: they are sampled as uniform distributions, on intervals [− 3σ; +3σ], σ being the standard deviation. The numerical values of cross-sections perturbations used in this work come from ENDF B-VII. Correlations between cross-sections are not taken into account during this process. Since this is DOE construction, and not uncertainty propagation, this step does not generate bias.
4.2.4.4 Regression
ANN estimators of the plutonium content are built as a function of the parameters previously described. The complexity of this model is much higher than in Section 4.2.3 because of the increased number of input parameters, and their interaction.
Table 6 summarizes some quality criteria for each ANN, calculated on the test sample.
One can observe that the quality tends to increase with the number of neurons. The best results are obtained for 9 neurons in the hidden layer. Results with 10 neurons in the hidden layer are inferior. This may be due to different phenomena:
-
the algorithm does not fully converge because of the high number of weights to assess;
-
there may be some overfitting.
The results obtained with 9 neurons in the hidden layer are satisfying, and consequently this model will be used in the next studies.
Bias of SFR CFV Pu content estimators for cross-sections uncertainty propagation, calculated on the test sample.
4.2.4.5 Uncertainty propagation
For a given plutonium vector, the content and the associated uncertainty are calculated, resulting from cross-sections uncertainty. Stochastic uncertainty propagation is performed. ANN equivalence model with 9 neurons in the hidden layer is used. Computation is done for the plutonium vector shown in Table 7, which is extracted from previous scenario studies [10]. Cross-sections were attributed to the SFR uncertainty calculated in [10], and correlations are taken into account.
Let t be the mass plutonium content, SD(t) its standard deviation and RSD(t) its relative standard deviation. We obtain: t = 0.223, SD(t) = 0.017, RSD(t) = 7.7%.
This plutonium content uncertainty is high. This value only considered cross-sections uncertainty, and the fresh fuel isotopy is fixed. In the case of scenario computations, both cross-sections and fresh fuel isotopy are subject to uncertainty.
The variance of the plutonium content was analyzed. Since the model is very light in terms of memory and its execution is fast, it is possible to perform direct computation. For different parameters, the following quantity is computed, representing a first order part of variance PV i of parameter i :
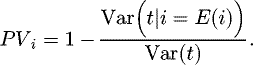 (23)
(23)
This indicator shows the reduction of variance resulting from the hypothetical exact determination of a parameter. 10000 runs are performed for each cross-section to evaluate the part of variance. The results are presented in Table 8. The biggest contributors are in bold.
The cross-section generating most plutonium content uncertainty is σc(239Pu). Other significant cross-sections are σc(241Pu) and σc(235Pu). This result is interesting because a better knowledge of 239Pu capture cross-section would significantly decrease the plutonium content uncertainty.
It is worth noting that the sum of parts of variances is less than 100%. It suggests that interactions between parameters have a significant contribution to the total variance. For instance, the part of variance obtained for σc(239Pu) and σc(241Pu) at the same time is 92% (>64% + 6%). It was verified that this non-negligible interaction was not a artifact resulting from the use of the ANN outside of their boundaries, using a DOE for uncertainty propagation truncated to the domain of the regression DOE ([−3σ; +3σ] for each cross-section). The origin of the interaction is not known at the moment, but several phenomena will be investigated in further work, including competition between the different reactions and spectral shift.
One can remark that the contribution of curium isotopes to the variance is very low. The contribution of all the Cm isotopes considered at the same times is lower than 0.1%.
Plutonium vector for SFR CFV equivalence model study.
Cross-sections uncertainty ranking for SFR CFV equivalence model.
4.3 PWR MOX equivalence model
4.3.1 Description of the method
Equivalence models for PWR MOX fuel are constructed approximately as for SFR MOX equivalence models described in Section 4.2.4: the isotopic vector and the plutonium content of the fresh fuel are sampled, the cross-section perturbations are taken into account, and the reactivity at the end of the cycle is computed using transport calculation.
However, there is a difference between these models: burnup has to be taken into account for PWR MOX models. Indeed, several types of fuel corresponding to several different burnup values were irradiated in cores, and the plutonium content has to be calculated accordingly.
Equation (14) shows the expression of the end of cycle burnup as a function of the length of cycle and the core fractionation. We denote k∞ the infinite multiplication factor and ρ∞ the associated reactivity. Our method consists in building an estimator of the plutonium content, such that ρ∞ reaches a given target reactivity  at the variable end-of-cycle burnup.
4.3.2 Application
4.3.2.1 Overview
The transport and evolution calculation is based on an APOLLO2 [18] data set of PWR MOX AFA3G fuel assembly in PWR UOX (3.7% enrichment) environment, and the environment has a fixed composition equal to UOX fuel irradiated at 23GWd/tHM. Transport equation is solved with collision probability method. APOLLO2 computes the value of k∞ when the end of cycle burnup is reached. According to Reference [19], the reference reactivity at the end of cycle is +3900pcm. This value is supposed to take into account both physical uncertainties and computational bias. In practice, we can choose to use  , or simply fit the uncertainty propagation equivalence model to a pre-existing equivalence model using
  as a parameter.
4.3.2.2 Sampling
Parameters taken into account are described in Table 9. They are sampled without any correlation (except for the isotopy of 240Pu which depends on the other nuclides). We denote y(j) the isotopy of nuclide j in fresh fuel. The burnup range is chosen such as every PWR MOX end of cycle burnup (not end of irradiation burnup) in a typical scenario study of the French fleet is within the domain of validity of the equivalence model.
Intervals of variation for PWR MOX equivalence model.
4.3.2.3 Regression
ANN estimators of the plutonium content are built as a function of the parameters previously described.
Table 10 summarizes a few quality criteria for each ANN, calculated on the test sample.
The bias tends to be higher than in the case of SFR MOX reactors. Indeed, the fuel behavior (evolution of the content as a function of isotopy and burnup such that the equivalence criterion is satisfied) is much less linear in PWR MOX reactors. However the mean bias remains satisfying.
One can observe that the quality tends to increase with the number of neurons. The best results, obtained for H=10 neurons in the hidden layer, are satisfying; consequently this model will be used in the next studies.
Mean bias of the PWR MOX Pu content estimators for uncertainty propagation, calculated on the test sample.
4.3.3 Analysis of the model
4.3.3.1 Introduction
The previous equivalence model will be used for uncertainty propagation in scenario studies. However, in order to understand its behavior during a scenario computation, it is possible to use the model separately and perform both uncertainty propagation and ranking studies to observe which uncertainty values have a large impact on the plutonium content.
4.3.3.2 Uncertainty propagation
For a given plutonium vector, the uncertainty associated to the content is calculated as a function of cross-sections uncertainty. The computation is done for two different plutonium vectors, shown in Table 11. Two burnups at the end of irradiation are considered: 46GWd/tHM and 35GWd/tHM. The core fractionation is 3 in both cases. PWR MOX cross-sections were attributed the uncertainty value calculated in [10], and the correlations are taken into account.
Let t be the plutonium mass content, SD(t) its standard deviation and RSD(t) its relative standard deviation. The results are as follows:
-
vector 1, 46GWd/tHM: t = 0.0843, SD(t) = 0.0043, RSD(t) = 5.1%;
-
vector 2, 46GWd/tHM: t = 0.0727, SD(t) = 0.0036, RSD(t) = 5.0%;
-
vector 1, 35GWd/tHM: t = 0.0665, SD(t) = 0.0039, RSD(t) = 5.9%.
One can observe that the plutonium vector 1 requires a higher plutonium content to reach  at the end of irradiation. This result comes from the fact that overall quality of vector 1 is much lower than vector 2: the ratio of fissile isotopes (239,241Pu) is lower. Of course reaching a higher burnup also requires a higher plutonium content.
The uncertainty value is lower than in the case of SFR fuel. However, it only considers capture and fission cross-sections uncertainties for several heavy nuclides, but the cross-section uncertainty for fission products is not considered here, although they vastly contribute to the reactivity loss. The uncertainty resulting from fission products cross-sections will be assessed in a further study.
It has to be noted that in the present study, the fresh fuel isotopy is being fixed. However, in the case of scenario studies, not only cross-sections are subject to uncertainty, but the fresh fuel isotopy depends on cross-sections, because it is determined by previous equivalence and irradiation models, which are subject to cross-sections uncertainty. Therefore, cross-sections have an impact through both (direct effect) equivalence computation and (indirect effect) fresh fuel composition. Such impact will be assessed in a further study in the case of PWR MOX.
As a consequence it is necessary to assess the plutonium content uncertainty in a scenario. One can expect a higher uncertainty in that case.
Plutonium vectors for PWR MOX equivalence model study.
4.3.3.3 Ranking
The cross-sections whose contribution to the plutonium content uncertainty is high are determined using equation (23) again. Results are presented in Table 12. The biggest contributors (PVi > 1%) are in bold.
One can observe that the part of variance scarcely varies with the plutonium vector and the burnup.
In every case, the most influent cross-sections are: σc(238U), σf(239Pu), σc(235U), σf(235U), σc(239Pu), σf(241Pu) and σc(241Pu). In this case as well, there is still a strong interaction between the different parameters, the sum of separated effects being less than 100%. It is also worth noting that most of the uncertainty is generated by more diversified cross-sections than in the case of the SFR core.
Cross-sections uncertainty ranking for PWR MOX equivalence model.
5 Conclusions and perspectives
Equivalence model calculates the fresh fuel enrichment or fissile content as a function of the isotopic composition and other parameters. The equivalence criterion used in scenario studies with COSI6 is generally the end of cycle reactivity.
A new type of equivalence model, able to perform uncertainty propagation studies, was created in this work, based on statistical estimators such as ANN. The estimators required for the creation of a dedicated learning database were constructed using {depletion + transport} computations, performed with reference codes. Those ANN surrogate-based models enable the propagation of cross-section uncertainties in scenario computations and were created in the case of SFR CFV and PWR MOX fuels.
Preliminary uncertainty propagation and ranking studies were performed using these models. It appears that the fresh fuel content uncertainty is high, and is mostly due to a small amount of cross-sections, including:
-
in thermal spectrum: σc(238U); σf(239Pu); σc(239Pu); σc(235U);
-
in fast spectrum: σc(239Pu); σc(241Pu).
Other than their uncertainty propagation capabilities, those equivalence models have shown a high precision despite their simplicity and are associated with a precise domain of validity, which is very valuable in the frame of scenario studies.
The awaited perspectives include the construction of a new PWR repU equivalence model using the same method, and refinement of the present models:
-
equivalence models based on cores computations for PWR MOX;
-
development of new equivalence criteria, such as dpa (displacements per atom) or linear power, in the case of SFR cores;
-
management of other sources of uncertainty;
-
validation of the uncertainty propagation method in scenarios through equivalence models by coupling COSI6 with ERANOS using perturbed nuclear data.
The impact of the cross-sections in the equivalence model on the nuclear scenario results (including their interaction with depletion calculations) must also be assessed.
As explained in the introduction, the uncertainty propagation in the fresh fuel equivalence model is only a step in the process of uncertainty propagation in complete scenario studies. In regard to the nuclear data, aside from the equivalence model, the uncertainty propagation must be performed in the depletion models, and the results of both models must be linked coherently.
Acknowledgments
The authors wish to thank Joël Le Mer and EDF R&D for their continuous support in this study.
References
- Loi no2006-739 du 28 juin 2006 de programme relative à la gestion durable des matières et déchets radioactifs (2006) [Google Scholar]
- C. Coquelet-Pascal et al., COSI6: a tool for nuclear transition scenario studies and application to SFR deployment scenarios with minor actinide transmutation, Nucl. Technol. 192, 91 (2015) [CrossRef] [Google Scholar]
- C. Coquelet-Pascal, M. Meyer, R. Eschbach, C. Chabert, C. Garzenne, P. Barbrault, L. Van Den Durpel, T. Duquesnoy, M. Caron-Charles, B. Carlier, J.-C. Lefevre, Comparison of different scenarios for the deployment of fast reactors in France − results obtained with COSI, in Proc. of GLOBAL 2011 (2011) [Google Scholar]
- D. Freynet, C. Coquelet-Pascal, R. Eschbach, G. Krivtchik, E. Merle-Lucotte, Multiobjective optimization of nuclear fleet evolution scenarios using COSI, in Proc. of GLOBAL 2015 Conference (2015) [Google Scholar]
- M. Tiphine et al., Simulations of progressive potential scenarios of Pu multirecycling in SFR and associated phase-out in the French Nuclear Power Fleet, in Proc. of GLOBAL 2015 Conference (2015) [Google Scholar]
- C. Chabert et al., Considerations on industrial feasibility of scenarios with the progressive deployment of Pu multirecycling in SFRs in the French Nuclear Power Fleet, in Proc. of GLOBAL 2015 Conference (2015) [Google Scholar]
- R. Craplet, J. Ahn, Mathematical modeling and its applications for mass flow in a nuclear fuel cycle, Nucl. Technol. 177, 314 (2012) [Google Scholar]
- J.M. Vidal, R. Eschbach, A. Launay, C. Binet, J.F. Thro, CESAR5.3: an industrial tool for nuclear fuel and waste characterization with associated qualification − 12067, in WM2012 Conference (2012) [Google Scholar]
- F. Gaudier, URANIE: the CEA/DEN uncertainty and sensitivity platform, in Sixth International Conference on Sensitivity Analysis of Model Output (Elsevier, 2010), Vol. 2, pp. 7660–7661 [Google Scholar]
- G. Krivtchik, Analysis of Uncertainty Propagation in Nuclear Fuel Cycle Scenarios, PhD thesis, Ecole doctorale I-MEP2, 2014 [Google Scholar]
- P. Reuss, Précis de neutronique (EDP Sciences, 2003) [Google Scholar]
- G. Rimpault, D. Plisson, J. Tommasi, R. Jacqmin, J.-M. Rieunier, D. Verrier, D. Biron, The ERANOS code and data system for fast reactors neutronic analyses, in Proc. of PHYSOR 2002 (2002) [Google Scholar]
- C. Coquelet-Pascal et al., Validation of physical models used in scenarios studies by coupling COSI with ERANOS package, in Proc. of GLOBAL 2011 (2011) [Google Scholar]
- B. Fontaine, N. Devictor, P. Le Coz, A. Zaetta, D. Verwaerde, J.-M. Hamy, The French R&D on SFR core design and ASTRID project, in Proceedings of GLOBAL 2011, Paper No. 432757 (2011) [Google Scholar]
- M.B. Chadwick, M. Herman, P. Obližinský et al., ENDF/B-VII.1 nuclear data for science and technology: cross sections, covariances, fission products yields and decay data, Nucl. Data Sheets 112, 2287 (2011) [Google Scholar]
- R.E. MacFarlane, A.C. Kahler, Methods for processing ENDF B-II with NJOY, Nucl. Data Sheets 111, 2739 (2010) [Google Scholar]
- G. Krivtchik, C. Coquelet-Pascal, P. Blaise, C. Garzenne, J. Le Mer, Development of depletion code surrogate models for uncertainty propagation in scenario studies, in Proc. of SNA-MC 2013 Conference (2013) [Google Scholar]
- A. Santamarina, D. Bernard, P. Blaise, L. Erradi, P. Leconte, R. Le Tellier, C. Vaglio, J.-F. Vidal, APOLLO2.8: a validated code package for PWR neutronics calculations, in Advances in Nuclear Fuel Management IV (ANFM 2009), Hilton Island, South Carolina, USA (2009) [Google Scholar]
- D. Azzoug, Etude phénoménologique du comportement des combustibles au plutonium dans les cycles de réacteurs eau. Elaboration d'un modèle d'équivalence des plutoniums, PhD thesis, Université de Paris-Sud, Centre d'Orsay, 1990 [Google Scholar]
Cite this article as: Guillaume Krivtchik, Patrick Blaise, Christine Coquelet-Pascal, Artificial neural network surrogate development of equivalence models for nuclear data uncertainty propagation in scenario studies, EPJ Nuclear Sci. Technol. 3, 22 (2017)
All Tables
Bias of SFR CFV Pu content estimators for cross-sections uncertainty propagation, calculated on the test sample.
Mean bias of the PWR MOX Pu content estimators for uncertainty propagation, calculated on the test sample.
All Figures
|
Fig. 1 Plutonium content such that |
| In the text | |
|
Fig. 2 Comparison of the plutonium content (%) computed with ERANOS and its ANN estimator, using H = 3 neurons in hidden layer, method A. |
| In the text | |
|
Fig. 3 Absolute error of the Pu content (%) estimator as a function of the Pu content (%), using H = 3 neurons in the hidden layer, method A. |
| In the text | |
|
Fig. 4 End of cycle reactivity as a function of the plutonium content for SFR CFV core, calculated with ERANOS. |
| In the text | |
|
Fig. 5 Relative difference with linear regression as a function of the plutonium content for SFR CFV core. |
| In the text | |
|
Fig. 6 End of cycle reactivity as a function of the plutonium content for SFR CFV core, method B. |
| In the text | |
|
Fig. 7 End of cycle reactivity as a function of the 239Pu isotopy for SFR CFV core, method B. |
| In the text | |
|
Fig. 8 Comparison of the plutonium content computed iteratively with ERANOS and the ANN estimator made according to method B (H = 5 neurons in hidden layer). |
| In the text | |
Current usage metrics show cumulative count of Article Views (full-text article views including HTML views, PDF and ePub downloads, according to the available data) and Abstracts Views on Vision4Press platform.
Data correspond to usage on the plateform after 2015. The current usage metrics is available 48-96 hours after online publication and is updated daily on week days.
Initial download of the metrics may take a while.