


Fig. 13.
Download original image
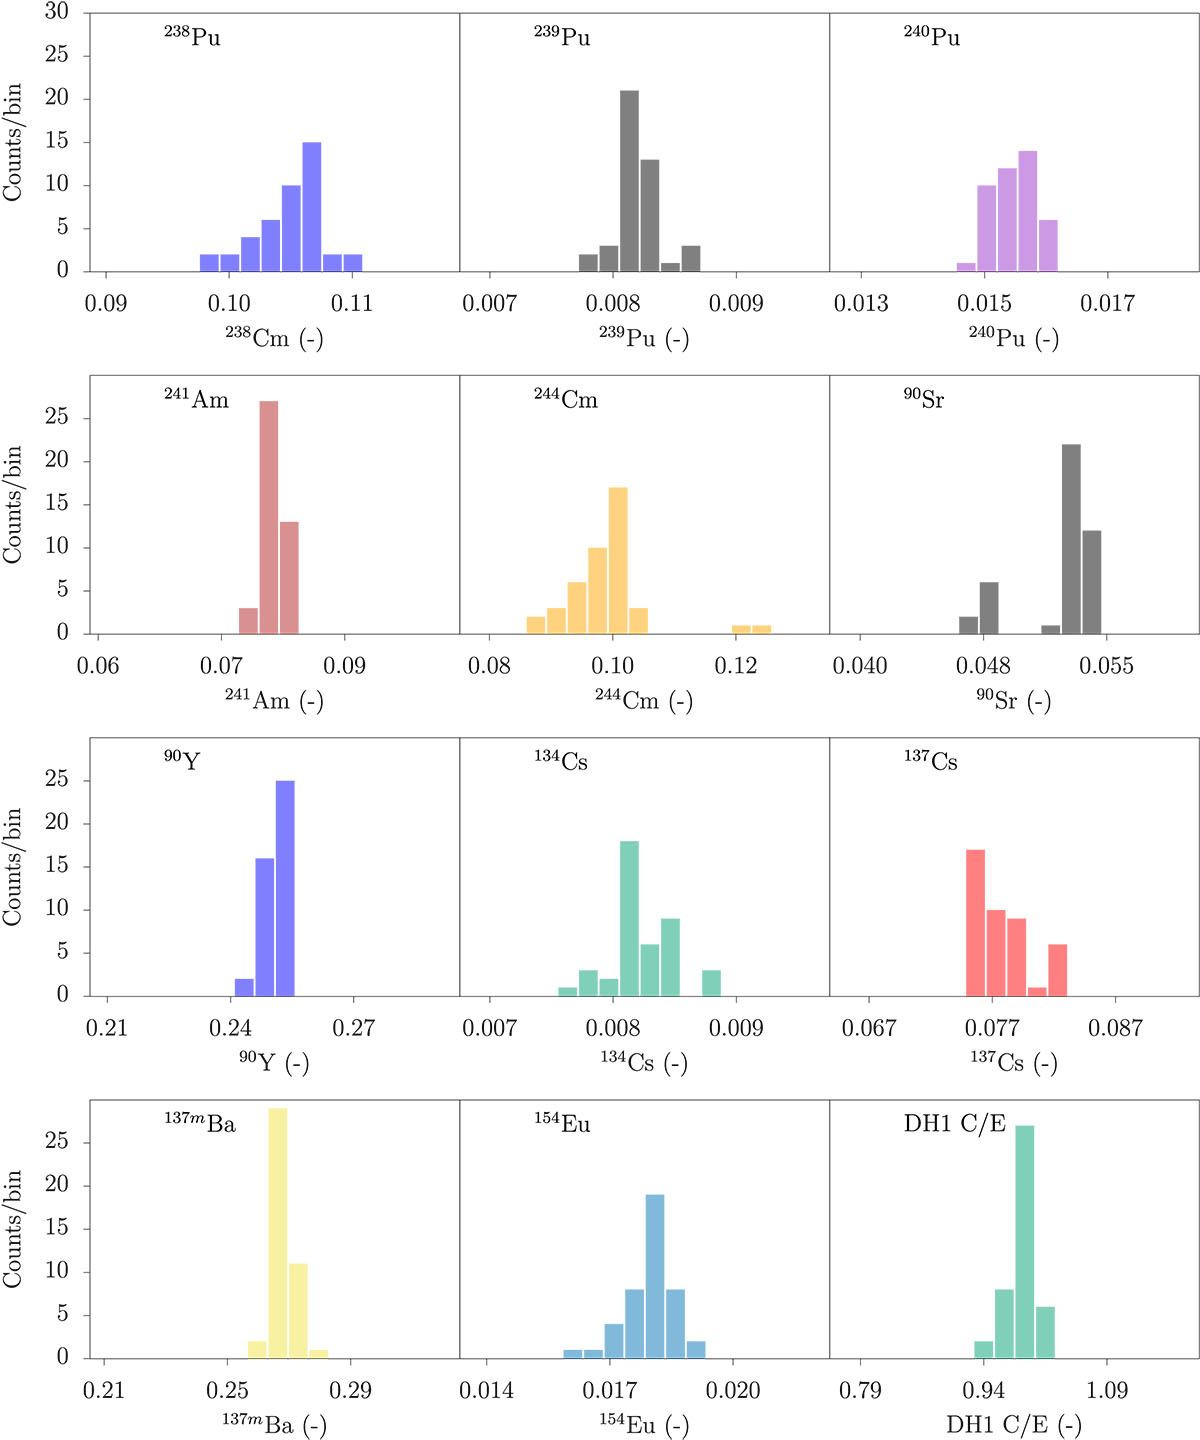
Histograms from participants’ values for the 11 most important decay heat contributors for the cooling time corresponding to the first decay heat measurement DH1 (5823 days). X-scales: contribution to the total decay heat. Bottom right: histogram of the C/E values for the DH1.
Current usage metrics show cumulative count of Article Views (full-text article views including HTML views, PDF and ePub downloads, according to the available data) and Abstracts Views on Vision4Press platform.
Data correspond to usage on the plateform after 2015. The current usage metrics is available 48-96 hours after online publication and is updated daily on week days.
Initial download of the metrics may take a while.