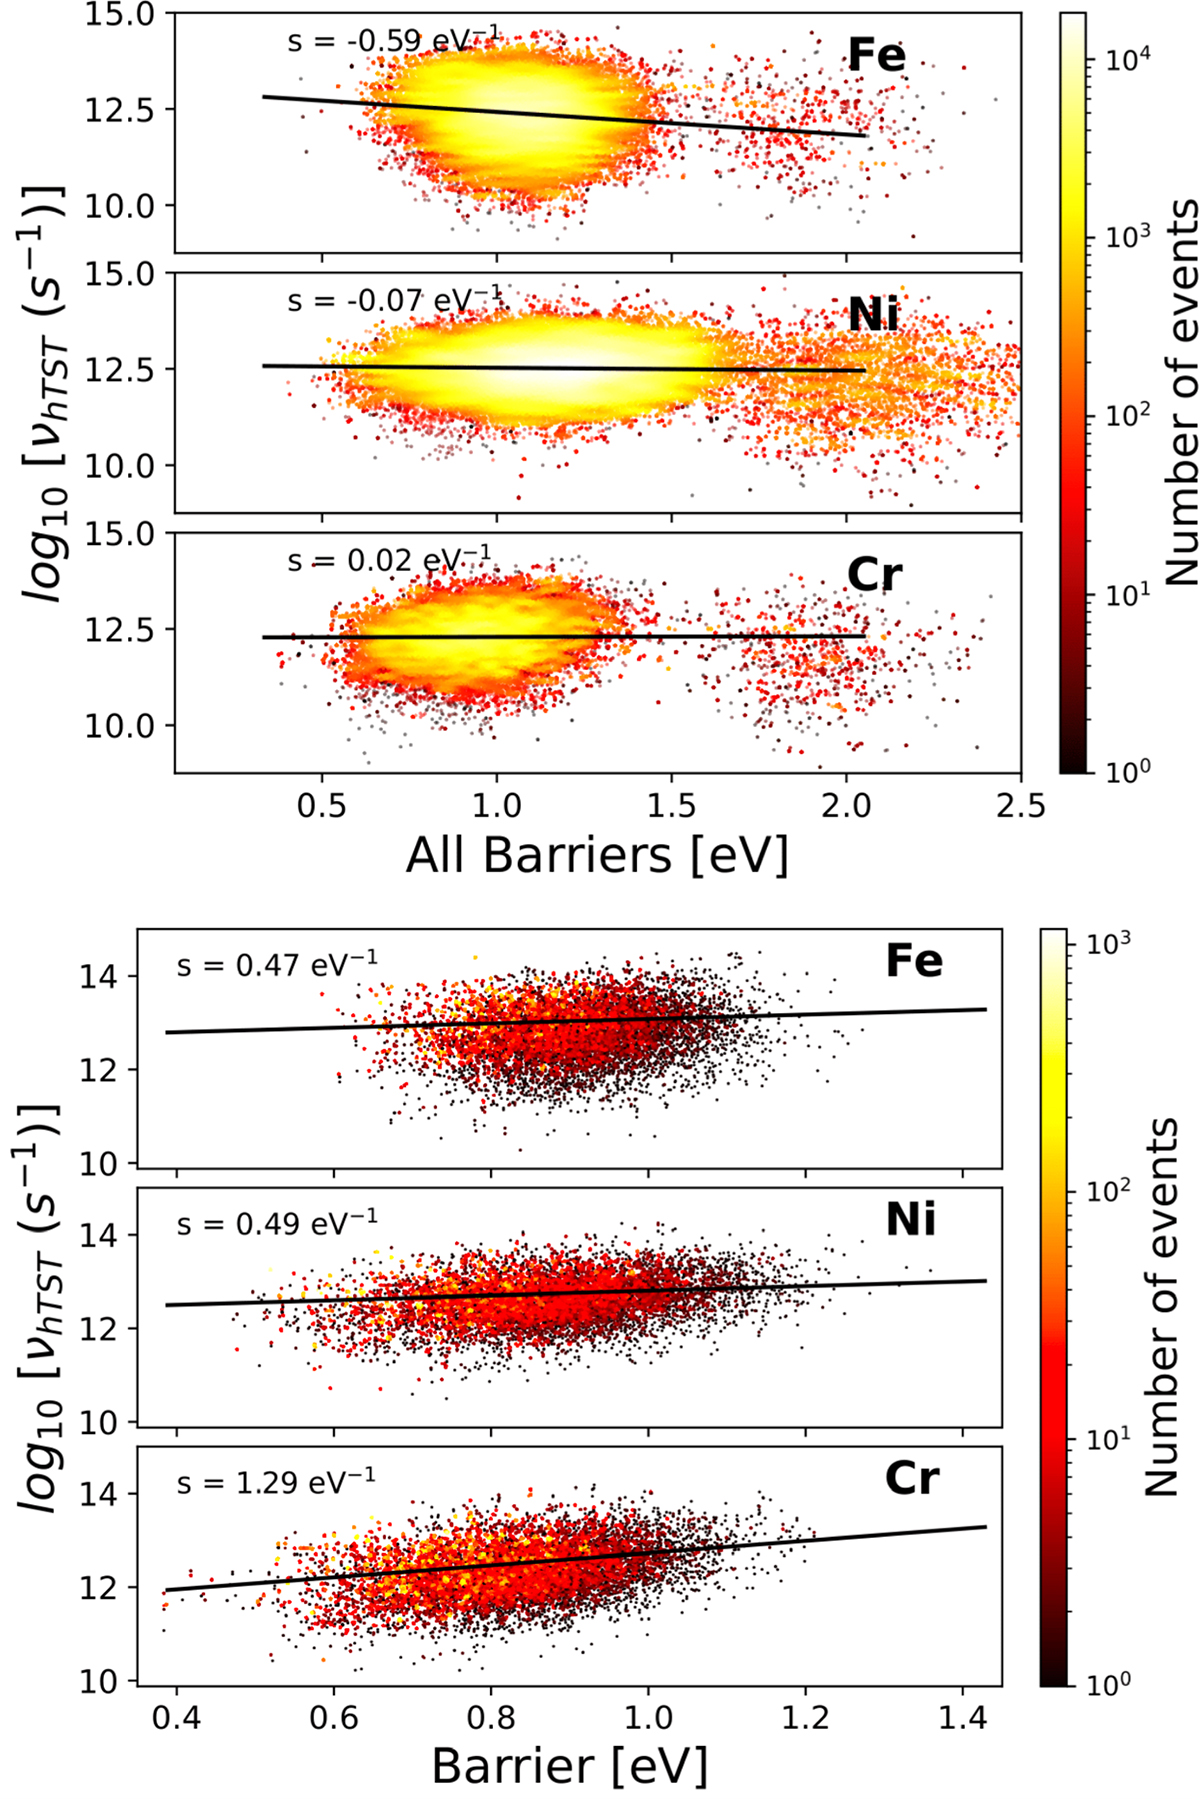
Fig. 12.
Download original image
Logarithmic values of hTST prefactors plotted against their corresponding energy barriers for Fe, Ni, and Cr. (top) All the possible events from the simulations are included, with compensation effects determined via linear fits to events with barriers above 0.3 eV, yielding slopes of −0.587(0.006) eV−1 (Fe), −0.070(0.002) eV−1 (Ni), and 0.017(0.004) eV−1 (Cr). (bottom) A curated subset of selected events above 0.3 eV shows compensation slopes of 0.47(0.02) eV−1, 0.49(0.02) eV−1, and 1.29(0.04) eV−1 for Fe, Ni, and Cr, respectively. Values in parentheses represent the standard deviation of the linear fit [48].
Current usage metrics show cumulative count of Article Views (full-text article views including HTML views, PDF and ePub downloads, according to the available data) and Abstracts Views on Vision4Press platform.
Data correspond to usage on the plateform after 2015. The current usage metrics is available 48-96 hours after online publication and is updated daily on week days.
Initial download of the metrics may take a while.