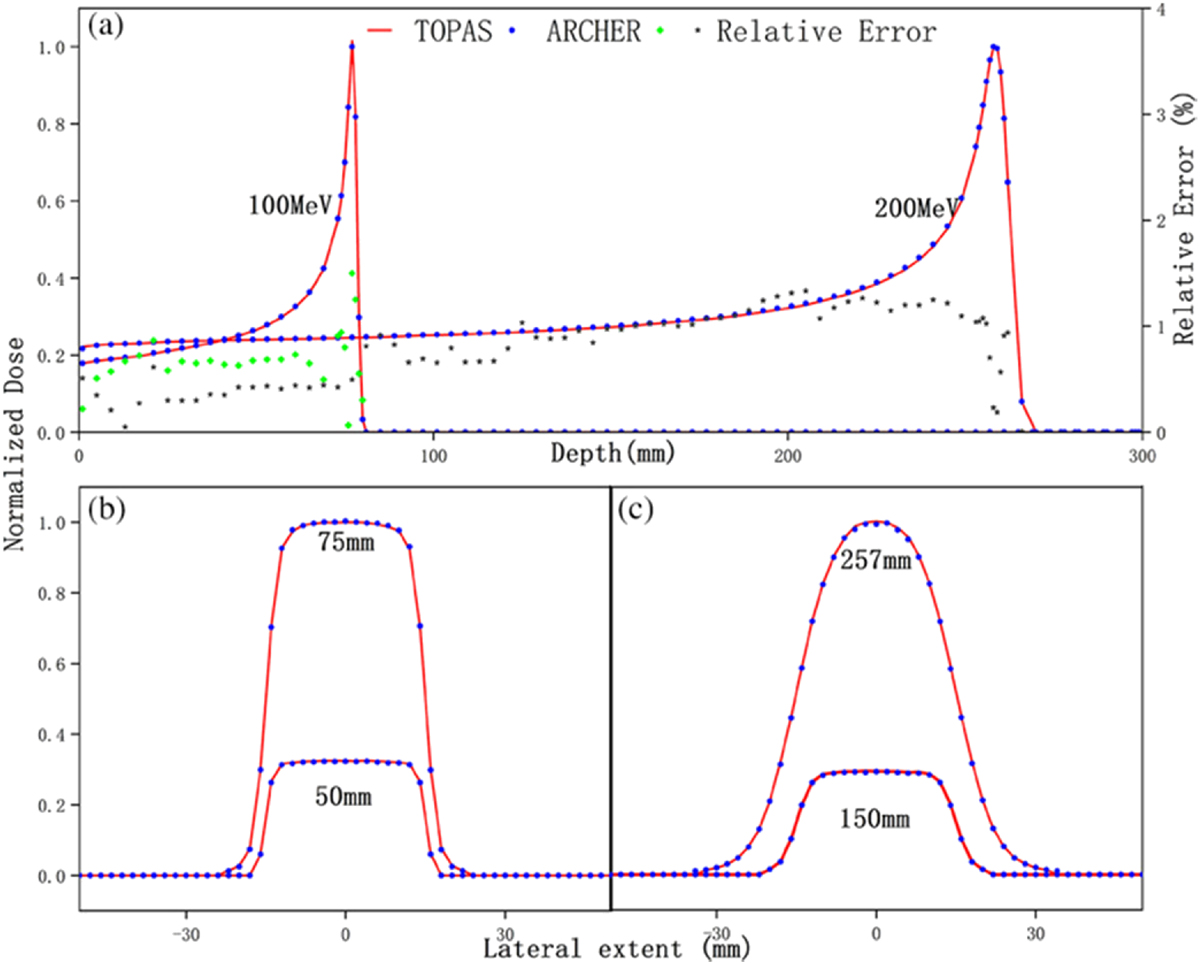
Fig. 5.
Download original image
Dose comparison in water for proton dose calculation. (a) Integrated depth-dose profiles are shown. TOPAS simulations are indicated by solid red lines, ARCHER simulations as blue points, and the relative errors are plotted in green and gray dots. (b) Two lateral profiles for 100 MeV proton beam are shown. The legend “50 mm” represents the lateral profile obtained at the depth of 50 mm. (c) Lateral profiles for the 200 MeV proton beam are shown.
Current usage metrics show cumulative count of Article Views (full-text article views including HTML views, PDF and ePub downloads, according to the available data) and Abstracts Views on Vision4Press platform.
Data correspond to usage on the plateform after 2015. The current usage metrics is available 48-96 hours after online publication and is updated daily on week days.
Initial download of the metrics may take a while.