Open Access
Fig. 5
Download original image
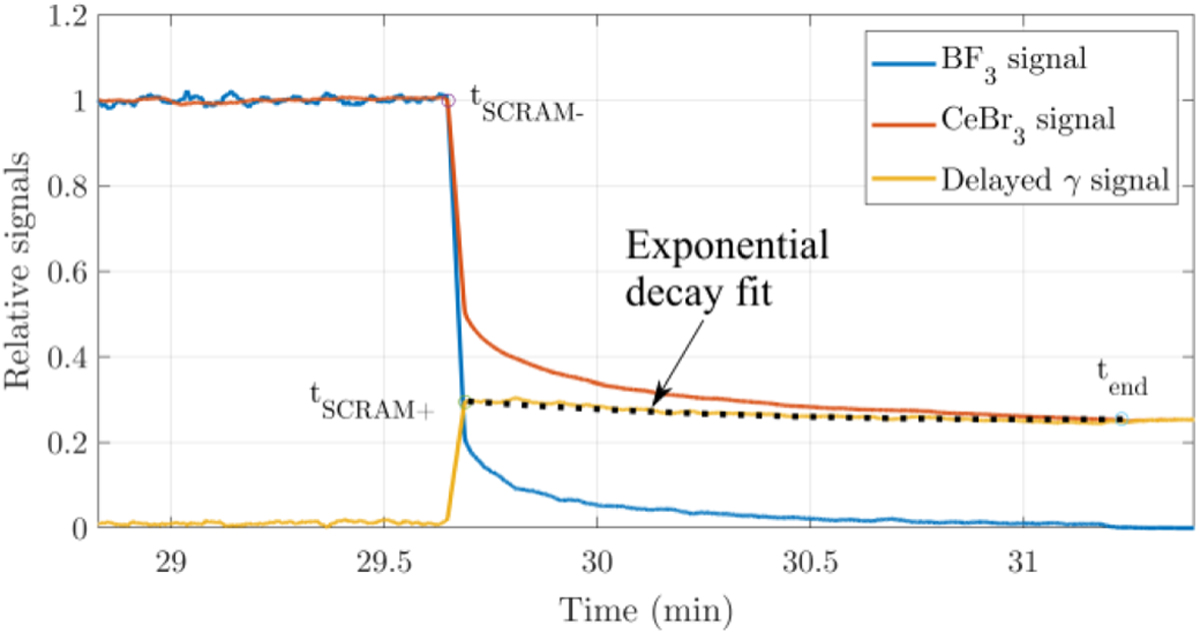
Example of a resulting delayed gamma signal when choosing a signal normalization point before the cadmium blade is inserted (tSCRAM-). The curve is fitted with an exponential decay model until tend; the function value evaluated at tSCRAM+ is the delayed gamma fraction.
Current usage metrics show cumulative count of Article Views (full-text article views including HTML views, PDF and ePub downloads, according to the available data) and Abstracts Views on Vision4Press platform.
Data correspond to usage on the plateform after 2015. The current usage metrics is available 48-96 hours after online publication and is updated daily on week days.
Initial download of the metrics may take a while.