Open Access
Fig. 2
Download original image
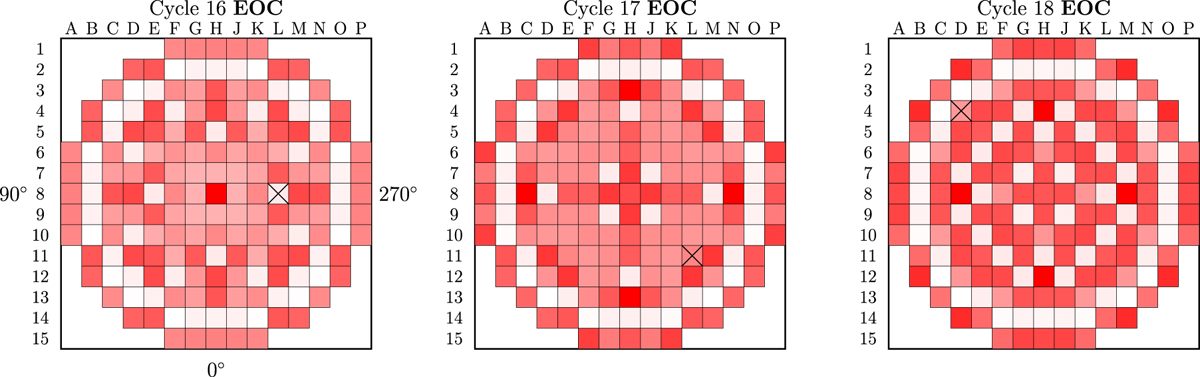
Locations of the assemblies 16-01 (cycles 16 and 17) and 17-01 (cycle 18) containing the GU3 sample. The positions of both assemblies are indicated by a cross. The colors are proportional to the assembly burnup obtained from SIMULATE-3 at the end of each cycle (EOC).
Current usage metrics show cumulative count of Article Views (full-text article views including HTML views, PDF and ePub downloads, according to the available data) and Abstracts Views on Vision4Press platform.
Data correspond to usage on the plateform after 2015. The current usage metrics is available 48-96 hours after online publication and is updated daily on week days.
Initial download of the metrics may take a while.