| Issue |
EPJ Nuclear Sci. Technol.
Volume 6, 2020
|
|
|---|---|---|
| Article Number | 54 | |
| Number of page(s) | 20 | |
| DOI | https://doi.org/10.1051/epjn/2020013 | |
| Published online | 11 September 2020 | |
https://doi.org/10.1051/epjn/2020013
Regular Article
Generation of correlation and covariance matrices for the recommended temporal DN parameters in 6- and 8-group models
JSC “SSC RF − IPPE”, Bondarenko sq. 1, Obninsk, 249033, Russian Federation
* e-mail: This email address is being protected from spambots. You need JavaScript enabled to view it.
Received:
20
December
2019
Received in final form:
11
March
2020
Accepted:
18
June
2020
Published online: 11 September 2020
Abstract
In the present work the new data on correlation and covariance matrices have been calculated for all recommended data on temporal parameters of delayed neutrons in 6- and 8-group models. The method for producing the correlation and covariance data for the temporal DN parameters is described. The table of changes is listed in the text. Some examples of the data generated on basis of experimental DN decay curves (for IPPE data) and data generated on the basis of decay curves restored using temporal parameters (for works of another authors) are listed too.
© V.M. Piksaikin et al., published by EDP Sciences, 2020
 This is an Open Access article distributed under the terms of the Creative Commons Attribution License (https://creativecommons.org/licenses/by/4.0), which permits unrestricted use, distribution, and reproduction in any medium, provided the original work is properly cited.
1 Introduction
Following Tuttle's evaluation of delayed neutron (DN) data in 1979 [1], OECD/NEA WPEC Subgroup (SG) 6 performed an evaluation with the aim of improving the macroscopic DN data for the major actinide nuclides 235U, 238U and 239Pu, which are of primary interest for reactor technology [2]. Recommended data were provided for the total DN yields for the above three nuclides, and for the temporal DN parameters in the 6-and 8-group models for the whole set of nuclides [3] included in Tuttle's evaluation [1]. However, SG 6 had no intention to elaborate an approach for calculating the correlation and the covariance data for DN temporal parameters.
In 2013 the Nuclear Data Section of the IAEA initiated a Coordinated Research Project (CRP) with the purpose to create a Reference Database for both microscopic and macroscopic DN databased on the latest experimental efforts [4]. Among the numerous new DN data developed in the frame of this project, are the revised recommended temporal DN parameters for both the 6- and 8-group models. The revised DN group-parameters database contained information on correlations and covariances only for a few nuclides, and mainly for the 6-group model which were obtained on the basis of the IPPE data. Taking into account up-to-date requirements from the reactor community, there is a need to extend such information for all the nuclides included in the new recommended DN database produced under the CRP project.
The purpose of this work is threefold: (1) to develop an approach for calculation of the correlation and the covariance data for the temporal DN parameters both in the 6- and the 8-group models; (2) to calculate the correlation and the covariance matrices for all nuclides included in the recommended IAEA/CRP database [5]; (3) to provide this data in a suitable form for easy inclusion in the online IAEA/NDS beta-delayed neutron database.
2 Methods for estimation of DN temporal parameters and generation of the correlation and the covariance data in the 6- and 8-group models
2.1 The IPPE method for estimation of DN parameters and their correlation and covariance data in the 6- and 8-group models
The DN temporal parameters (relative abundances and half-lives) are determined on the basis of the DN decay curves obtained in measurements of DN activity as a function of the time after irradiation of sample by neutrons. The expectation of the number of counts zi
detected in the time interval (ti-1,ti
) in the cyclic measurements with the irradiation time tirr
, N cycles each of which has duration T and the neutron background intensity B can be represented by the following expression [6]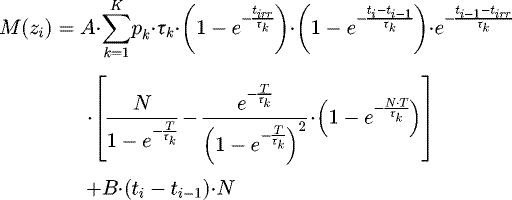 (1)where A − the DN saturation activity, K − the number of DN groups, pk
− the probability that precursors belong to the kth DN group, τk
− mean life-time of precursors corresponding to kth DN group (τk
= 1/λk
= Tk/ln2, λk
and Tk
being the decay constant and half-life of the kth DN group, respectively). The numbers zi
can be considered as independent random variables with the mathematical expectation that depends on n=2 · K+2 unknown parameters
(1)where A − the DN saturation activity, K − the number of DN groups, pk
− the probability that precursors belong to the kth DN group, τk
− mean life-time of precursors corresponding to kth DN group (τk
= 1/λk
= Tk/ln2, λk
and Tk
being the decay constant and half-life of the kth DN group, respectively). The numbers zi
can be considered as independent random variables with the mathematical expectation that depends on n=2 · K+2 unknown parameters (2)
(2)
From the physical point of view, all parameters in set (2) must be non-negative. The pk
parameters should be normalized to unity. Therefore, it is suitable to make the following parameterization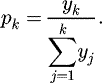 (3)
(3)
If one determines the value of one of the group yk
as equal to unity (usually this is the longest lived group of delayed neutron precursors) then the remaining yk
will represent the relative yields of DN with respect to this group. Then set (2) is transformed to the following set (4)
(4)
all elements of which are non-negative and one of the yk
is equal to unity. It is convenient to introduce for set (4) a new designation aj
by renumbering them from 1 to n and considering them as the coordinates of vector  . Having the explicit expression
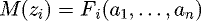 (5)one may formulate the task of the estimation of parameters {a
1
,...,an
} as the search for an optimal description of the measured values zi
by the functions
(5)one may formulate the task of the estimation of parameters {a
1
,...,an
} as the search for an optimal description of the measured values zi
by the functions  . Statistically the iteration process can be formulated in the following manner. The hypothesis H0
is made that the values of the parameters are
. Statistically the iteration process can be formulated in the following manner. The hypothesis H0
is made that the values of the parameters are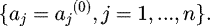 (6)
(6)
An alternative hypothesis H is that the parameters are presented in the following form (7)
(7)
By expanding  in a Taylor's series in the vicinity of
  ={δj = 0, j = 1,...,n} the linear model with respect to the corrections
  is created
 (8)
(8)
where (9)
(9)
This model is used for the estimation of  on the basis of measured values zi
. If the obtained corrections considerably differ from zero then the hypothesis H0
is discarded and a corrected hypothesis H is proposed. If the difference of the corrections from zero is considered as negligible then the hypothesis H0
is accepted and the vector
on the basis of measured values zi
. If the obtained corrections considerably differ from zero then the hypothesis H0
is discarded and a corrected hypothesis H is proposed. If the difference of the corrections from zero is considered as negligible then the hypothesis H0
is accepted and the vector  is chosen as the resultant estimation. The statistical uncertainties of the estimation are determined by the uncertainty of the correction term. The present approach in solving the problem is that the estimation of the vector
  is determined by means of the sequence of estimations
  , each of which uses only one measurement zi
and the previous estimation.
, each of which uses only one measurement zi
and the previous estimation.
Particularly for each i one should find  from the condition of the minimum of the following quadratic form
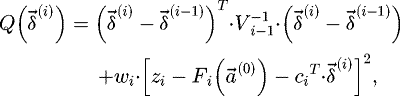 (10)
where
(10)
where  − matrix that is the inverse to the covariance matrix Vi
–1 of the estimation
− matrix that is the inverse to the covariance matrix Vi
–1 of the estimation  , c
i
T
− ith row of matrix C. From the Gauss-Markov theorem about the estimation of the generalized least squares method corresponding to the minimum of the
, c
i
T
− ith row of matrix C. From the Gauss-Markov theorem about the estimation of the generalized least squares method corresponding to the minimum of the  value, one can obtain the following formulas for estimation of the value of delayed neutron parameters as well as appropriate covariance matrix
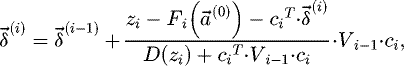 (11)
(11)
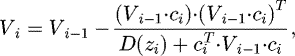 (12)where D(zi
) −the variance of zi
.
(12)where D(zi
) −the variance of zi
.
The correlation matrix was obtained with the following formula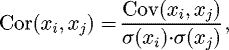 (13)where i, j = 1,…,n; σ(xi
), σ(xj
) − variances of parameters xi
and xj
, respectively.
(13)where i, j = 1,…,n; σ(xi
), σ(xj
) − variances of parameters xi
and xj
, respectively.
There are two types of DN data sets in the recommended IAEA/CRP database. The first one is related to the DN parameter sets for which experimental decay curves are available (the IPPE data). These data can be used for generating covariance data directly from the least square estimation procedure applied to the decay curves. The second type of data comprise the DN parameter sets without the associated experimental decay curves. In each case we used a different approach for generation of the correlation and the covariance data.
2.2 The LANL method for estimation of DN parameters in 8-group model
Instead of using original DN decay curve or its analytical estimation incorporated in the IPPE expansion method, the LANL techniques is based on another analytical function − the simulation of the time-dependence of relative power of a system containing a nuclide under investigation. A detailed description of this method is presented in paper [3]. For reader convenience main features of this method are described below.
Firstly a series of 20 transients of systems corresponding to step inputs of reactivity in a range from $0.01 to $0.95 is generated on the basis of the exact solution of the point-reactor kinetic equations according the function (14)
(14)
where N − the relative neutron power; Aj
– the amplitude of the jth term; ωj
− the jth root of the inhour equation calculated using the original DN parameters; n − the number of DN groups in the original model. The amplitudes, Aj
, in this equation are related to the relative abundance, ai
, and decay constant of each group, λi
, and to the system reactivity, ρ$, as follows (15)
(15)
where Λ − the neutron generation time; β – the effective delayed neutron fraction.
Based on the obtained dependences of the relative neutron flux on the time N(t) and the asymptotic inverse period, a file of initial data was created for a specific set of group parameters of the DN, which were then used to obtain the group parameters of the DN in the framework of the 8-group model. In this case, the relative neutron flux was described by a function similar to equation (14), in which the amplitudes were determined by expression (16)where ωa
− the asymptotic inverse period corresponding to the reactivity value obtained on the basis of the initial model of DN characteristics.
(16)where ωa
− the asymptotic inverse period corresponding to the reactivity value obtained on the basis of the initial model of DN characteristics.
In the process of this procedure, the time dependence of the characteristics of the hypothetical system, the scale of the reactivity change (only positive values are considered) and the average half-life of the DN remain unchanged. It should be noted that there is no uncertainties associated with the decay constant in the 8-group model (the values of the half-lives are fixed). Therefore all of the uncertainties in the reactivity are lumped into the uncertainties of group abundances.
2.3 Comparison of the IPPE and the LANL methods for estimation of the 8-group DN characteristics
The discussed expansion processes were compared using the experimental 6-group data obtained by Keepin et al. [7] from the fast neutron induced fission of 240Pu. The results of the LANL expansion method was taken from the recommended DN data sets presented in paper [3] and shown in Table 1. The results of the estimation of the 8-group DN parameters obtained by the IPPE method are presented in Table 2.
It is seen from Tables 1 and 2 that the 8-group relative abundances obtained by the LSF processing of the model decay curves based on the 6-group DN data by both methods agree within their uncertaities. This is a good indication that the correlation matrix obtained in the procedure of estimating the 8-group DN parameters is correct. Taking into account that the LANL method includes the procedure for the estimation of uncertainties which is consistent with the uncertainties of the original 6-group DN data sets the covariance matrix for the 8-group model in case of DN datasets without experimental decay curves was calculated on the basis of the IPPE correlaton matrix and the uncertainties provided in the recommended 8-group datasets by Spriggs et al. [3] (see appropriate paragraph below).
It should be noted that a disagreement in the expanded 8-group DN parameters (listed in [3]) and the original 6-group DN data sets was found for the fast neutron induced fission of 242Pu [8] and 238U [7]. Namely, there is no agreement between the 8-group data obtained by the LANL expansion method [3] and the data obtained with the help of the IPPE method [6]. This means that the estimated correlation matrix will be not suitable for the recommended 8-group DN dataset. In order to investigate the reason for such discrepancy the ratios of the decay curves obtained for the 8-group DN datasets by the LANL and the IPPE expansion methods to the DN decay curves obtained with the original 6-group data by Waldo (242Pu. [8]) were calculated. The resulting data are plotted in Figure 1.
In the same way the ratios of the decay curves were obtained for the 8-group DN data set using the LANL and the IPPE expansion methods to the DN decay curve from the fast neutron fission of 238U obtained with the original 6-group data by Keepin [7] were calculated. Results are shown in Figure 2.
It is seen from Figure 1 that the decay curve calculated with the Spriggs' 8-group data set signicantly differs from the original 6-group decay curves by Waldo [8]. The decay curve obtained with the IPPE methods does not differ from the Waldo's original decay curve by more than 5%. As a result, it was decided to replace the 8-group DN dataset for the fast neutron-induced fission of 242Pu [8] obtained with the help of the LANL expansion method by the corresponding DN dataset estimated with the IPPE method.
From Figure 2 one can see that the Spriggs recommended 8-group data set [3] in the range from 160 to 580 s significantly differ from the original 6-group data by Keepin [7]. At the same time the decay curve obtained using the IPPE method is in the well consistency with the original Keepin's data in the range below 500 s. Inconsistency in the range above 500 s could be due to the discrepancy between the half-lives of the first (longest) DN group for the 6- and 8-group representation (53.0 s and 55.6 s, respectively). This issue is scrutinized in the work devoted to the results of IAEA/CRP [5].
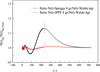 |
Fig. 1 The ratio of the decay curves calculated on the basis of the 8-group DN dataset with the LANL and the IPPE expansion methods to the DN decay curve obtained with the original 6-group data for 242Pu by Waldo [8]. |
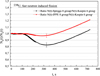 |
Fig. 2 The ratio of the decay curves calculated on the basis of the 8-group DN dataset with the LANL and the IPPE expansion methods to the DN decay curve obtained with the original 6-group data for 238U by Keepin [7]. |
3 Generation of correlation and covariance data
3.1 Generation of correlation and covariance data for the IPPE data
The correlation and covariance matrices were generated for the following the IPPE DN datasets obtained in the thermal, fast and high energy neutron induced fission which is considered as new sets of recommended data [5]:
232Th_high: En = 14.23 MeV, Roshchenko et al. (2010) [9];
233U_thermal: Thermal Spectrum, Piksaikin et al. (2002) [10];
233U_fast: En = 0.59 MeV, Piksaikin et al. (1997) [11];
235U_thermal: Thermal spectrum, Piksaikin et al. (2002) [6];
235U_fast: En = 0.81 MeV, Piksaikin et al. (2002) [6];
236U_fast: En = 3.7 MeV, Piksaikin et al. (1997) [13];
238U_fast: En = 3.75 MeV, Piksaikin et al. (2002) [6];
238U_high: En = 14.23 MeV, Piksaikin et al. (2007) [14];
237Np_fast: En = 3.745 MeV, Piksaikin et al. (1997) [12];
237Np_high: En = 14.23 MeV, Gremyachkin et al., (2017) [15];
239Pu_thermal: Thermal spectrum, Piksaikin et al. (2013) [11];
239Pu_fast: En = 0.86 MeV, Piksaikin et al. (2013) [11];
239Pu_high: En = 15.8 MeV, Piksaikin et al.(2007) [16];
241Am_fast: En = 1.06 MeV, Piksaikin et al.(2013) [11];
241Am_high: En = 15.8 MeV, Gremyachkin et al. (2018) [17].
3.1.1 The 6-group model of DN parameters
The 6-group model was used in the primary processing of the IPPE experimental data with the above discussed method (see Sect. 2.1).The decay curves obtained in the experiments with the irradiation times of 180 or 300 s were used for the estimation of the DN parameters for the four longest groups. The parameters of the remaining two groups were estimated from the decay curves corresponding to experiments with the irradiation time of 15 s.
The averaging procedure was used when several datasets of DN parameters were available for specified incident neutron energy. The procedure for averaging several number of DN parameter sets is described in the paper [6]. All runs in our experiments can be considered as independent. There is no parameter which is derived from one run and then used in processing of the other one. Background B, activity A and corresponding uncertainties dA and dB are estimated for each decay curve simultaneously with ai
and Ti
and their uncertainties dai
and dTi
. If we have the vector  , components of which are the DN parameters
 (17)
(17)
In a K-group model approximation and the appropriate covariance matrix Vj
for each experimental run j, one can obtain the resulting set  of the relative abundances and periods averaged over M independent measurements according to the following expression
 (18)where
  is the covariance matrix of the set
  of the DN parameters. The uncertainties of the averaged values of the relative abundances and the half-lives of DN were taken as the square root of appropriate diagonal elements of the covariance matrix V.
Thus, the DN temporal parameters and appropriate correlation and covariance matrices in the 6-group model for the IPPE data were obtained directly from experimental decay curves using the averaging procedure which takes into account the strong cross-correlation between the DN parameters derived from the least squares fitting of the decay curves.
3.1.2 The 8-group model of DN parameters
There are two possible approaches for generation of the DN parameters (ai ,Ti ), correlation and covariance data for the 8-group model. The first one is to estimate these data directly from the LSF processing of experimental decay curves. The second one is to produce these data from the LSF processing of the decay curves calculated using the 6-group DN parameters (ai ,Ti ) estimated in the primary processing of experimental data (a model decay curve).
The outlined approaches were compared using experimental decay curve obtained in the experiment in which 235U sample was irradiated by thermal neutrons during 180 s. The DN counting time interval was 0.1-720 s. The total number of counts registered by the neutron detector was 840272. In Figure 3 this experimental decay curve is shown together with decay curve calculated with the help of the estimated 6-group DN parameters (ai ,Ti ). The both DN delayed curves were the LSF processed with purpose to estimate the 8-group DN parameters (ai ) and appropriate correlation matrices. The two sets of the DN parameters obtained in the LSF processing of the experimental data and the estimated decay curve are listed in Tables 3 and 4, respectively. The correlation matrices for the sets of DN parameters are listed in Tables 5 and 6.
The comparison of the sets of the parameters, ai , and their uncertainties, dai , as well as the values of the correlation coefficients, Cor(ai ,aj ), obtained in the both approaches shows very good agreement of the data. The most important feature of the obtained results is the identity of the correlation matrices and the structure of the parameter uncertainties in the both approaches. It means that the statistical dispersion of the decay curves has no main influence on the correlation properties of DN parameters at least in the case of good statistical accuracy of experimental decay curve and the reliable estimation of the DN parameter values. Based on these results we have used the second approach for the estimation of the DN temporal data and their correlation and covariance matrices for the IPPE data. Although the possibility to obtain these data on the basis of the IPPE experimental data is still remain.
Thus, the 8-group DN parameters (the relative abundances, the correlation and the covariance matrices) were obtained in the following approach. Firstly, the DN decay curves were calculated using the evaluated 6-group data sets (<ai>, <Ti>) obtained from the primary processing of the experimental data including averaging procedure. Then these decay curves were analyzed using the iterative least-squares method to obtain the relative abundances, the correlation and the covariance matrices in the 8-group model representation (see Appendix B for the motivations of using such a complicated approach).
The revisions of the DN parameters sets made on the basis of the experimental IPPE data in the frame of the IAEA/CRP (Nuclear Data Sheets, to be published) with respect to the recommended sets of the temporary DN parameters presented in [3] are shown in Table 7.
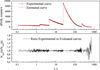 |
Fig. 3 Time dependence of the delayed neutron intensity. Squares − experimental curve, circles − curve estimated in the process of least square fit. Lower graph shows the ratio of the experimental to evaluated curve. |
The 8-group DN parameters (ai ) obtained in processing of the experimental decay curve measured from fission of 235U by thermal neutrons.
The 8-group DN parameters (ai ) obtained in the LSF processing of the decay curve calculated with the help of the estimated 6-group DN parameters.
The 8-group correlation matrix obtained in processing of the experimental decay curve measured from fission of 235U by thermal neutrons.
The 8-group correlation matrix obtained in the LSF processing of the decay curve calculated with the help of the estimated 6-group DN parameters (a model decay curve).
The revisions of the DN parameters sets made in the frame of the IAEA/CRP project made on the basis of the experimental IPPE data.
3.2 Generation of correlation and covariance data for DN datasets without experimental DN decay curves
The correlation and the covariance matrices both in the 6- and 8-group model were generated for the following original DN data sets presented as the recommended data [3] and which included in new recommended DN data sets without any changes [5]:
232Th_fast: Fast Spectrum, 6-groups, Keepin et al. (1957) [7];
231Pa_fast: Above Cd Cutoff, 6-groups, Anoussis et al. (1973) [18];
231Pa_high: En = 14.8 MeV max, 4-groups, Brown et al. (1971) [19];
232U_ther: Thermal Spectrum, 5-groups, Waldo et al. (1981) [8];
233U_high: En = 14.7 MeV, 6-groups, East et al. (1970) [20];
235U_high: En = 14.7 MeV, 6-groups, East et al. (1970) [20];
238Pu_ther: Thermal Spectrum, 6-groups, Waldo et al. (1981) [8];
238Pu_fast: Fast Spectrum, 5-groups, Benedetti et al. (1982) [21];
240Pu_fast: Fast Spectrum, 6-groups, Keepin et al. (1957) [7];
241Pu_ther: Thermal Spectrum, 5-groups, Cox (1961) [22];
241Pu_fast: ∼Fission Spectrum, 6-groups, Gudkov et al. (1989) [23];
242Pu_fast: Fast Spectrum, 6-groups, Waldo et al. (1981) [8];
242Pu_high: En = 14.7 MeV, 6-groups, East et al. (1970) [20];
241Am_ther: Thermal Spectrum, 6-groups, Waldo et al. (1981) [8];
242mAm_ther: Thermal Spectrum, 6-groups, Waldo et al. (1981) [8];
243Am_fast: Fast Spectrum, 7-groups, Charlton et al. (1998) [24];
245Cm_ther: Thermal Spectrum, 6-groups, Waldo et al. (1981) [8];
249Cf_ther: Thermal Spectrum, 4-groups, Waldo et al. (1981) [8];
252Cf_spon: Spontaneous Fission, 4-groups, Chulick et al. (1969) [25].
As a first step, the DN decay curves were generated on the basis of the available the 6-group DN parameters (some of these data are available in the 4- and 5-group models [231Pa etc.]). The following additional parameters were used to generate the decay curves: the irradiation time − 180 s; the number of cycles − 1; the time sequence of delayed neutron counting − 0.01 s − 150 channels, 0.02 s − 150 channels, 0.1 s − 200 channels, 1 s − 200 channels, 10 s − 50 channels; the activity A − 10000 counts/s; the neutron background B − 10 counts/s (see Appendix C for conditions A = 1000, 5000; B = 100). The obtained DN decay curves were used to estimate the DN correlation and covariance data for both the 6- and 8-group model.
To justify this approach for generation of correlation matrices for the 6-group data we have made the following estimations. As a first step, we have obtained the delayed neutron parameters (ai ,Ti ) and correlation matrix using the experimental decay curve for the thermal neutron induced fission of 235U (see the above discussion on the estimation of the 8-group DN parameters for the IPPE data). On the second step we have estimated delayed neutron parameters and correlation matrice on the basis of the model decay curve generated with (ai ,Ti ) obtained on the first step of processing. The obtained data on the temporal DN parameters (ai ,Ti ) are presented in Tables 8 and 9 for the experimental and the model decay curves, respectively.
The obtained correlation matrices for the 6-group representation are shown in Tables 10 and 11.
It is seen from Tables 8 and 9 that the relative abundances, ai
, and their uncertainties, dai
, obtained in processing of the experimental decay curve and the model decay curve calculated with estimated DN parametes are in excellent agreement. The difference in the correlation coefficients (Cor(ai
,aj
), Cor(ai
,Tj
), Cor(Ti
,Tj
)) in appropriate correlation matrices is negligible. Thus in the 6-group model as well as in the case of the 8-group model (see discussion above) one can see the identity of the DN characteristics obtained in the LSF processing of experimental and corresponding model decay curves. Moreover one can see the identical correlation properties of DN parameters in the experimental and model decay curves. This is an important condition for obtaining a reliable correlation matrix which corresponds to the values of the DN neutron parameters that are close to the original DN data. In order to save uncertainties of DN parametes cited in original papers the covariance data were obtained using the correlation matrix derived in the LSF estimation of the DN parameters and the uncertainties σ(ai) and σ(Ti) taken from the original group data sets (quoted in the published papers):


The 8-group data on temporal DN parameters and the appropriate correlation matrices have been obtained in the same way as it have been shown for the 6-group data. The covariance matrices have been produced using the uncertainties σ(ai ) from the data recommended by Spriggs [3].
The 6-group DN parameters (ai ,Ti ) obtained in processing of the experimental decay curve measured from fission of 235U by thermal neutrons.
The 6-group DN parameters (ai,Ti ) obtained in the LSF processing of the model decay curve calculated with the help of the 6-group DN parameters estimated on the basis of experimental decay curve.
The 6-group correlation matrix obtained in processing of the experimental decay curve measured from fission of 235U by thermal neutrons.
The 6-group correlation matrix obtained in the LSF processing of the model decay curve calculated with the help of the estimated 6-group DN parameters from fission of 235U by thermal neutrons.
4 The IAEA reference database for beta-delayed neutron emission
Numerical information on the corelation and the covariance data for the temporal DN parameters in the 6- and 8-group model as well as new recommended values of the relative abundances and the half-lives are presented in the IAEA Reference Database for Beta-Delayed Neutron Emission [26]). These data should be considered as a partial re-evaluation and extension of the recommended data sets presented in Spriggs et al. paper [3].
The IAEA DN data base includes the following information for the nuclides which were investigated experimentally:
-
Relative abundances and half-life of delayed neutrons (6-group DN data sets);
-
Correlation matrix (6-group DN data sets);
-
Covariance matrix (6-group DN data sets);
-
Relative abundances and half-life of delayed neutrons (8-group DN data sets);
-
Correlation matrix (8-group DN data sets);
-
Covariance matrix (8-group DN data sets).
As an example all the DN data sets for fission of 241Pu by fast neutrons [23] are shown in Tables 12–17.
Relative abundances and half-life of delayed neutrons (6-group DN data set) for fast neutron induced fission of 241Pu.
Relative abundances and half-life of delayed neutrons (8-group DN data set) for fast neutron induced fission of 241Pu.
Correlation matrix for the 6-group DN data set obtained for fast neutron induced fission of 241Pu.
Covariance matrix for the 6-group DN data set for fast neutron induced fission of 241Pu.
Correlation matrix for the 8-group DN data set for fast neutron induced fission of 241Pu.
Covariance matrix for the 8-group DN data set for fast neutron induced fission of 241Pu.
5 Conclusions
We have presented the new data on the correlation and the covariance matrices for temporal DN parameters (the relative abundances and half-lives) that were generated in the 6- and 8-group model presentation for all nuclides included in the recommended data of the IAEA Reference Database for Beta-Delayed Neutron Emission [26]. Relative abundances and half-life of delayed neutrons (6-group DN data sets);
-
Correlation matrix (6-group DN data sets);
-
Covariance matrix (6-group DN data sets);
-
Relative abundances and half-life of delayed neutrons (8-group DN data sets);
-
Correlation matrix (8-group DN data sets);
-
Covariance matrix (8-group DN data sets).
There are two types of DN data sets in the recommended IAEA database. The first one is related to the DN parameter sets for which experimental decay curves are available (the IPPE data). The second type of data comprise the DN parameter sets without the associated experimental decay curves. In each case we used a different approach for generation of the correlation and the covariance data.
The DN temporal parameters and appropriate correlation and covariance matrices in the 6-group model for the IPPE data were obtained directly from experimental decay curves using the averaging procedure which takes into account the strong cross-correlation between the DN parameters derived from the least squares fitting of the decay curves.
The 8-group DN parameters (the relative abundances, the correlation and the covariance matrices) for the IPPE data sets were obtained in the following approach. Firstly, the DN decay curves were calculated using the evaluated 6-group data sets (<ai >, <Ti >) obtained from the primary processing of the experimental data including averaging procedure. Then these decay curves were analyzed using the iterative least-squares method to obtain the relative abundances, the correlation and the covariance matrices in the 8-group model representation.
The revisions of the DN parameters sets including generation of the correlation and the covariance data made on the basis of the experimental IPPE data with respect to the recommended sets of the temporary DN parameters presented in [3] are shown in following Table 7.
Generation of the correlation and the covariance data for the DN sets without experimental decay curve was made on the basis of the model decay curves obtained using the values of the original data on relative abandances and half-lives. The values of the relative abundances and the half-lives as well as their uncertainties for these DN data sets remain unchanged.
Justification of such approach was made in a special study. It was shown the identity of the correlation matrices, DN parameters and the structure of the parameter uncertainties obtained in the LSF processing of experimental decay curve and corresponding model decay curve both for the 6- and 8-group models. It means that the statistical dispersion of the decay curves has no main influence on the correlation properties of DN parameters.
Acknowledgments
This work was performed under an SSA with the IAEA/Nuclear Data Section on New aggregate data in the IAEA Reference Database for beta-delayed neutron emission (Reference: TAL-NAPC20190118-001). Authors are appreciated P. Dimitriou from Nuclear Data Section of the IAEA for initialization of the present work and useful discussions during its preparation.
Author contribution statement
Development of the approach and algorithm for analysis of covariance data for the temporary delayed neutron parameters (V. Piksaikin - 70%, D. Gremyachkin - 30%). Development of the computer codes for processing of the experimental and evaluated delayed neutron decay curves (A. Egorov - 60%, V. Mitrofanov - 40%). Processing of the experimental and evaluated delayed neutron data with the purpose to obtain covariance and correlation data (K. Mitrofanov - 50%, D. Gremyachkin - 50%). Preparation of the manuscript (V. Piksaikin - 60%, D. Gremyachkin - 40%).
Appendix A Detailed description of the process of constants determination
First of all we would like to note that we fix the relative abundances of the 1-st group to 1. And then we make estimation of the relative abundances of the 2, 3, 4, 5, 6 groups as a ratio to the value of the 1-st group (=1) (see description of algorithm).
In order to clarify the estimation procedure we would propose consider the processing of experimental data obtained in one of experimental run for thermal induced fission of U-235. There were 12 cycles of irradiation. Time of transportation of sample 0.1 s. Irradiation time −180 s. Counting time − 700 s. The decay curve is presented in Figure 1.
Processing procedure can be expressed in the following steps:
-
A priori set of delayed neutron parameters can be taken from any available set from the literature (program is working even with all parameters which are equal to 1).
-
Least square fit (LSF) of the decay curve is made in the range 10–700 s in order to estimate a1, a2, da2, T1, dT1, T2, dT2. (da1=0 means that a1 is not free parameter = 1). In LSF fitting parameters A (activity) and B (background) estimated as well.
-
LSF fit of the decay curve in the range 0.1–700 s is made in order to estimate value of a3-6, da3-6 and T3-6, dT3-6 with fixed values of a1, a2, T1, T2 obtained in previous step.
As a result we have obtained the following set of DN parameters (ser#1).
Transferring this data in commonly used form one have DN data set (Σai = 1).
4) Using this set of DN parameters as a priori set we made another LSF fit of decay curve in the range 0.1–700 s to get correlation matrix #1 (all parameters are free but a1 = 1, da1 = 0).
It is seen that correlation coefficients cor(a1,T1), cor(a1,a2), … = 0. Zero value of these correlation coefficients is not “set” to “0”. This is natural result of the LSF algorithm when we set zero value to uncertainty da1 in the a priori DN set (that means also that a1 is fixed).
Namely this type data set#1 and Matrix#1 is used as a final set of data after estimation of uncertainty da1.
Estimation of the uncertainties da1 was made in the following procedure:
5) In order to estimate uncertainty of the relative abundance of 1-st group we made LSF fit of the decay curve in the range 0.1-700 s (as in step 4) with free all parameters including a1 (da1 is not equal to 0). As a result of this step we have obtained the following DN parameters (set#2) and appropriate correlation matrix #2.
Transferring this data in commonly used form one have
Taking into account that sets #1 and #2 of DN parameters (including uncertainties) are very close one can say that estimation of da1 is reliable.
Moreover comparison of covariance matrix #1 (with da1 = 0, a1 is fixed to 1) with covariance matrix #2 (with a1 as a free parameter) shows very close values of correlation coefficients. This is direct indication that procedure which we used for calculation of correlation matrix is correct. Using the procedure for calculating DN parameters with respect to the first group does not distort the correlation coefficient. There is no “impact on determination of the other parameters”.
At that we adduce the correlation matrix obtained namely by calculation of the parameters relatively to fixed first group, since that in this case the algorithm gives the most correct solution.
Temporal DN parameters obtained in the result of the steps 1–3 (group yields are obtained relatively to the yield of the first group).
Temporal DN parameters in more common form (with absolute dT and normalized ai values).
Correlation matrix obtained in the result of the steps 1–4 (a1 is fixed).
Temporal DN parameters obtained in the result of the steps 1–3 using set#1 as a priori data (group yields are obtained relatively to the yield of the first group).
Temporal DN parameters in more common form (with absolute dT and normalized ai values).
Correlation matrix obtained using all free parameters.
Appendix B Motivation for procedure used in our approach
In order to obtain the 8 group DN parameters values and uncertainties comparable with 6 −group data we need to get very good statistics (it is because of 8 group parameters in 8 group model as compared with 12 group parameters of 6 group model). It is quite expensive to make experiments on the electrostatic accelerator. Besides to get reliable data we should make many cycles of measurements with stable ion current and stable neutron target (it can be deteriorated by ion flux).
From our experience some existing “raw data” gave biased estimation in <T> relatively to the 6-group model. In addition there is a need to develop averaging procedure for 8-group data that we have for 6-group data. Therefore we decided to follow approach used in Spriggs et al paper [3]: to calculate “model decay curve” on the basis of 6-group data. (In the present work we used the data obtained after averaging procedures. So there was no need to have 8-group averaging procedure) and process it by the LSF. Many tests were made. It turns out that in this approach we have better estimation of <T> as compared with “raw data” processing with comparable uncertainties d<T>.
Appendix C Variation of the input conditions (activity, background)
Using the data from Table A1 we made for the example datasets with A = 1000, B = 100 and A = 5000, B = 100 to show the influence of less favorable background conditions.
It has the following correlation matrix:
Using ≪input dataset≫ the decay curve has been obtained. It has been used to obtain dataset and correlation matrix (as an example of obtaining correlation matrices from another works).
And appropriate correlation matrix, which is almost identical to the ≪input≫ one.
Also using the data from we have we made for the example dataset with (A=5000, B=100).
It has the following correlation matrix.
Using ≪input dataset≫ the decay curve has been obtained. It has been used to obtain dataset and correlation matrix (as an example of obtaining correlation matrices from another works).
“Input dataset” for testing the quality of generation of correlation matrices (A = 1000, B = 100).
Correlation matrix appropriate to the input dataset (ai , Ti ) (A = 1000, B = 100).
The 6-group DN parameters (ai ,Ti ) obtained in the LSF processing of the model decay curve calculated with the help of the 6-group DN “input dataset” (A = 1000; B = 100).
The 6-group correlation matrix obtained in processing of the model decay curve calculated with the help of the 6-group DN “input dataset” (A = 1000; B = 100).
“Input dataset” for testing the quality of generation of correlation matrices (A = 5000, B = 100).
Correlation matrix appropriate to the input dataset (ai ,Ti ) (A = 5000, B = 100).
The 6-group DN parameters (ai ,Ti ) obtained in the LSF processing of the model decay curve calculated with the help of the 6-group DN “input dataset” (A = 5000; B = 100).
The 6-group correlation matrix obtained in processing of the model decay curve calculated with the help of the 6-group DN “input dataset” (A = 5000; B = 100).
References
- R.J. Tuttle, Review of delayed neutron yields in nuclear fission in Yields in Nuclear Fission. in: Proc. Consultants' Mtg. on Delayed Neutron Properties. Report INDC(NDS)-107. IAEA. Vienna. Austria , August 1979, p. 29 [Google Scholar]
- D'Angelo, Overview of the delayed neutron data activities and results monitored by the NEA/WPEC Subgroup 6, Prog. Nucl. Energy 41, 5. G.D. 3 (2002) [CrossRef] [Google Scholar]
- G.D. Spriggs, J.M. Campbell, V.M. Piksaikin, An 8-group delayed neutron model based on a consistent setof half-lives, Prog. Nucl. Energy 41, 223 (2002) [CrossRef] [Google Scholar]
- I. Dillmann, P. Dimitriou, B. Singh, Development of ReferenceDatabaseforBeta-delayedneutronemission, IAEA report INDC(NDS)-0643, 2014 [Google Scholar]
- P. Dimitriou, I. Dillmann, B. Singh, V. Piksaikin, K.P. Rykaczewski, J. Tain, A. Algora, I.N. Borzov, D. Cano-Ott, S. Chiba, A. Egorov, D. Foligno, D. Gremyachkin, T. Marketin, F. Minato, K.V. Mitrofanov, CRP members in alphabetical order, et al., Development of a Reference Database for Beta-Delayed Neutron Emission. NUCLEAR DATA SHEETS, to be published [Google Scholar]
- V.M. Piksaikin, L.E. Kazakov, S.G. Isaev, M.Z. Tarasko, V.A. Roshchenko, R.G. Tertytchnyi, G.D. Spriggsand J.M. Campbell, Energy dependence of relative abundances and periods of delayed neutrons from neutron-induced fission of U-235, U-238, Pu-239 in 6- and 8-group model representation, Progr. Nucl. Energy 41, 203 (2002) [Google Scholar]
- G. Keepin, T. Wimett, R. Zeigler, Delayed neutrons from fissionable isotopes of uranium, plutonium and thorium, Phys. Rev. 107, 1044 (1957) [CrossRef] [Google Scholar]
- R.W. Waldo. R.A. Karam, R.A. Meyer, Delayed neutron yields: time dependent measurements and a predictive model, Phys. Rev. C 23, 1113 (1981) [CrossRef] [Google Scholar]
- V.A. Roshchenko, V.M. Piksaikin, et al., Temporary characteristics of delayed neutrons and partial cross sections of emissive fission in fission of 232Th by neutrons in the energy range from 3.2-17.9 MeV, Phys. At. Nucl. 73, 913 (2010) [CrossRef] [Google Scholar]
- V.M. Piksaikin, L.E. Kazakov, et al., Relative yield and period of individual groups of delayed neutrons in 233U, 235U and 239Pu fission by epithermal neutrons, At. Energy 92, 147 (2002) [CrossRef] [Google Scholar]
- V.M. Piksaikin, A.S. Egorov, K.V. Mitrofanov, The absolute total delayed neutron yields, relative abundances and half-life of delayed neutron groups from neutron induced fission of 232Th, 233U, 236U, 239Pu and 241Am, Report INDC(NDS)- 0646, IAEA, Vienna, Austria, 2013 [Google Scholar]
- V.M. Piksaikin, Ju.F. Balakshev, S.G. Isaev, L.E. Kazakov, G.G. Korolev, B.D. Kuzminov, N.N. Sergachev, M.Z. Tarasko, Measurements of periods, relative abundances and absolute total yields of delayed neutrons from fast neutron induced fission of 235U and 237Np, in Conf. Proc. Nucl. Data for Science and Technology, Triest, Italy (1997), vol. 59, p. 485 [Google Scholar]
- S.G. Isaev, V.M. Piksaikin, L.E. Kazakov, M.Z. Tarasko, Energy dependence of average half-life of delayed neutron precursors in fast neutron induced fission of 235U and 236U, in Proc. XIVth Int. Workshop on Nuclear Fission Physics, Obninsk, Russia, 12–15 October 1998, p. 257 [Google Scholar]
- V.M. Piksaikin, V.A. Roshchenko, G.G. Korolev, Relative yield of delayed neutrons and half-life of their precursor nuclei from 238U fission by 14.2–17.9 MeV neutrons, At. Energy 102, 124 (2007) [CrossRef] [Google Scholar]
- D.E. Gremyachkin, V.M. Piksaikin, K.V. Mitrofanov, A.S. Egorov, Measurements of temporal characteristics of delayed neutrons from neutron induced fission of 237Np in energy range from 14.2 to 18 MeV, EPJ Web Conf. 146, 04059 (2017) [CrossRef] [Google Scholar]
- V.A. Roshchenko, V.M. Piksaikin, L.E. Kazakov, G.G. Korolev, Relative yield of delayed neutrons and half-life of their precursor nuclei with fissioning of 239Pu by 14.2 − 17.9 MeV neutrons, At. Energy 101, 897 (2006) [CrossRef] [Google Scholar]
- D.E. Gremyachkin, V.M. Piksaikin, A.S. Egorov, K.V. Mitrofanov, Measurement of the temporal characteristics of delayed neutrons from neutron induced fission of 241Am in the energy range from 14.2 to 18 MeV, to be published in Proceedings of the seminar ISINN-25, Dubna, Russian Federation 2017 [Google Scholar]
- J.N. Anoussis, D.C. Perricos, N.G. Chrysochoides, C.A. Mitsonias, Relative abundances for six delayed neutron groups from reactor neutron-induced fission of 231Pa, Radiochim. Acta 20, 118 (1973) [CrossRef] [Google Scholar]
- M.G. Brown, S.J. Lyle, E.B.M. Martin, Delayed neutron yields from 14.8 MeV neutron induced fission of 238U, 232Th and 231Pa, Radiochim. Acta 15, 109 (1971) [CrossRef] [Google Scholar]
- L.V. East, R.H. Augustson, H.O. Menlove, Delayed neutron abundances and half-lives from 14.7 MeV fission nuclear safeguards research and development LA-4605-MS (1971) [Google Scholar]
- G. Benedetti, A. Cesana, V. Sangiust, M. Terrani, Delayed neutron yields from fission of uranium-233, neptunium-237, plutonium-238, −240, −241, and americium-241, Nucl. Sci. Eng. 80, 379 (1982) [CrossRef] [Google Scholar]
- S.A. Cox, Delayed-neutron studies from the thermal-neutron-induced fission of 241Pu, Phys. Rev. 123 (1961) [Google Scholar]
- A.N. Gudkov et al., Measurement of the delayed-neutron yields in the fission of 233U, 236U, 237Np, 240Pu and 241Pu by neutrons from the spectrum of a fast reactor. At. Energy. 66, 100 (1989) [CrossRef] [Google Scholar]
- W.S. Charlton, T.A. Parish, S. Raman, N. Shinohara, M. Andoh, Delayed Neutron Emission Measurements From Fast Fission Of U-235 and NP-237, CONF-960924–6 (1997) [Google Scholar]
- E.T. Chulick, P.L. Reeder, Redetermination of delayed neutrons from 252Cf, Radiochimica Acta 12 (1969) [CrossRef] [Google Scholar]
- IAEA Reference Database for Beta-Delayed Neutron Emission https://www-nds.iaea.org/beta-delayed-neutron/database.html [Google Scholar]
Cite this article as: Vladimir M. Piksaikin, Andrey S. Egorov, Dmitrii E. Gremyachkin, Konstantin V. Mitrofanov, Vjacheslav F. Mitrofanov, Generation of correlation and covariance matrices for the recommended temporal DN parameters in 6- and 8-group models, EPJ Nuclear Sci. Technol. 6, 54 (2020)
All Tables
The 8-group DN parameters (ai ) obtained in processing of the experimental decay curve measured from fission of 235U by thermal neutrons.
The 8-group DN parameters (ai ) obtained in the LSF processing of the decay curve calculated with the help of the estimated 6-group DN parameters.
The 8-group correlation matrix obtained in processing of the experimental decay curve measured from fission of 235U by thermal neutrons.
The 8-group correlation matrix obtained in the LSF processing of the decay curve calculated with the help of the estimated 6-group DN parameters (a model decay curve).
The revisions of the DN parameters sets made in the frame of the IAEA/CRP project made on the basis of the experimental IPPE data.
The 6-group DN parameters (ai ,Ti ) obtained in processing of the experimental decay curve measured from fission of 235U by thermal neutrons.
The 6-group DN parameters (ai,Ti ) obtained in the LSF processing of the model decay curve calculated with the help of the 6-group DN parameters estimated on the basis of experimental decay curve.
The 6-group correlation matrix obtained in processing of the experimental decay curve measured from fission of 235U by thermal neutrons.
The 6-group correlation matrix obtained in the LSF processing of the model decay curve calculated with the help of the estimated 6-group DN parameters from fission of 235U by thermal neutrons.
Relative abundances and half-life of delayed neutrons (6-group DN data set) for fast neutron induced fission of 241Pu.
Relative abundances and half-life of delayed neutrons (8-group DN data set) for fast neutron induced fission of 241Pu.
Correlation matrix for the 6-group DN data set obtained for fast neutron induced fission of 241Pu.
Covariance matrix for the 6-group DN data set for fast neutron induced fission of 241Pu.
Correlation matrix for the 8-group DN data set for fast neutron induced fission of 241Pu.
Covariance matrix for the 8-group DN data set for fast neutron induced fission of 241Pu.
Temporal DN parameters obtained in the result of the steps 1–3 (group yields are obtained relatively to the yield of the first group).
Temporal DN parameters in more common form (with absolute dT and normalized ai values).
Temporal DN parameters obtained in the result of the steps 1–3 using set#1 as a priori data (group yields are obtained relatively to the yield of the first group).
Temporal DN parameters in more common form (with absolute dT and normalized ai values).
“Input dataset” for testing the quality of generation of correlation matrices (A = 1000, B = 100).
Correlation matrix appropriate to the input dataset (ai , Ti ) (A = 1000, B = 100).
The 6-group DN parameters (ai ,Ti ) obtained in the LSF processing of the model decay curve calculated with the help of the 6-group DN “input dataset” (A = 1000; B = 100).
The 6-group correlation matrix obtained in processing of the model decay curve calculated with the help of the 6-group DN “input dataset” (A = 1000; B = 100).
“Input dataset” for testing the quality of generation of correlation matrices (A = 5000, B = 100).
Correlation matrix appropriate to the input dataset (ai ,Ti ) (A = 5000, B = 100).
The 6-group DN parameters (ai ,Ti ) obtained in the LSF processing of the model decay curve calculated with the help of the 6-group DN “input dataset” (A = 5000; B = 100).
The 6-group correlation matrix obtained in processing of the model decay curve calculated with the help of the 6-group DN “input dataset” (A = 5000; B = 100).
All Figures
|
Fig. 1 The ratio of the decay curves calculated on the basis of the 8-group DN dataset with the LANL and the IPPE expansion methods to the DN decay curve obtained with the original 6-group data for 242Pu by Waldo [8]. |
| In the text | |
|
Fig. 2 The ratio of the decay curves calculated on the basis of the 8-group DN dataset with the LANL and the IPPE expansion methods to the DN decay curve obtained with the original 6-group data for 238U by Keepin [7]. |
| In the text | |
|
Fig. 3 Time dependence of the delayed neutron intensity. Squares − experimental curve, circles − curve estimated in the process of least square fit. Lower graph shows the ratio of the experimental to evaluated curve. |
| In the text | |
Current usage metrics show cumulative count of Article Views (full-text article views including HTML views, PDF and ePub downloads, according to the available data) and Abstracts Views on Vision4Press platform.
Data correspond to usage on the plateform after 2015. The current usage metrics is available 48-96 hours after online publication and is updated daily on week days.
Initial download of the metrics may take a while.