| Issue |
EPJ Nuclear Sci. Technol.
Volume 4, 2018
Special Issue on 4th International Workshop on Nuclear Data Covariances, October 2–6, 2017, Aix en Provence, France – CW2017
|
|
|---|---|---|
| Article Number | 31 | |
| Number of page(s) | 4 | |
| Section | Covariance Evaluation Methodology | |
| DOI | https://doi.org/10.1051/epjn/2018018 | |
| Published online | 14 November 2018 | |
https://doi.org/10.1051/epjn/2018018
Regular Article
Uncertainty and covariances of the newly derived 8-groups delayed-neutrons abundances set
CEA, DEN Cadarache,
Saint-Paul-lez-Durance, France
* e-mail: This email address is being protected from spambots. You need JavaScript enabled to view it.
Received:
4
December
2017
Received in final form:
8
February
2018
Accepted:
4
May
2018
Published online: 14 November 2018
Abstract
Delayed-neutrons are of great importance for reactor operations. Current abundances derive from either a measurement performed in 1957 by Keepin or by a summation calculation performed by Brady and England in 1989. In this work, a code has been written to compute a new set of delayed-neutron abundances as well as to estimate uncertainties and correlations through a Monte Carlo method and a Bayesian inference. An experiment will take place in the future to verify the validity of the calculated quantities.
© D. Foligno and P. Leconte, published by EDP Sciences, 2018
 This is an Open Access article distributed under the terms of the Creative Commons Attribution License (http://creativecommons.org/licenses/by/4.0), which permits unrestricted use, distribution, and reproduction in any medium, provided the original work is properly cited.
1 Introduction
During the fission process, fission products are created in an excited state. Most of them, being neutron-rich, will undergo a β−-decay to reach stability. At the end of the decay the daughter could still be in an excited state, and if its excitation energy is larger than the separation energy of the last neutron, it might reach stability through a neutron emission. This neutron is emitted instantaneously at the moment of the β−-decay and it is a common practice to consider it to be emitted by the father, called delayed-neutron precursor rather than by the daughter, called delayed-neutron emitter. The delay in the appearance of the neutron with respect to the fission event is only due to the half-life of the precursor.
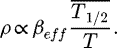
It is a common procedure to sort the 300 delayed-neutron precursors in groups (typically 6 or 8) and to represent their aggregate behavior through group parameters [1]. The most important application of the group constants is the estimation of the reactivity (ρ) from the measurement of the reactor period (T), through the mean delayed-neutron-precursors' half-life ( ), as shown in equation (1), valid for small reactivities.
 (1)
(1)
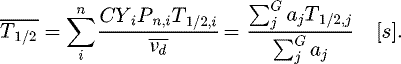
The mean precursors' half-life can be computed by adding up the individual precursors' contribution (second term in equation (2)) or by using the group approximation (third term in equation (2)), where aj is the group's abundance and T1/2,j the group's half-life [1].
 (2)
(2)
Delayed-neutron parameters can be found by either a macroscopic or a microscopic approach. JEFF-3.1.1 takes the data from the WPEC-SG6 report published in 2002 [2], where the 8-groups ai come from the expansion of a 6-groups set that Keepin obtained in 1957 through an integral measurement [3]. The uncertainties on the 8-groups abundances have been estimated in such a way to preserve the 6-groups set estimation of the uncertainty in the reactivity. On the other hand, ENDF/B-VII.1 library takes the 6-groups ai and λi from Bready and England's fit of the decay-curve computed by summation method [4]. No uncertainties are reported. In both libraries, the correlations are not provided.
2 Microscopic approach
2.1 Summation method
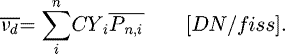
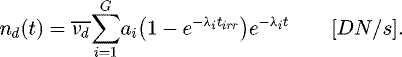
The microscopic approach consists of computing and summing up the individual contribution of each precursor to the quantities of interest (  ). Equation (3) [5] allows computing the delayed-neutron (DN) yield in case of an infinite irradiation,1 where CYi and
  are the cumulative yield and the effective delayed-neutron emission probability2 of precursor i and n the number of precursors.
 (3)
(3)
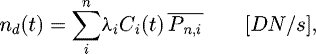
The DN activity can either be computed by summation method (Eq. (4)) or estimated through the group approximation (Eq. (5)), where λi is the decay constant, Ci(t) the concentration and tirr the irradiation time [5].
 (4)
(4)
 (5)
(5)
Equation (6) shows the system of equations to be solved to compute the precursors' concentration in time:
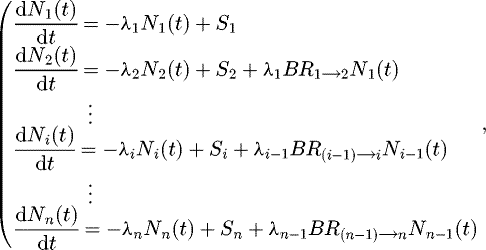 (6)
where Ni(t) is the ith-precursor's concentration, BR(i−1)→i the branching ratio of the (i−1)th isotope for the decay leading to i and Si the constant external source, which is given by
(6)
where Ni(t) is the ith-precursor's concentration, BR(i−1)→i the branching ratio of the (i−1)th isotope for the decay leading to i and Si the constant external source, which is given by
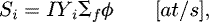 (7)with IYi being the independent yield of the precursor i, Σf the macroscopic fission cross-section of the fissioning system and φ the neutron flux. The general solution is reported in equation (8)
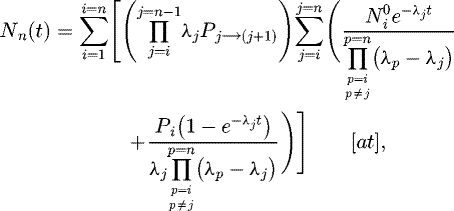 (8)where
  is the amount of ith isotope at some arbitrary reference time zero. Note that in case of different chains leading to the same precursor, the contribution of the nth species to itself must only be counted once. The assumptions behind the mentioned procedure are the following:
-
The neutron flux is constant during the irradiation phase
 .
. -
The energy and the space-dependence of the variables are neglected
 .
.
The boundary condition is that during the irradiation phase  is zero (none of the isotopes is present in the system), while during the decay phase it represents the concentration the i-isotope had at the end of the irradiation phase.
2.2 Results
From the computed delayed-neutron-emission rate it has been possible to derive a new set of abundances by a nonlinear least-square-fit of the decay curve (Fig. 1), performed with CONRAD. The eight-groups decay constants have been fixed in the fitting procedure to the ones recommended by JEFF-3.1.1,3 except for λ1 taken from the decay constant of 87Br according to ENDF/B-VII.1 (Tab. 1). This choice is justified by the fact that the summation calculation has been performed taking the radioactive decay data from ENDF/B-VII.1, and it is well-known that the asymptotic behavior of DNs only depends on the longest-lived precursors.
The new abundances are not far from the recommended values, but their uncertainty is larger since they reflect the uncertainty in the delayed-neutron-precursors data (IY, BR and T1/2), as well as in the fitting procedure (as explained in Sect. 3). It is important to highlight that those results have been obtained by using, as the initial guess, the JEFF-3.1.1 abundances, associated with a 100% uncertainty. The new set of abundances has then been used to compute the mean precursors' half-life (Tab. 2), the DN activity (Fig. 2) and the reactivity (Fig. 3).
As far the mean half-life is concerned, this work always overestimates it by about 0.4 s. It is worth explaining the difference between the two "This work"-voices in Table 2. Summation refers to the standard formula (second term of Eq. (2)) and uses the cumulative yields as reported in the library. On the other hand, the last line contains the mean half-life computed by using the new set of abundances (third term of Eq. (2)). Comparing the two gives an estimation of the quality of the fit. The two uncertainties reported in the last line are the ones computed by neglecting or taking into account the correlations, respectively. Note that the uncertainty-value reflects not only the uncertainty in the nuclear data but also in the fitting procedure, which is negligible.
Since the differences between the curves in both the DN emission rate and the reactivity plot were indiscernible, their ratio has been thought to be a better variable to quantify the effect of the chosen abundances set. One should note how small differences in the delayed-neutron activity lead to much smaller discrepancies in the reactivity. The reason for that is the relationship between the quantity of interest and the abundances themselves. As shown in equation. (5) the activity depends on the abundances through exponentials, while the reactivity is a linear combination of the abundances (see Eq. (9) for the reactivity expressed in dollars).
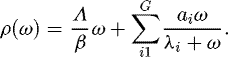 (9)
(9)
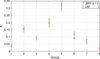 |
Fig. 1 Abundances comparison. |
Abundances and decay constants.
Mean DN precursors' half-life.
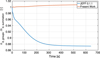 |
Fig. 2 Effect of the abundances on the DN activity. |
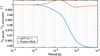 |
Fig. 3 Effect of the abundances on positive reactivities. |
3 Uncertainty estimation
For the uncertainty estimation, a Monte Carlo approach has been chosen. In solving equation (8), all the parameters (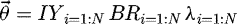 ) have been perturbed according to their uncertainty and to a random number sampled from a Normal Distribution. Attention has been put to verify the validity of the individual perturbed parameters (0 ≤ BR ≤ 1, IY > 0 etc.) but more needs to be done to globally satisfy the physics (e.g.
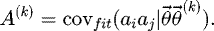
  ). For each simulation k, the DN activity has been computed and a nonlinear least-square fit performed. The procedure has been repeated MC times (MC = 10 000 in this work). As a consequence, 10 000 sets of fitted 8-groups abundances have been produced. The CONRAD code also provides the associated conditional covariance matrix, called A(k), which is the covariance matrix obtained when the set of input parameters
  corresponds to the perturbed one
  . This covariance matrix is associated to the fit, and not to the random sampling.
 (10)
(10)
Figure 1 shows the average of the mentioned sets. The MC sets of abundances have been used to derive the standard deviations (Eq. (11)) and the covariance matrix (Eq. (12)) due to the random sampling.
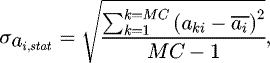 (11)
(11)
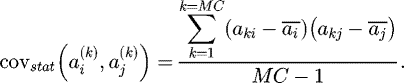 (12)
(12)
The next step has been to compute the expected value of the covariance matrix due to the fit (E(A(k))) in order to apply the Total Covariance Theorem (Eq. (13)), where the first term is computed from the MC sets of fitted parameters and the second is the average of the MC covariance matrices provided by CONRAD and associated to the fitting procedure [7].
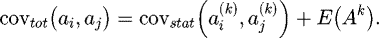 (13)
(13)
Finally, the total standard deviations have been computed by taking into account both the statistics and the quality of the fit (Eq. (14)) and used to derive the correlation matrix (Eq. (15) and Fig. 4).
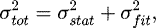 (14)
(14)
 (15)
(15)
4 Conclusions and perspectives
All the procedures mentioned before have been coded in C++ and automatized. The new abundances lie in the range of uncertainty of the recommended values, except for group 6 and 7. The new set of abundances seems to better reproduce both the delayed-neutron activity and the reactivity curves than JEFF-3.1.1 with respect to the curves obtained by summation method. However, uncertainties are larger, since they take into account the large uncertainty in the microscopic decay data of each isotope ( ) and the negligible uncertainty coming from the fit. For the first time, a correlation matrix is associated to the abundances. Even though the parameters result to be loosely correlated, the employment of the correlation matrix in the uncertainty propagation still has an effect, as shown in Table 2. The procedure will be repeated for fissioning systems and energies other than
  and
and  . The potential of this technique is the possibility of verifying the quality of the nuclear data and of predicting the quantities of interest for fissioning systems for which experiments are not available. In the future, the effect of the correlations on the uncertainty propagation will be further investigated. A more consistent way of perturbing the parameters, as well as the possibility of performing the fit in separate steps, is also under investigation. An experiment is planned at ILL in 2018 to measure only what has been so far calculated. This will help to compare microscopic and macroscopic approaches and will provide new experimental data for subsequent studies. Special attention will be paid to experimental uncertainties, in the interest of providing consistent uncertainty and correlation values associated with the measured abundances.
References
- V.M. Piksaikin et al., Prog. Nucl. Energy 41, 203 (2002) [CrossRef] [Google Scholar]
- G. Rudstam et al., NEA-WPEC-6 4, 2002, pp. 96–127 [Google Scholar]
- G.R. Keepin, Phys. Rev. 107, 231 (1957) [Google Scholar]
- M.C. Brady, T.R. England, Prog. Nucl. Energy 103, 129 (1989) [Google Scholar]
- R.W. Mills et al., in Nuclear Data for Science and Technology (Springer Science & Business Media, 1992), pp. 86–88 [CrossRef] [Google Scholar]
- D.E. Gremyachkin et al., Prog. Nucl. Energy 83, 13 (2015) [CrossRef] [Google Scholar]
- C. De Saint Jean et al., Nucl. Sci. Eng. 161, 363 (2009) [CrossRef] [Google Scholar]
The use of cumulative yields hides the assumption that all the precursors reached their equilibrium concentration.

JEFF-3.1.1 contains the abundances and the decay-constants recommended by the WPEC-SG6 [2]
Cite this article as: Daniela Foligno, Pierre Leconte, Uncertainty and covariances of the newly derived 8-groups delayed-neutrons abundances set, EPJ Nuclear Sci. Technol. 4, 31 (2018)
All Tables
All Figures
|
Fig. 1 Abundances comparison. |
| In the text | |
|
Fig. 2 Effect of the abundances on the DN activity. |
| In the text | |
|
Fig. 3 Effect of the abundances on positive reactivities. |
| In the text | |
 |
Fig. 4 Correlation matrix from equation (15). |
| In the text | |
Current usage metrics show cumulative count of Article Views (full-text article views including HTML views, PDF and ePub downloads, according to the available data) and Abstracts Views on Vision4Press platform.
Data correspond to usage on the plateform after 2015. The current usage metrics is available 48-96 hours after online publication and is updated daily on week days.
Initial download of the metrics may take a while.