Open Access
Fig. 7
Download original image
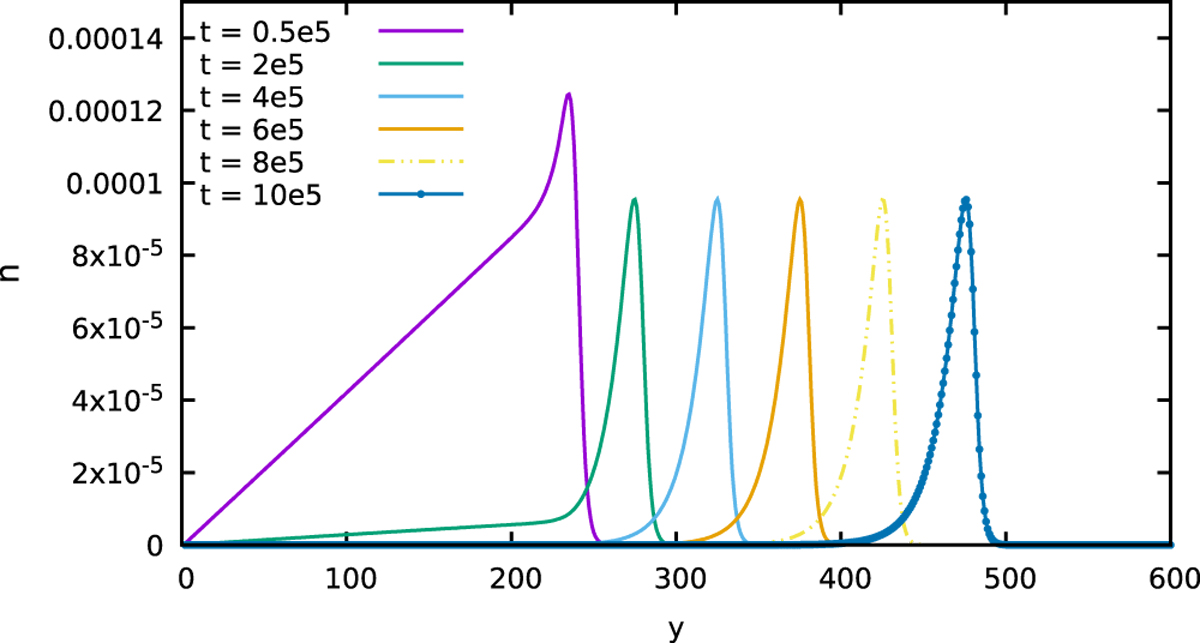
The concentrations of neutrons as a function of the spatial coordinate y in the different moments of time (from t = 200 000 to t = 1 000 000) obtained from the numerical solution. The different lines correspond to the particular moments of time.
Current usage metrics show cumulative count of Article Views (full-text article views including HTML views, PDF and ePub downloads, according to the available data) and Abstracts Views on Vision4Press platform.
Data correspond to usage on the plateform after 2015. The current usage metrics is available 48-96 hours after online publication and is updated daily on week days.
Initial download of the metrics may take a while.