Fig. 1
Download original image
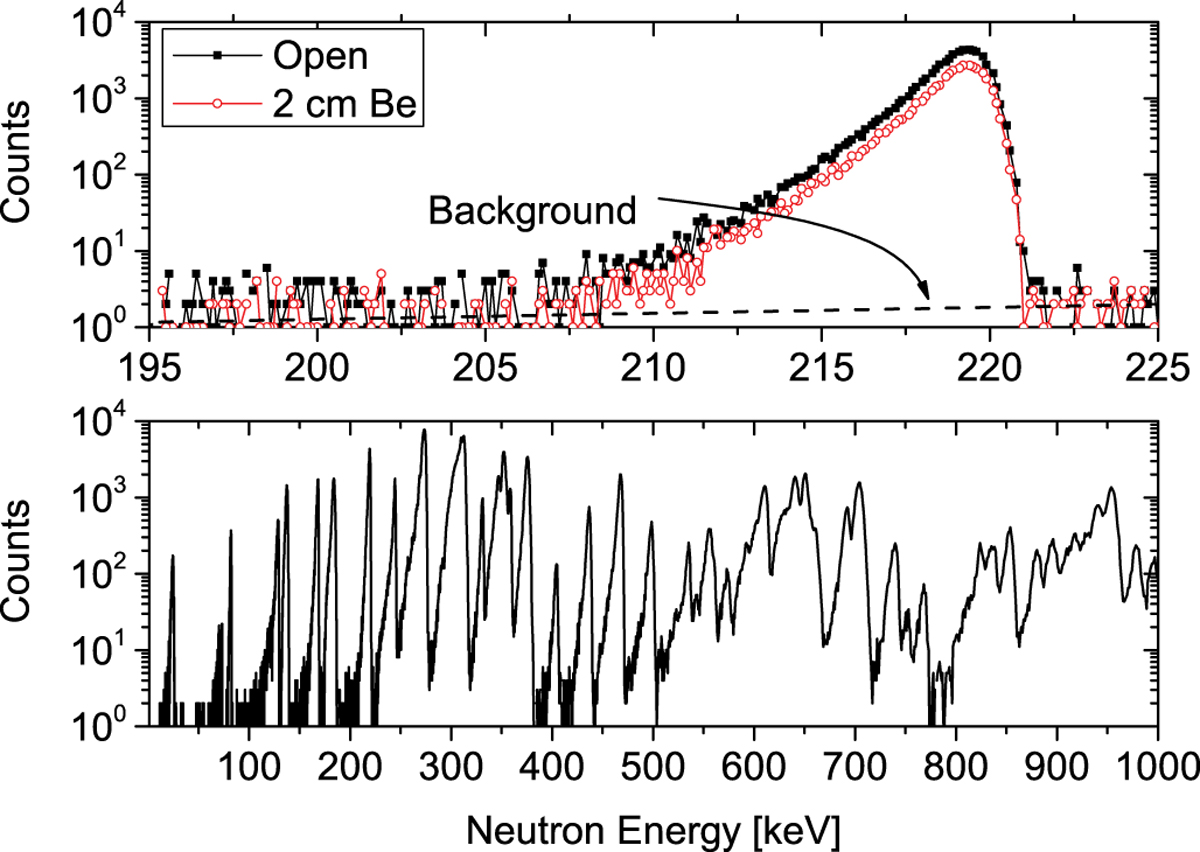
Example of counts obtained in an iron filtered beam experiment. The bottom plot shows peaks in the useful energy range and the top plot shows the signal and background for one of the peaks used in a transmission measurement of Be. For full experimental details see reference [5].
Current usage metrics show cumulative count of Article Views (full-text article views including HTML views, PDF and ePub downloads, according to the available data) and Abstracts Views on Vision4Press platform.
Data correspond to usage on the plateform after 2015. The current usage metrics is available 48-96 hours after online publication and is updated daily on week days.
Initial download of the metrics may take a while.