Open Access
Fig. 5
Download original image
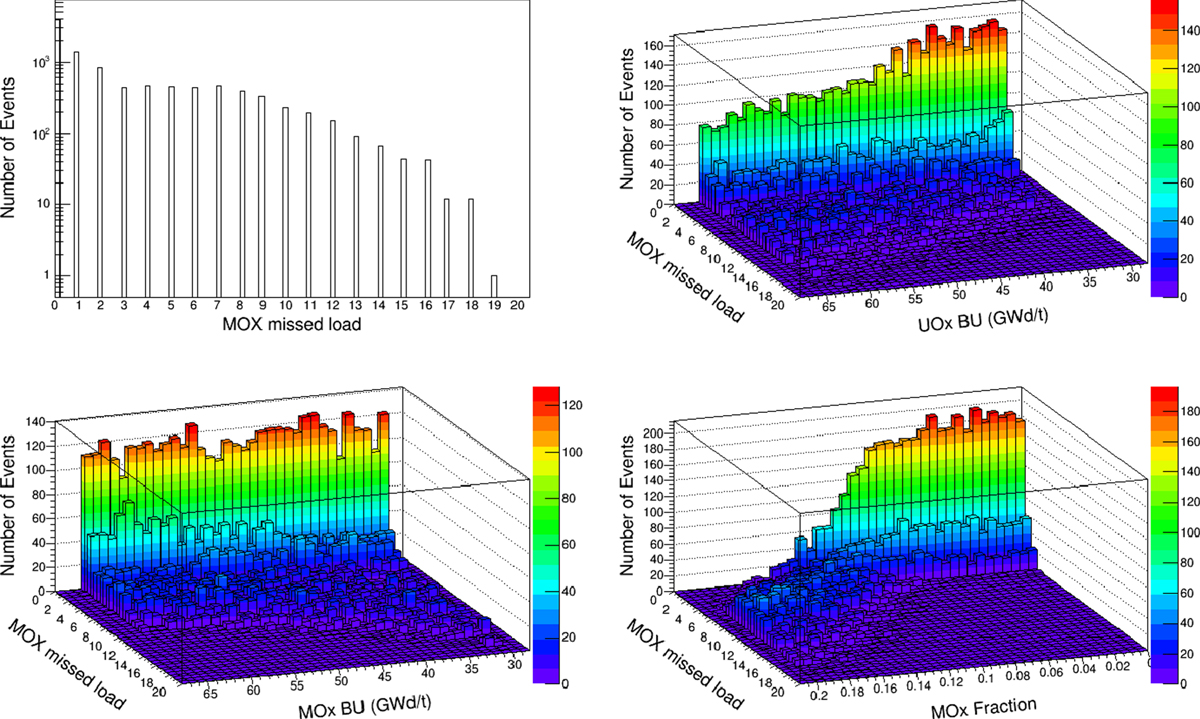
Number of PWR-MOx missed loadings at the end of scenario (t = 100 years). The figure up left is the distribution. Plots up right, bottom left and bottom right are respectively their distribution according to the PWR-UOx Burn-Up, the PWR-MOx Burn-Up and the PWR-MOx thermal power fraction.
Current usage metrics show cumulative count of Article Views (full-text article views including HTML views, PDF and ePub downloads, according to the available data) and Abstracts Views on Vision4Press platform.
Data correspond to usage on the plateform after 2015. The current usage metrics is available 48-96 hours after online publication and is updated daily on week days.
Initial download of the metrics may take a while.