Fig. 9.
Download original image
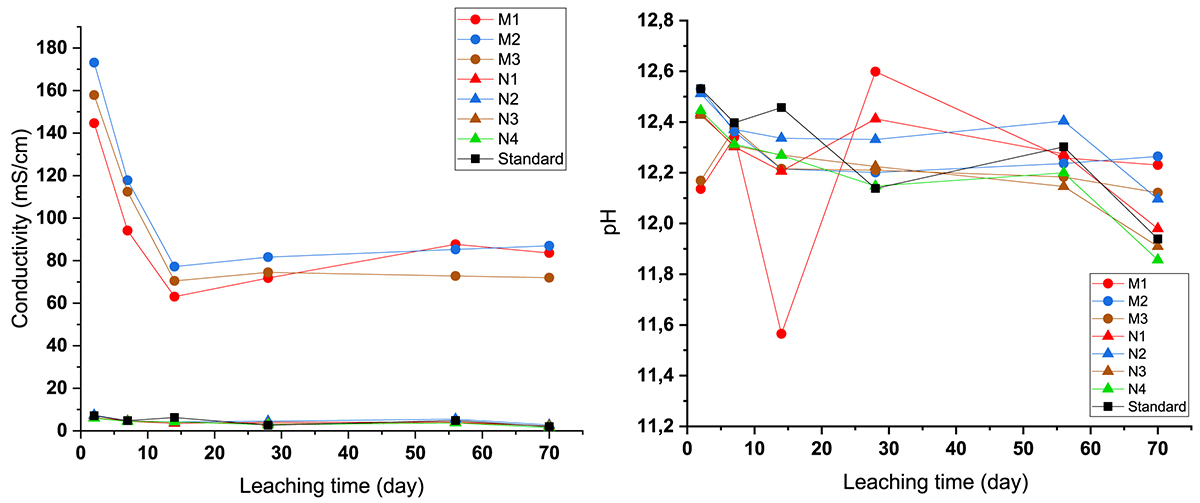
Electrical conductivity (left) and pH values (right) of samples with Mogul (M1 5 wt.%, M2 10 wt.%, M3 20 wt.%) and Nevastane (N1 5 wt.%, N2 10 wt.%, N3 20 wt.%, N4 30 wt.%) during leaching. Uncertainties for conductivity measurements range from ±0.21 to ±8.06 mS/cm, and for pH measurements from ±0.003 to ±0.22, across all samples and time points.
Current usage metrics show cumulative count of Article Views (full-text article views including HTML views, PDF and ePub downloads, according to the available data) and Abstracts Views on Vision4Press platform.
Data correspond to usage on the plateform after 2015. The current usage metrics is available 48-96 hours after online publication and is updated daily on week days.
Initial download of the metrics may take a while.