| Issue |
EPJ Nuclear Sci. Technol.
Volume 11, 2025
|
|
|---|---|---|
| Article Number | 46 | |
| Number of page(s) | 11 | |
| DOI | https://doi.org/10.1051/epjn/2025041 | |
| Published online | 25 August 2025 | |
https://doi.org/10.1051/epjn/2025041
Regular Article
(α+9Be) neutron production cross sections trends to improve neutron spectrum calculations using MCMC techniques
CEA, DES, IRESNE, DER, Service de Physique des Réacteurs et du Cycle, Cadarache, F-13108 Saint-Paul-lez-Durance, France
* e-mail: This email address is being protected from spambots. You need JavaScript enabled to view it.
** e-mail: This email address is being protected from spambots. You need JavaScript enabled to view it.
*** e-mail: This email address is being protected from spambots. You need JavaScript enabled to view it.
**** e-mail: This email address is being protected from spambots. You need JavaScript enabled to view it.
Received:
28
March
2025
Received in final form:
2
July
2025
Accepted:
2
July
2025
Published online: 25 August 2025
Abstract
This work presents different methodologies to estimate trends on α+9Be neutron production cross sections to enhance neutron spectrum calculation of alpha beryllium sources. The simulation of an Am-Be source and its comparison with several experimental references are presented. This study highlights the contribution of neutron angular distributions to reduce the gap between experimental and calculated spectra. The use of EXFOR angular distributions shows interesting results for outgoing neutrons between 5 MeV and 10 MeV. Cross sections are re-estimated using a Markov Chain Monte Carlo algorithm. The global methodology is based on a coupling between a Geant4 tool, SaG4n, and a Metropolis-Hastings algorithm. The cross sections adjustments suggest the mis-estimation of the (α, α + n) reaction and partial (α, ni) reactions. In this context, two ways of modeling cross sections are compared: one using Bayesian inference, and one using Gaussian processes.
© B. Sylvain et al., Published by EDP Sciences, 2025
 This is an Open Access article distributed under the terms of the Creative Commons Attribution License (https://creativecommons.org/licenses/by/4.0), which permits unrestricted use, distribution, and reproduction in any medium, provided the original work is properly cited.
1. Introduction
Neutron sources find extensive applications across various domains, such as reactor physics, radioisotope production, metrology, and nuclear medicine. Among the different types of neutron sources employed, those sources using beryllium-9 for neutron emission via the (α, n) reactions are very commonly used. A neutron source is primarily characterized by its neutron emission rate and its energy spectrum. Despite the absence of covariance matrices in the ENDF files, important biases are still observed between calculated and experimental neutron spectra for these neutron sources.
Most of the published works studying beryllium-9 neutron sources focus on 241Am-9Be sources. The spectrum comparisons presented in the state-of-the-art are based on various computational codes. Among the available tools, NEDIS-2m is a code specifically developed for evaluating neutron spectra and production rates from (α, n) reactions. The MC21 Monte Carlo code is also commonly used to model alpha particle transport and determine the resulting (α, n) neutron spectrum. In addition, SOURCES-4C is widely recognized as the American reference code for calculating neutron sources from both (α, n) reactions and spontaneous fission [1–4].
Figure 1 illustrates the disagreement between the codes and the measurements on the neutron spectrum of the 9Be(α, n) source. The main discrepancies are in the following regions of the outgoing spectra: 0–2.5 MeV, 3–6 MeV and 6.5–10 MeV. In Figure 1, the ISO spectrum corresponds to the spectrum measurement from [5]. This experimental observation shows various characteristics that are also visible in [6]. This latter study reveals a large quantity of experimental spectra showing similar characteristic peaks. It is possible to add the measurements of a 239Pu-9Be source [7] which indicates similar characteristics in the 9Be(α, n) spectra.
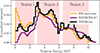 |
Fig. 1. ISO spectrum, SOURCES-4C spectrum and Nedis-2m spectrum of a 9Be (α, n) source. |
Neutron spectrum calculation for the 241Am-9Be source primarily depends on the following parameters: stopping powers, the cross sections of the reaction channels involved, and the angular distribution of each participating reaction.
Regarding the stopping powers knowledge, literature provides certain information. As described in [8], stopping powers represent a second-order uncertainty term in (α, n) calculations. To verify these assumptions, calculations using available stopping powers have been performed and are presented in the second section of the paper.
Besides, the literature indicates uncertainties in the evaluation of (α, n) cross sections as described in these two works [9, 10]. The latter report highlights the disparities for energy higher than 4.5 MeV for the beryllium-9 in the case of the (α, n) and (α, α + n). Figure 2 illustrates the available experimental [11, 12] and evaluated cross sections data [13]. Significant disagreements can be observed regarding the participating reaction. Moreover, the considerations taken by the US National Naval Laboratory with the Holmes work [9] to enhance the Am-Be neutron spectrum calculation are based on the discrepancies between the Geiger and Van Der Zwan measurements and the JENDL/AN-2005 evaluation of the partial inelastic cross sections.
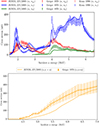 |
Fig. 2. Cross sections comparisons between JENDL-AN/2005 and experimental values. |
Then, a previous work [14] has shown how important the angular data are in the calculation of the 9Be(α, n) spectra and emphasized the need to find new trends on cross sections with the SaG4n tool. It has also shown a need for further work about the angular distribution data to potentially explain neutron spectrum differences. The angular data need of the 9Be(α, n) reaction has already been identified by [8].
The available data on the energy-angle distribution, i.e., the angular distribution, are highly limited. Indeed, only two distinct datasets derived from experimental measurements exist for the studied incident energy range. Moreover, the lack of a covariance matrix for the angular data prevents reliable adjustments. In this context, the influence of the angular data was determined by selecting the most reliable dataset based on comparative analysis. By constraining the angular distribution, this study assessed the potential influence of the cross sections on these C/E discrepancies.
This study aims to propose new trends for inelastic 9Be cross sections, with comparisons to state-of-the-art observations, experimental measurements, and evaluated data. In addition, this work aims to highlight the need for future experimental cross section measurements and suggest potential inconsistencies in the JENDL angular distribution data.
Section 2 presents the input data, models, and computational tools used in this work, including a discussion of possible sources of error that may affect the neutron energy distribution, such as stopping powers and angular distributions. Section 3 describes the two approaches used to determine trends on the 9Be(α, n) cross sections. The results of the two methodologies are exposed and discussed in Section 4. Conclusion and outlooks to reduce the calculated spectra bias are proposed in the last part of the paper.
2. Calculation of (α, n) spectrum and SaG4n specificities
2.1. Computational tool SaG4n
The SaG4n code [15, 16] is a Monte Carlo tool based on Geant4 for the purpose of (α, n) sources calculations. This code models the slowing down by ion interactions, followed by neutron emissions using nuclear data and 2-body kinematics models. Unlike SOURCES-4C, this code assumes anisotropic reactions in the centre of mass using MF6 data derived from the JENDL/AN-2005 library [13]. The SaG4n code also allows to simulate the transport of the secondary particles emitted by the studied system. The SaG4n simulations presented in this study will use this option.
With a 241Am-9Be source, the (α, n) reaction is composed of multiple inelastic reactions. The contributions of each partial reaction are shown in Figure 3.
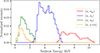 |
Fig. 3. Normalized partials contributions from SaG4n calculations with JENDL/AN-2005s. |
 (1)
(1)
In this work, each reaction will be labeled respectively as follows: ngs, n1, n2 and nbk.
The energy of the emitted neutrons depends on the level reached by the recoil carbon-12 or recoil beryllium-8. These reactions, shown in (Eq. (1)), differ by their nuclear parameters: partial cross-sections and excitations energy. Figure 3 indicates that the discrepancy in region 1 should be linked to the parameters of the n2 excited state and to the parameters of the nbk break-up reaction. Likewise, the region 2 corresponds to the evaluation of the n1excited state and region 3 is produced by the ngs contribution.
The additional contribution of the following reactions, 9Be(n, 2n), (n, abs) and (n, n) were also taken into account thanks to the secondary particle modeling. Their impact is illustrated in Figure 4, showing their importance with the JENDL + n curve. Because of the size and composition of the Am-Be sources the 9Be(n, 2n), (n, abs) represent less than 1.5% of the neutron reaction inside the source. The modification brought by the neutron transport is mainly due to neutron scattering through the matter.
Figure 4 presents the spectrum produced with SaG4n, the measured ISO spectrum and the spectrum obtained from the measurement in Tohamy’s work [6]. In regions 2 and 3, the SaG4n computation display peaks are absent when using SOURCES-4C. This observation is made possible using angular data, and a brief description of the angular data is provided in Section 2.3. Furthermore, the distribution produced by SaG4n for the (α, α + n) seems more accurate than the SOURCES-4C distribution. This improvement is achieved using an angular distribution following the N-Body Phase Space distribution [17].
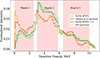 |
Fig. 4. SaG4n spectrum with JENDL-2005/AN angular description (model 1). |
Both measured spectra help identifying the calculation bias. The spectrum obtained from the measurement in Tohamy’s work seems to fit well to spectra from the literature given the numerous comparisons made in [6]. In the following, we thus select it as the reference spectrum.
The measured source in this work corresponds to an Amersham AMN.24, which is a cylindrical industrial source. Given its size, with a radius of 1 cm and 5 cm of height, the neutron transport through the source is not negligible for this spectrum analysis as previously mentioned. Then, the simulation presented in our work follows the same dimensions and composition.
2.2. Stopping powers
At first, the investigation of the stopping powers impact was studied. To obtain an idea of the neutron spectrum sensitivity to the stopping powers, calculations using two different datasets were performed.
The 241Am-9Be neutron sources, as investigated in [6], are usually characterized by a mass ratio Be/Am ranging from 12 to 70. Then it appears reasonable to consider only beryllium atoms as significant for the alpha slowing down. The two stopping powers data sets follow the Ziegler formalism [18] as used in the SaG4n code and corresponds to the following data: [18] and [19]. These stopping powers data are respectively used by SOURCES-4C and SaG4n. These ICRU and Ziegler data sets corresponds to two different experimental values given without any additional uncertainties’ information.
As shown in Figure 5, these two datasets present wide variations and differ by to 20% at 5 MeV. Yet it only results in at most 0.3% of neutron spectrum differences across all energy bins.
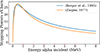 |
Fig. 5. 9Be stopping powers datasets. |
This calculation shows the very limited impact of the stopping powers for the neutron spectrum improvement and seems to confirm the need to enhance nuclear cross sections and angular data.
2.3. Angular data
As already discussed, the importance of angular data for a better description of the spectrum is highlighted. The angular data (MF6) in the case of the 9Be( reactions follows a two-body distribution fitted with Legendre polynomials coefficients. The JENDL/AN-2005 Legendre coefficients are derived from the angular measurements [20]. Then, the cross sections can be described with equation (2) with f(μ, E) the angular distribution.
 (2)
(2)
The angular distribution is a function of μ the cosine of the scattered angle and E the energy of the incident particle.
As it is mandatory to account for angular distribution to derive the outgoing neutrons energy, the first step is to review such data to minimize gaps. However, only a few data are available in addition to the JENDL/AN-2005 for the beryllium-9. Thanks to the EXFOR database [21], the angular distributions produced by [11] are accessible. After renormalization for the ENDF-6 format, this angular distribution is used with the JENDL/AN-2005 cross sections and provide the blue curve in Figure 6.
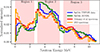 |
Fig. 6. SaG4n spectrum with JENDL/AN-2005 (green, model 1) and updated JENDL angular distribution using EXFOR data (blue, model 2). |
The comparison in Figure 4 between the curve obtained using SaG4n with JENDL data and the one obtained using SaG4n with EXFOR angular data reveals significant modifications in regions 2 and 3. These data clearly enable the retrieval of the expected peaks at 5, 7.8 and 9.8 MeV in regions 2 and 3. As evaluated in Table 1, this addition helps us to reduce the disagreements in the three regions. Table 1 presents the mean squared errors applied to each region’s spectra and can be expressed as:
 (3)
(3)
Spectrum comparison between reference to JENDL and JENDL + EXFOR.
The SRef relates to the reference spectrum from Tohamy [6] and SCal to the calculated spectrum. The squared errors are obtained for each energy bin in the observed region.
As visible with this table, the modifications bring the resulting spectrum closer to the Tohamy spectrum (and to the ISO as well). The re-estimations are performed using this improved file (MF3: JENDL, MF6: EXFOR data). Nonetheless, the improved model remains different in comparison to the reference spectrum mainly in regions 1 and 2.
3. Adjustment methodology
The Metropolis – Hasting algorithm [22] (MH), is a well-known Markov chain Monte Carlo process, and is widely used in various domains to determine a sample distribution. The goal is to reduce the discrepancies between the SaG4n + EXFOR spectrum and the reference one from [6]. To that end, we take advantage of the MH algorithm and we compare its coupling with two approaches for the update of the partial cross sections. The first approach, referred to as Path A, consists in a Bayesian inference on the partial cross sections. The second approach, the Path B, uses a Gaussian process representation of the partial cross sections, which provides a multivariate normal distribution of the data. The algorithm used for the first approach is structured as described in Algorithm 1.
This approach with a MH algorithm aims to estimate the expectation value of the posterior distribution. In order to obtain it, a rejection test is performed and applied to a log-posterior ratio. This functionality is detailed with the log-posterior ratio Li of the i-th iteration with equation (4). This formulation is only valid in the case of symmetric distribution of fi, as used in this work.
 (4)
(4)
With the function, f corresponding to the posterior probability is expressed in equations (5) and (6):
 (5)
(5)
 (6)
(6)
Here the  corresponds to the likelihood defined as a normal probability density function (PDF). The
  indicates the mean PDF over the energy bins, thus normalizing the log-likelihood prevents it from being sensitive to the size of the support of the different vectors. It should be emphasized that every fi estimation requires a call to SaG4n.
3.1. Methodology A: Bayesian adjustment
Path A is based on the inference of cross sections from JENDL/AN-2005 library. Given the large number of points, the overall methodology for Path A relies on an iterative adjustment of cross sections over energy group’s intervals. To achieve this, the target energy domain is divided into groups of 5 consecutive energy bins. For each group, several thousand iterations are generated thanks to the iteration loop as detailed on Algorithm 1 with the loop over i. Then, the entire target energy domain is covered using a sliding window without overlapping. To get an idea of the computation time required by this methodology, a single calculation using SaG4n takes approximately 15 seconds under these conditions. When convoluted over 20 energy points and 2000 iterations for each group interval, a single chain results in a full day of calculation.
This Bayesian methodology and the associated MH algorithm were developed directly in python for the purpose of this work.
1: Input: Sref, Sjendl, Xjendl, σn2, σbk1
2: Compute f0
3: for j = 1 to Ngroups do:
4: for i = 1 to n do:
5: Sample u ~ U(0.001, 1)
6: Sample X̃b,j ~ N (Xb,j, σb)
6b: Sample X̃n2,j ~ N (Xn2,j, σn2)
7: Compute Li
8: If log(u) < Acceptance ratio = min (0, Li):
Xb,j = X̃b,j
Xn2,j = X̃n2,j
Xgs,j = Xgs,j + Cgs,j
Xn1,j = Xn1,j + Cn1,j
9: Output: Xb, Xn2, Xgs, Xn1
With:
 (7)
(7)
Equation (7) expresses the correction term applied to the reaction k (i.e., gs orn1) to conserve the total cross section.
-
Xreac, j: refers to cross section vector of reaction reac of the energy group j,
-
σ: refers to the sampling step of the specified reaction,
-
n: refers to the number of samplings.
To compute Path A, the calculation hypothesis are partly based on literature review with:
-
conservation of the total cross section.
-
The prior uncertainties on cross sections (α, α + n) and (α, n2).
-
α incident energy range.
The first assumption relies on the comparisons in Figure 7 showing the total evaluated and measured cross section. The total cross section JENDL/AN-2005 calculated with R-Matrix analyses agrees well with the experimental data [12, 23, 24]. This point has been considered in the Romano’s synthesis and [9] where the total cross section were unchanged to perform cross sections modification.
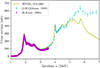 |
Fig. 7. Comparison of total Be 9(α, n) cross section. |
The large fluctuation above 5.2 MeV is the consequences of the (α, α + n)+(α, n) cross section from the Gibbons and Macklin measurement, in comparison to the JENDL/AN-2005 curve exposing the only the (α, n) cross sections.
Thanks to these observations, the hypothesis of a total cross section sufficiently evaluated has been conserved and seems consistent with the experimental data.
The prior uncertainties were selected according to the visible deviations between experimental and evaluations data cross-sections as shown in Figure 2. From their comparisons, the prior uncertainties were chosen to be around 40% for the nbk and about 25% for the n2 reaction.
The selected energy domain has been chosen according to alpha energy importance considering the cross sections and the difference between evaluation and experiments in Figure 2. As previously mentioned, the region over 4.5 MeV seems particularly uncertain. Moreover, as depicted with the previous figure and observations, (α, α + n) and (α,n2) reactions seem poorly evaluated. Since they represent the mains contributors to the most uncertain neutron spectrum parts (region 1), these reactions were chosen for sampling. For these arguments, the α energies range Eα is limited to Eα = [4.7 − 5.6 MeV] for the path A to induce modifications in the region 1 of the neutron spectrum.
3.2. Methodology B: Gaussian process
Path B aims to model the cross sections using Gaussian processes. The objective of this method is to avoid the limitations of Path A in terms of computing time by invoking the Metropolis-Hastings (MH) algorithm for the entire energy region and working on all cross sections simultaneously. Additionally, it enables the integration of covariance relationships between points. The flexibility provided by the Gaussian processes makes it possible to expand the studied alpha energy region in comparison to the first method.
The two approaches thus differ on the way the samples are drawn as described in Section 3.2.1. Section 3.2.1 also detail the Gaussian process regression. During the burn-in phase, after every acceptance of a draw, the GP hyper-parameters must be updated according to the new accepted cross section. Then, once the burn-in is finished, the chain keeps evolving with two fixed sampling models. The criteria of rejection of the samples and the methodology still follows the MH structure described in Algorithm 2.
1: Input: Sref, Sinit, Xjendl, μ(.), k(.,.). n0
2: Compute f0
3: for i = 1 to n do:
4: if i ≤ n0
4b: Fit GP (μn2, Kn2)
4c: Fit GP (μb, Kb)
5: Sample u ~ U(0.001, 1)
6: Sample X̃b ~ GP (μb, Kb)
6b: Sample X̃n2 ~ GP (μn2, Kn2)
7: Compute Li
8: If log(u) < Acceptance ratio = min(0, Li):
Xb = X̃b
Xn2 = X̃n2
Xgs = Xgs + Cgs
Xn1 = Xn1 + Cn1
9:Output: Xb, Xn2, Xgs, Xn1
-
μb: refers to the mean function of the breakup reaction.
-
Kb: refers to covariance matrix of the breakup reaction.
Otherwise, in this path B we still conserve the total cross sections thanks to the correction terms ( Cgs, Cn1) and use the prior uncertainties on cross sections (α, α+n) and(α, n2) established with Path A.
In addition, with this second approach, the α energy range can be extended. As visible with the two-body kinematics relation between Eα, En and the emission angle θ ∈ [0−180°] displayed in Figure 8, a larger α energy range could participate to the neutron distribution differences (e.g., 0–2 MeV and 2–3 MeV). So, the energy range Eα is set to Eα = [4.0 − 5.6 MeV]. This ensures physical and consistent results throughout the iteration, by preserving the important opening threshold at 4 MeV. Indeed, due to the properties of the Gaussian process regression, including energies below 4 MeV in Path B would tend to smooth out this peak.
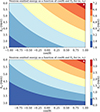 |
Fig. 8. Kinematics relation between angle and incident α energy (two-body kinematics). Top: 1st excited state. Bottom: 2nd excited state. |
3.2.1. Gaussian process description
A previous work [25], illustrates the benefits of the Gaussian process (GP) to estimate nuclear data. It has shown the capacity of GP to produce interesting cross sections, with accurate posterior uncertainty. Others work [26, 27] also shows innovative use of the gaussian process to the posterior estimation of nuclear data and parameters, taking into account model defects.
A GP is defined with a mean function μ(E) and a covariance function (kernel) k(E, E ′) symmetric and positive definite.
These two quantities allow us to define a multivariate normal law as N(μ,K). The mean function and the covariance function are predefined thanks to their initialized hyper-parameters, such as the length scale l of the kernel. The functions μ(.) and k(., .) are determined after the tuning of the hyper-parameters. This tuning is based on the log-likelihood minimization of the hyper-parameters conditioned to the selected training data (Et, X(Et)). The tuning of the GP is realized thanks to the Scikit-learn Python library [28, 29] using the default gradient descent algorithm from scipy.minimize.
The chosen kernel function is a ν− Matérn function, one of the most popular kernel functions in Gaussian process literature. Here, ν equals 2.5.
With the noise, the regression of the GP can incorporate additional information alongside the training data (Et, X(Et)). Considering the uncertainty of the observed parameters here (partial cross-sections), we chose a heteroscedastic εh i.e. a heterogeneous noise along the energy. Adding heteroscedastic noise involves adding the vector εh to the diagonal of the covariance matrix:
 (8)
(8)
The predictive distribution is retrieved by applying the conditional distribution of multivariate normal law to the training data. For example, a cross section at energy E ∉ Et, then a predictive average cross section  is obtained as follows:
 (9)
(9)
with Yt the reference signal at Et, k(E,Et) the covariance vector between the new energy coordinate E and the training data energy, and K −1 the inverse covariance matrix. The parameters Et and εh are set on the basis of the differences visible between experimental data from [11] and JENDL/AN-2005 data [13].
Then, using the predictive multivariate normal law obtained with the GP, the cross-sections are sampled simultaneously over the entire energy region of interest. Combined with the covariance information, this method allows us to generate samples while preserving prior information from the training data.
4. Discussion
4.1. Results A
Using Path A, the spectrum obtained enables slight modification, as described in Figure 9.
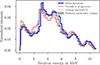 |
Fig. 9. Neutron spectrum obtained with method A (green). |
The calculation produces hardly an average spectrum closer to the chosen reference. It appears that important remaining deviations are still observed in the three regions of interest. As exposed in Figure 10, the adjusted cross sections to calculate this spectrum show modifications mainly on the break-up reaction as expected. One can also notice some variations on the n2 cross section, with an increase close to 5 MeV. Additionally, it seems necessary to decrease the (α, n1) cross section to see a slight reduction of the spectral intensity of the region 2. Although, this first method seems limited, the adjusted cross sections are not sufficiently well evaluated. In addition, the gap reduction is not significant enough to identify a clear trend. Table 2 summarizes the remaining MSE between the spectrum obtained with methodology A and our reference. Path A leads to a small degradation of the region 1 in comparison to Table 1. This observation suggests that sampling the nbk and n2 reactions with the Bayesian method over these restricted ranges of energy may limit its effectiveness. The two sampled reactions competing on the same output and input energies could induce compensation that would deteriorate convergence.
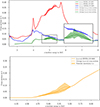 |
Fig. 10. Average cross sections obtained with Path A. |
This process reveals preliminary results, but it faces difficulties in making all the data converge independently. The lack of covariance data and the limited studied energy range pose difficulties. These limitations introduce biases and penalize the establishment of clear trends. In addition, this iterative approach with the sliding window may introduce bias by over adjusting the cross section of the lowest energy.
To overcome these obstacles, the Path B present a simplified and efficient method to obtain better trends.
4.2. Results B
Path B leads to a reduction of discrepancies in the spectrum as displayed in Figure 11 and Table 3. The values obtained with these MSE are the lowest value obtained by comparison to the reference. The improvement is particularly visible in the first region’s spectra, where the MSE is reduced by factor of 4 compared to path A and by a factor of 2 to the EXFOR result.
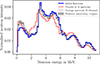 |
Fig. 11. Neutron spectrum obtained with MH adjustment using GP modeling of the cross sections. |
The adjustment leads to an increase in the nbk cross-section and a decrease for the n1 cross-section. As seen in Figure 11 region 1 is slightly over adjusted. This result seems to derive from the large uncertainty chosen for the break-up reaction according to the literature. Indeed, the calculations using the Gaussian process aligns with certain observations in the literature regarding the misestimation of the break-up reaction. Yet, the cross-sections reported by Geiger and Van der Zwan [11] could be overestimated based on this result.
This second approach leads to a better spectrum representation for regions 1 and 2. It confirms that Gaussian process method is more appropriate to give a better trend on these cross sections and produce convenient posterior distributions.
The discrepancy reductions in regions 1 and 2 (as evaluated in Tab. 3) seems directly linked to the modification of the nbk and n1 reactions. On the contrary to Path A, Figure 12 does not indicate a particular posterior distribution for the (α, n2) reaction. In the same way, it presents nearly no variation for the ngs cross-sections. These two analyses could lead to consider (α, n2) and (α, ngs) not sufficiently impactful to reduce the visible gaps. This work suggests modifying only the (α, n1) and (α, α + n) cross-sections.
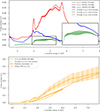 |
Fig. 12. Top: posterior partial cross-sections distributions obtained with GP. Bottom: posterior average break-up cross-sections distributions obtained with GP. |
The remaining deviations on ngs spectrum between B results and the reference could result from the angular distributions accuracy. To support this assumption, Figure 5 shows a similar shape in the ngs cross section by comparing the experimental data [11, 12] with those from JENDL in the 3–6 MeV energy range.
A shift in energy is particularly noticeable in region 2 of the spectrum and the range between 2 MeV and 3 MeV. This inconsistency seems to support the wrong assessments of the angular distributions even with the MF6 EXFOR data used in these calculations. The need for enhancement seems to be mainly required for the (α, n1) angular data regarding these discrepancies.
5. Conclusion and Outlook
In conclusion, this work successfully provides new trends for the alpha + 9Be neutron production cross sections for the neutron spectrum calculation of alpha beryllium sources. The contribution is twofold. First, calculations performed with SaG4n and MF6 files have shown the necessity to consider the anisotropic emission of neutrons to observe missing characteristics in the simulated spectrum when compared to experimental results. By using angular EXFOR data with SaG4n, the new simulated spectrum shows a better agreement with the experimental results from [6]. Then, the partial cross sections (α, α + n), that show high discrepancies in the literature are re-estimated following a Metropolis Hastings algorithm. Two methods are compared to adjust the cross sections: a Bayesian inference and the sampling of Gaussian process. We have shown that the use of Gaussian process for the perturbation of the cross-sections in the MH algorithm allows for significant updates and the estimation of interesting trends on these cross sections. In addition, both methods used to adjust the initial cross sections indicate a need to increase the break-up reaction cross-sections. The Gaussian process coupled to MH algorithm leads to a reduction of the gap in regions 1 and 2 between the computed spectrum and the Tohamy spectrum. This indicates a plausible overestimation of Van der Zwan cross-sections and underestimation of JENDL break-up cross-sections.
Trends can also be noted for the other reactions based on the results of the Gaussian process. In fact, the calculation produced with the second method seems to confirm potential (α, n1) overestimation in the JENDL-AN/2005 library.
Several outlooks can be considered to further improve the neutron spectrum. A new adjustment working directly and only on the (α, n1) and (α,α+n) without modifications on other cross-sections could be imagined to reduce the gap in the second region.
A future work on angular distributions adjustment is considered. Fitting the angular distributions for (α, n1), (α, ngs), (α, n2) reactions may solve some of the remaining discrepancies. The observations suggest a more forward focused neutron emission (α, n2) and backward focused on (α, n1) and (α, ngs).
To conclude this work, these adjustments show a strong need for new experiments to improve the angular distribution data of the different partial reactions of 9Be. The need for additional experimental measurements of the (α, n1), (α, n2) and break-up cross-sections could allow for verifications of the trends observed in this paper. As visible with the obtained trends, an accuracy of 10% on new experimental cross section data should be sufficient to confirm the trends on the nbk and n1 reactions.
The bk index refers to the breakup reaction.
Funding
This research did not receive any specific external funding.
Conflicts of interest
The authors declare that they have no known competing financial interests or personal relationships that could have appeared to influence the work reported in this paper.
Data availability statement
No data are associated with this article.
Author contribution statement
Bertholon Sylvain: Writing – review & editing, Methodology, Investigation, Conceptualization, Writing original draft. Antonsanti Pierre-Louis: Writing – review & editing, Conceptualization, Validation. Ben Yelles Anis: Writing – review & editing, Validating, Data curation, Supervision. Bernard David: Writing – review & editing, Validating, Supervision.
References
- W.B. Wilson, R.T. Perry, E.F. Shores, SOURCES 4C: A Code for Calculating (alpha,n), Spontaneous Fission, and Delayed Neutron Sources and Spectra, 2002 [Google Scholar]
- S.V. Bedenko, G.N. Vlaskin, N. Ghal-Eh, I.O. Lutsik, R. Irkimbekov, F. Rahmani, et al., Nedis-Serpent simulation of a neutron source assembly with complex internal heterogeneous structure, Appl. Radiat. Isot. 160, 109066 (2020) [Google Scholar]
- D.P. Griesheimer, D.F. Gill, B.R. Nease, T.M. Sutton, M.H. Stedry, P.S. Dobreff, et al., MC21 v.6.0 – A continuous-energy Monte Carlo particle transport code with integrated reactor feedback capabilities, Ann. Nucl. Energy 82, 29 (2015) [CrossRef] [Google Scholar]
- D.P. Griesheimer, A.T. Pavlou, J.T. Thompson, J.C. Holmes, M.L. Zerkle, E. Caro, et al., In-line (α,n) source sampling methodology for monte carlo radiation transport simulations, Nucl. Eng. Technol. 49, 1199 (2017) [CrossRef] [Google Scholar]
- D. Thomas, R. Bedogni, R. Méndez, A. Thompson, A. Zimbal, Revision Of Iso 8529-Reference neutron radiations, Radiat. Prot. Dosimetry 180, 21 (2018) [CrossRef] [PubMed] [Google Scholar]
- M. Tohamy, E.K. Elmaghraby, M.N.H. Comsan, Reevaluation of the neutron emission probabilities from 241Am–Be neutron source, Nucl. Instrum. Methods Phys. Res. A: Accel. Spectrom. Detect. Assoc. Equip. 942, 162387 (2019) [Google Scholar]
- M.E. Anderson, R.A. Neff, Neutron energy spectra of different size 239Pu9Be(α,n) sources, Nucl. Instrum. Meth. 99, 231 (1972) [Google Scholar]
- S.S. Westerdale, (alpha,n) Nuclear Data Evaluations and Data Needs, Summary Report of the Technical Meeting [Internet]. Vienna (Austria): International Atomic Energy Agency (IAEA), 2021 Nov. Report No.: INDC(NDS)–0836. https://inis.iaea.org/records/khpy0-3ad59 [Google Scholar]
- J. Holmes, A. Pavlou, J. Thompson, M. Zerkle, Naval Nuclear Laboratory Special Purpose O-17, O-18, Be-9 (α,n) Evaluations (Brookhaven National Laboratory, 2018) [Google Scholar]
- C. Romano, D. Brown, S. Croft, A. Favali, L. Nakae, M. Pigni, et al., (α,n) nuclear data scoping study [Internet]. 2020 Oct p. ORNL/TM-2020/1789, 1771892. Report No.: ORNL/TM-2020/1789, 1771892. https://www.osti.gov/servlets/purl/1771892/ [Google Scholar]
- K.W. Geiger, L. Van Der Zwan, Radioactive neutron source spectra from 9Be(α,n) cross section data, Nucl. Instrum. Meth. 131, 315 (1975) [Google Scholar]
- R. Kunz, S. Barth, A. Denker, H.W. Drotleff, J.W. Hammer, H. Knee, et al., Determination of the 9Be(α,n)12C reaction rate, Phys. Rev. C 53, 2486 (1996) [Google Scholar]
- T. Murata, H. Matsunobu, K. Shibata, in Evaluation of the (α,xn) reaction data for JENDL/AN-2005, Japan, 2006, p. 77 [Google Scholar]
- S. Bertholon, A. Ben-Yelles, D. Bernard, Bayesian Inference Re-estimation of 9 Be(α,n) Cross Sections by using Neutron Spectra measurements, Transactions of the American Nuclear Society – 130, 780 (2024). Available from: https://www.ans.org/pubs/transactions/article-56160/ [Google Scholar]
- V. Pesudo, E. Mendoza, V. Alcayne, D. Ott, P. Garcia-Abia, L. Romero, et al., SaG4n: Calculation of (α,n) yields for low background experiments using Geant4, J. Phys. Conf. Ser. 1468, 012059 (2020) [Google Scholar]
- E. Mendoza, D. Cano-Ott, P. Romojaro, V. Alcayne, P. García-Abia, V. Pesudo, et al., Neutron production induced by α-decay with Geant4, Nucl. Instrum. Methods Phys. Res. A: Accel. Spectrom. Detect. Assoc. Equip. 960, 163659 (2020) [Google Scholar]
- M. Herman, ENDF-6 Formats Manual [Internet]. National Nuclear Data Center Brookhaven National Laboratory, 2010 Jul p. 392. https://www.oecd-nea.org/dbdata/data/manual-endf/endf102.pdf [Google Scholar]
- J.F. Ziegler, Helium: stopping powers and ranges in all elemental matter (IBM Research: Pergamon Press, 1977) [Google Scholar]
- M.J. Berger, M. Inokuti, H.H. Andersen, D. Bichsel, D. Powers, S.M. Seltzer, et al., ICRU 49 Reports [Internet], 1993. Available from: https://journals.sagepub.com/doi/abs/10.1093/jicru_os25.2.280 [Google Scholar]
- A.W. Obst, T.B. Grandy, J.L. Weil, Reaction Be 9 (α,n) C 12 from 1.7 to 6.4 MeV, Phys. Rev. C 5, 738 (1972) [Google Scholar]
- N. Otuka, E. Dupont, V. Semkova, B. Pritychenko, A.I. Blokhin, M. Aikawa, et al., Towards a More Complete and Accurate Experimental Nuclear Reaction Data Library (EXFOR): International Collaboration Between Nuclear Reaction Data Centres (NRDC), Nucl. Data Sheets 120, 272 (2014) [CrossRef] [Google Scholar]
- W.K. Hastings, Monte Carlo sampling methods using Markov chains and their applications, Biometrika 57, 97 (1970) [NASA ADS] [CrossRef] [Google Scholar]
- J.H. Gibbons, R.L. Macklin, Total Cross Section for Be 9 (α, n), Phys. Rev. 137, B1508 (1965) [Google Scholar]
- P.R. Wrean, C.R. Brune, R.W. Kavanagh, Total cross sections and thermonuclear reaction rates for Be 9 (α,n) 12 C, Phys. Rev. C 49, 1205 (1994) [Google Scholar]
- H. Iwamoto, Generation of nuclear data using Gaussian process regression, J. Nuclear Sci. Technol. 57, 932 (2020) [Google Scholar]
- P. Helgesson, H. Sjöstrand, Treating model defects by fitting smoothly varying model parameters: Energy dependence in nuclear data evaluation, Ann. Nucl. Energy 120, 35 (2018) [Google Scholar]
- P. Helgesson, H. Sjöstrand, Fitting a defect non-linear model with or without prior, distinguishing nuclear reaction products as an example, Rev. Sci. Instrum. 88, 115114 (2017) [Google Scholar]
- GaussianProcessRegressor [Internet]. scikit-learn. [2024 Sep 30]. https://scikit-learn/stable/modules/generated/sklearn.gaussian_process.GaussianProcessRegressor.html [Google Scholar]
- C.E. Rasmussen, C.K.I. Williams, Gaussian processes for machine learning. 3. print (Cambridge, Mass.: MIT Press, 2008) [Google Scholar]
Cite this article as: Bertholon Sylvain, Antonsanti Pierre-Louis, Ben-Yelles Anis, Bernard David. (α+9Be) neutron production cross sections trends to improve neutron spectrum calculations using MCMC techniques, EPJ Nuclear Sci. Technol. 11, 46 (2025). https://doi.org/10.1051/epjn/2025041
All Tables
All Figures
|
Fig. 1. ISO spectrum, SOURCES-4C spectrum and Nedis-2m spectrum of a 9Be (α, n) source. |
| In the text | |
|
Fig. 2. Cross sections comparisons between JENDL-AN/2005 and experimental values. |
| In the text | |
|
Fig. 3. Normalized partials contributions from SaG4n calculations with JENDL/AN-2005s. |
| In the text | |
|
Fig. 4. SaG4n spectrum with JENDL-2005/AN angular description (model 1). |
| In the text | |
|
Fig. 5. 9Be stopping powers datasets. |
| In the text | |
|
Fig. 6. SaG4n spectrum with JENDL/AN-2005 (green, model 1) and updated JENDL angular distribution using EXFOR data (blue, model 2). |
| In the text | |
|
Fig. 7. Comparison of total Be 9(α, n) cross section. |
| In the text | |
|
Fig. 8. Kinematics relation between angle and incident α energy (two-body kinematics). Top: 1st excited state. Bottom: 2nd excited state. |
| In the text | |
|
Fig. 9. Neutron spectrum obtained with method A (green). |
| In the text | |
|
Fig. 10. Average cross sections obtained with Path A. |
| In the text | |
|
Fig. 11. Neutron spectrum obtained with MH adjustment using GP modeling of the cross sections. |
| In the text | |
|
Fig. 12. Top: posterior partial cross-sections distributions obtained with GP. Bottom: posterior average break-up cross-sections distributions obtained with GP. |
| In the text | |
Current usage metrics show cumulative count of Article Views (full-text article views including HTML views, PDF and ePub downloads, according to the available data) and Abstracts Views on Vision4Press platform.
Data correspond to usage on the plateform after 2015. The current usage metrics is available 48-96 hours after online publication and is updated daily on week days.
Initial download of the metrics may take a while.