Fig. 8.
Download original image
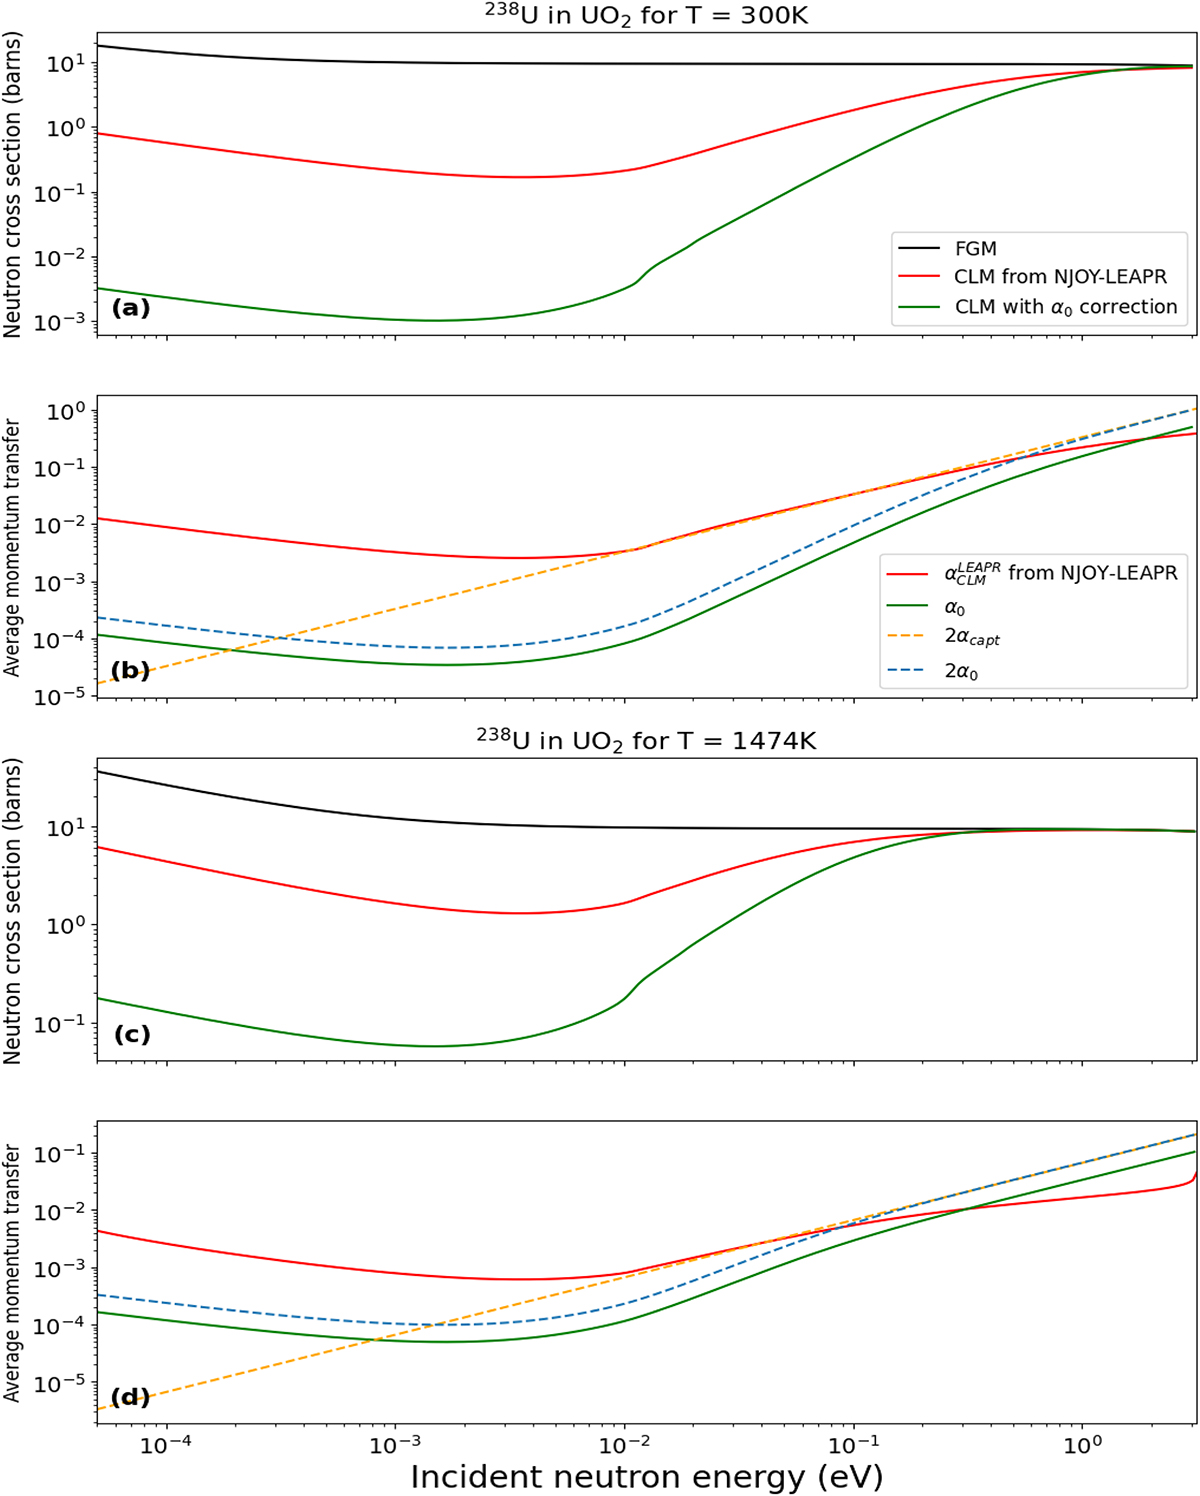
The plots (a, c) and the plots (b, d) represent the scattering cross sections and the average momentum transfer below the thermal cutoff energy as already shown in Figure 5. Plots (a, c) compare the previous results with the inelastic neutron scattering cross section calculated with the NJOY code using ![]() tables generated with its LEAPR module. Plots (b, d) compare the
tables generated with its LEAPR module. Plots (b, d) compare the ![]() correction deduced from the
correction deduced from the ![]() tables generated by LEAPR using Eq. (27). The CLM calculations were performed by using the same partial phonon densities of states shown in Figure 2.
tables generated by LEAPR using Eq. (27). The CLM calculations were performed by using the same partial phonon densities of states shown in Figure 2.
Current usage metrics show cumulative count of Article Views (full-text article views including HTML views, PDF and ePub downloads, according to the available data) and Abstracts Views on Vision4Press platform.
Data correspond to usage on the plateform after 2015. The current usage metrics is available 48-96 hours after online publication and is updated daily on week days.
Initial download of the metrics may take a while.