Fig. 6.
Download original image
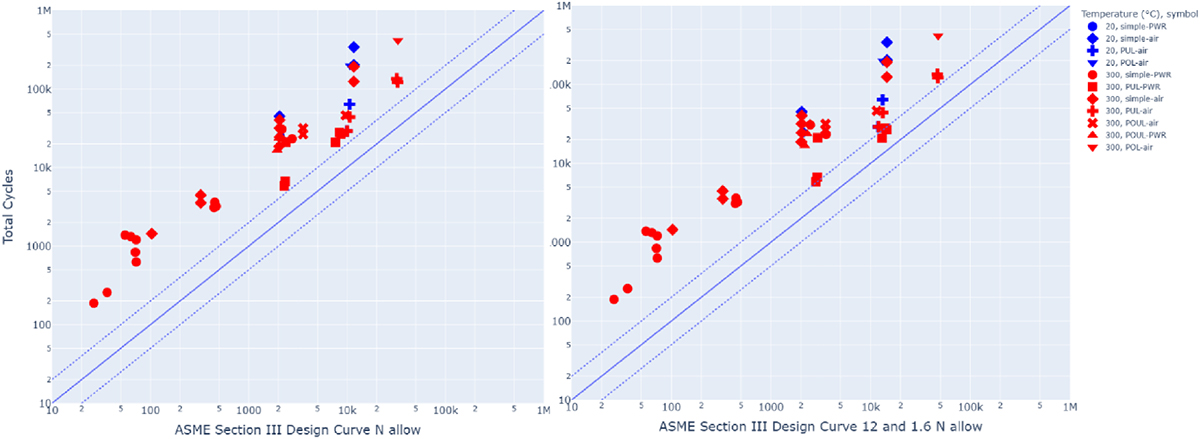
Left: variable Amplitude data analysed using ASME design fatigue curve with adjustment factors of 2 and 12. Right: data analysed using ASME design fatigue curve with adjustment factors of 1.6 and 12. The solid blue line is the identity line, the dotted lines are a factor of 0.5 and 2 and give a sense of margin between the data and identity line.
Current usage metrics show cumulative count of Article Views (full-text article views including HTML views, PDF and ePub downloads, according to the available data) and Abstracts Views on Vision4Press platform.
Data correspond to usage on the plateform after 2015. The current usage metrics is available 48-96 hours after online publication and is updated daily on week days.
Initial download of the metrics may take a while.