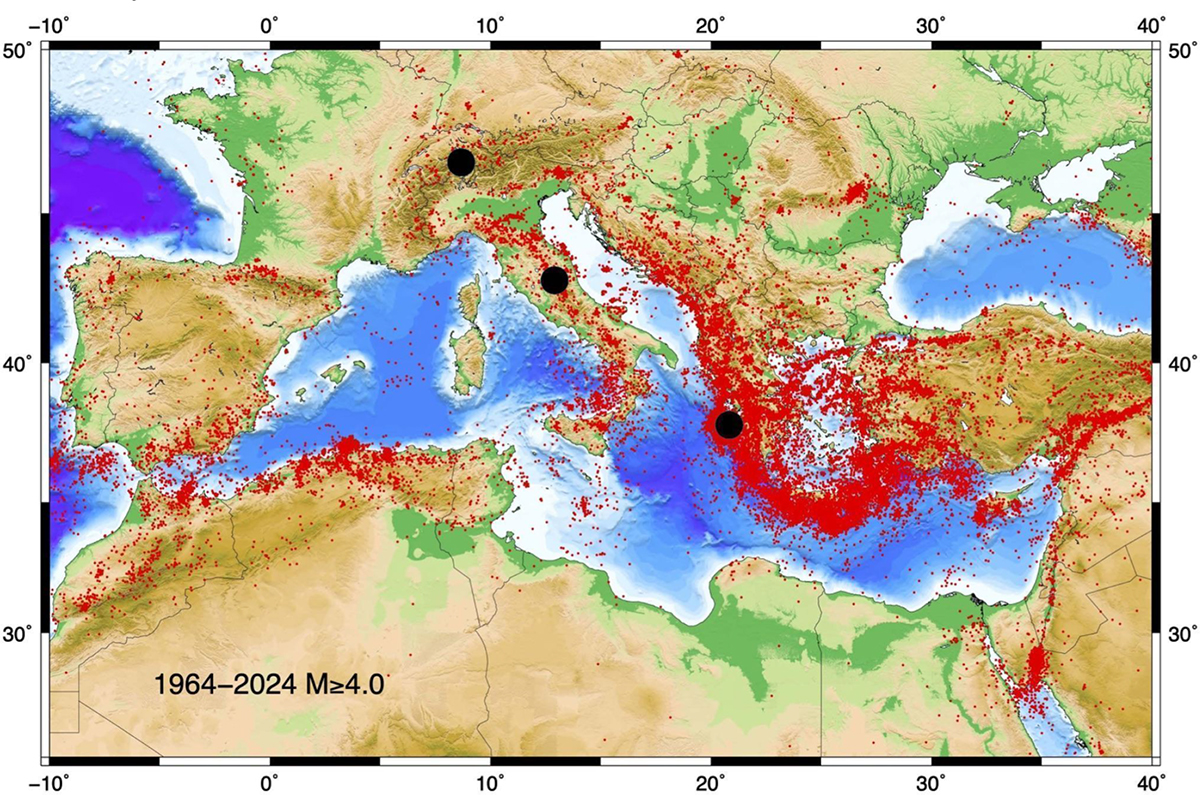
Fig. 1.
Download original image
Spatial distribution of a complete data sample with earthquakes of M ≥ 4.0 (red dots) during 1964–2024 (On-line Bulletin, last accessed on 04 September 2024, https://doi.org/10.31905/D808B830). Black dots indicate the ArtEmis pilot sites.
Current usage metrics show cumulative count of Article Views (full-text article views including HTML views, PDF and ePub downloads, according to the available data) and Abstracts Views on Vision4Press platform.
Data correspond to usage on the plateform after 2015. The current usage metrics is available 48-96 hours after online publication and is updated daily on week days.
Initial download of the metrics may take a while.