Fig. 9.
Download original image
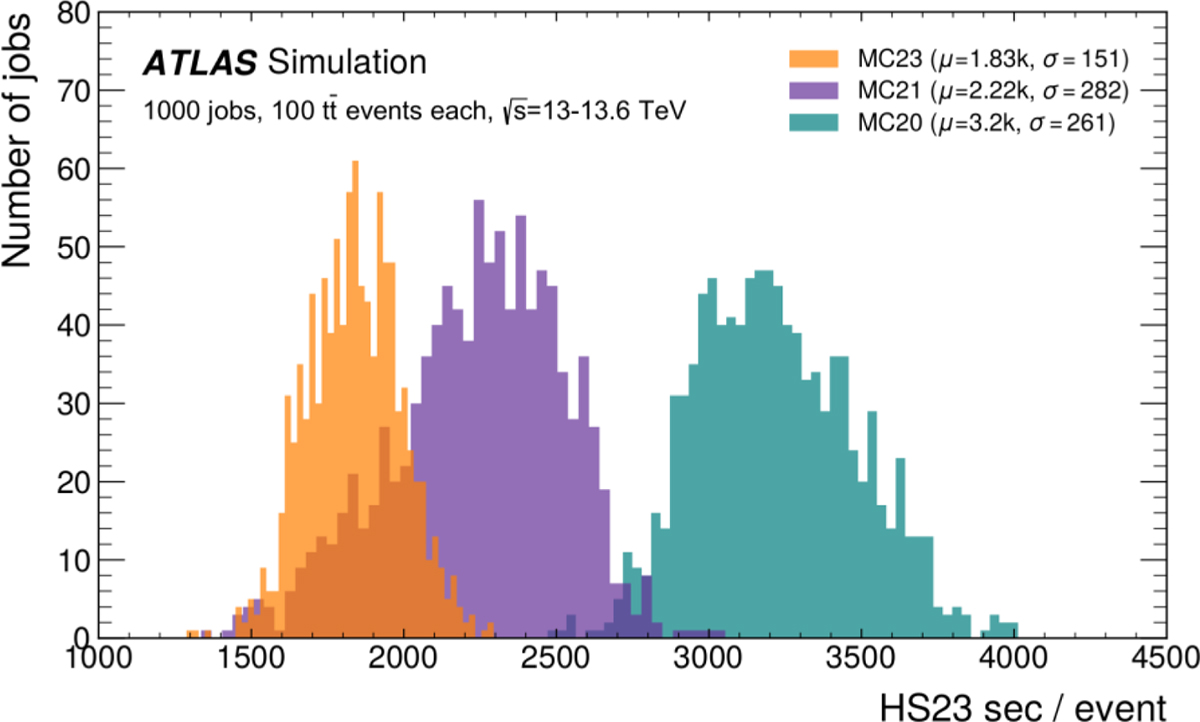
Illustration of the performance gains achieved by the ATLAS collaboration through an in-depth code analysis. The figure shows the processing time distributions with three ATLAS simulation software versions. This figure is extracted from reference [10]. The large speedups are discussed in the text.
Current usage metrics show cumulative count of Article Views (full-text article views including HTML views, PDF and ePub downloads, according to the available data) and Abstracts Views on Vision4Press platform.
Data correspond to usage on the plateform after 2015. The current usage metrics is available 48-96 hours after online publication and is updated daily on week days.
Initial download of the metrics may take a while.