Fig. 2.
Download original image
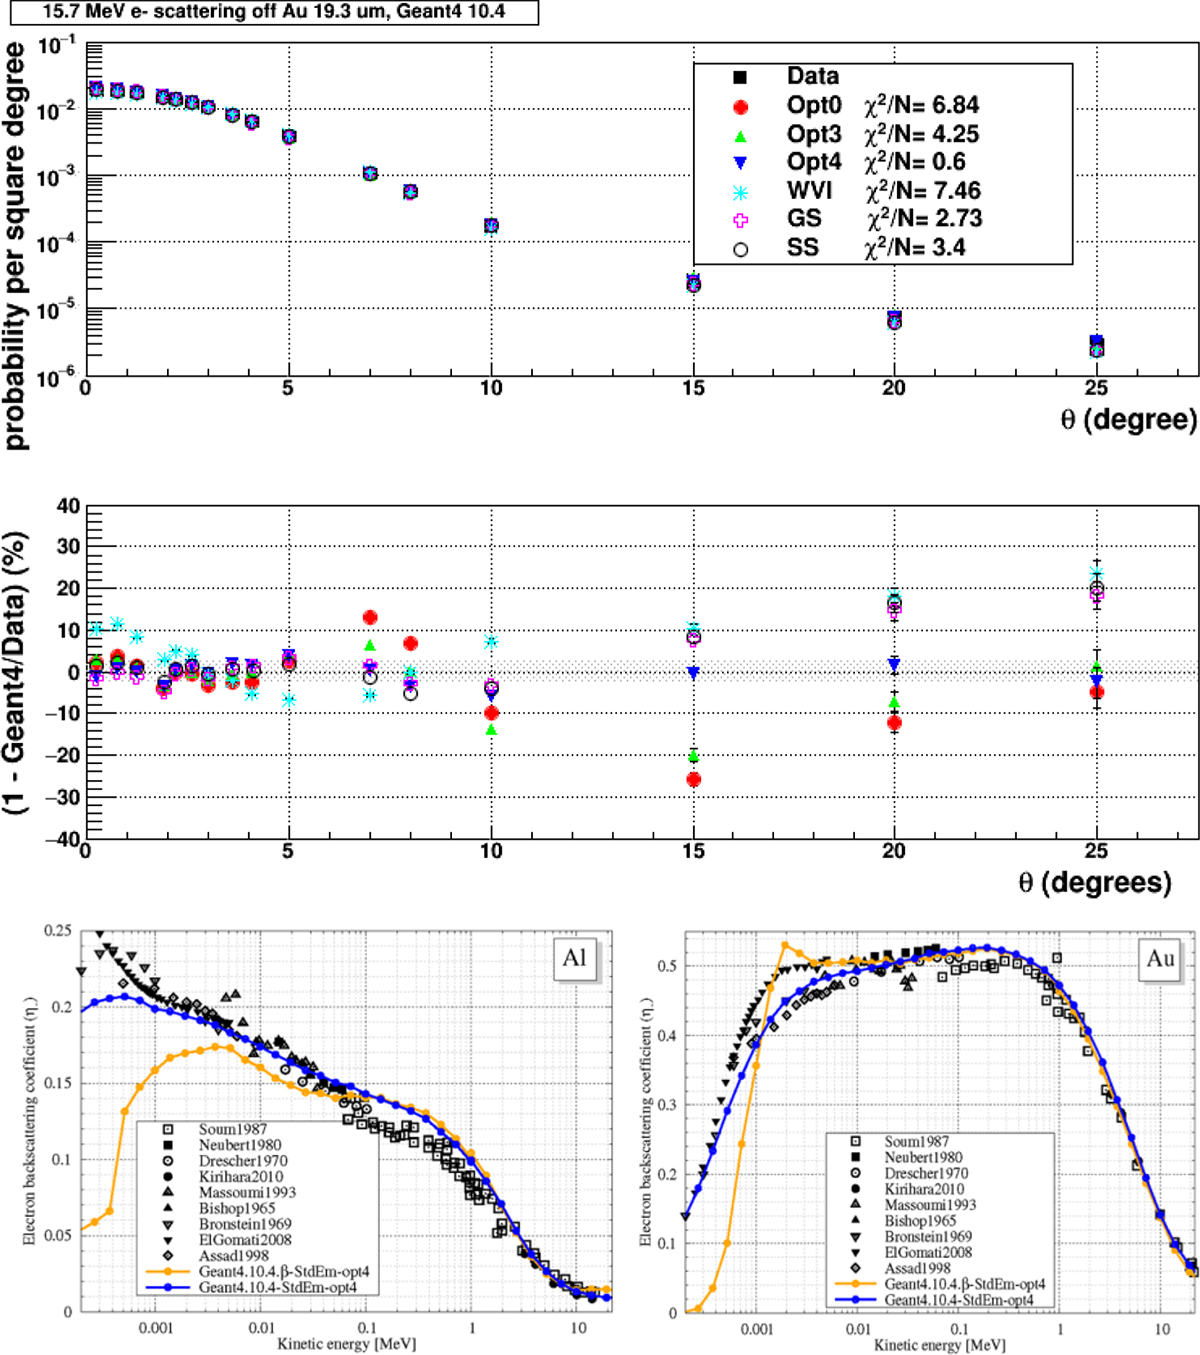
Figures from reference [26]. The new GS revised model including the Mott correction is indicated as “Opt4” on the two top angular plots (blue triangle). The GS model without this correction is indicated as “GS” (pink open cross marker). The bottom plots show the e− backscattering coefficient as function of energy on aluminum and gold targets. The yellow curve is obtained with the default “Urban” model, the blue one is for the new GS revised implementation.
Current usage metrics show cumulative count of Article Views (full-text article views including HTML views, PDF and ePub downloads, according to the available data) and Abstracts Views on Vision4Press platform.
Data correspond to usage on the plateform after 2015. The current usage metrics is available 48-96 hours after online publication and is updated daily on week days.
Initial download of the metrics may take a while.