Fig. 8.
Download original image
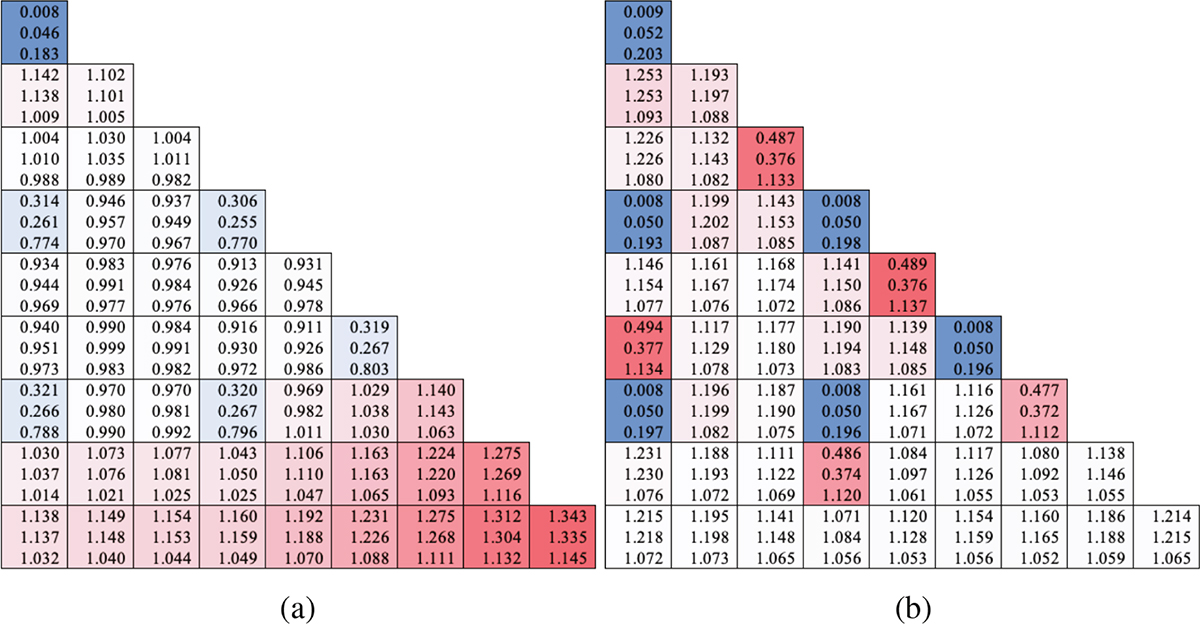
Comparison of the normalized energy release energy deposition, and gamma deposition for VERA2G, VERA2P. The color of each cell is determined by the amount of the gamma energy deposition. (a) 2G, (b) 2P.
Current usage metrics show cumulative count of Article Views (full-text article views including HTML views, PDF and ePub downloads, according to the available data) and Abstracts Views on Vision4Press platform.
Data correspond to usage on the plateform after 2015. The current usage metrics is available 48-96 hours after online publication and is updated daily on week days.
Initial download of the metrics may take a while.