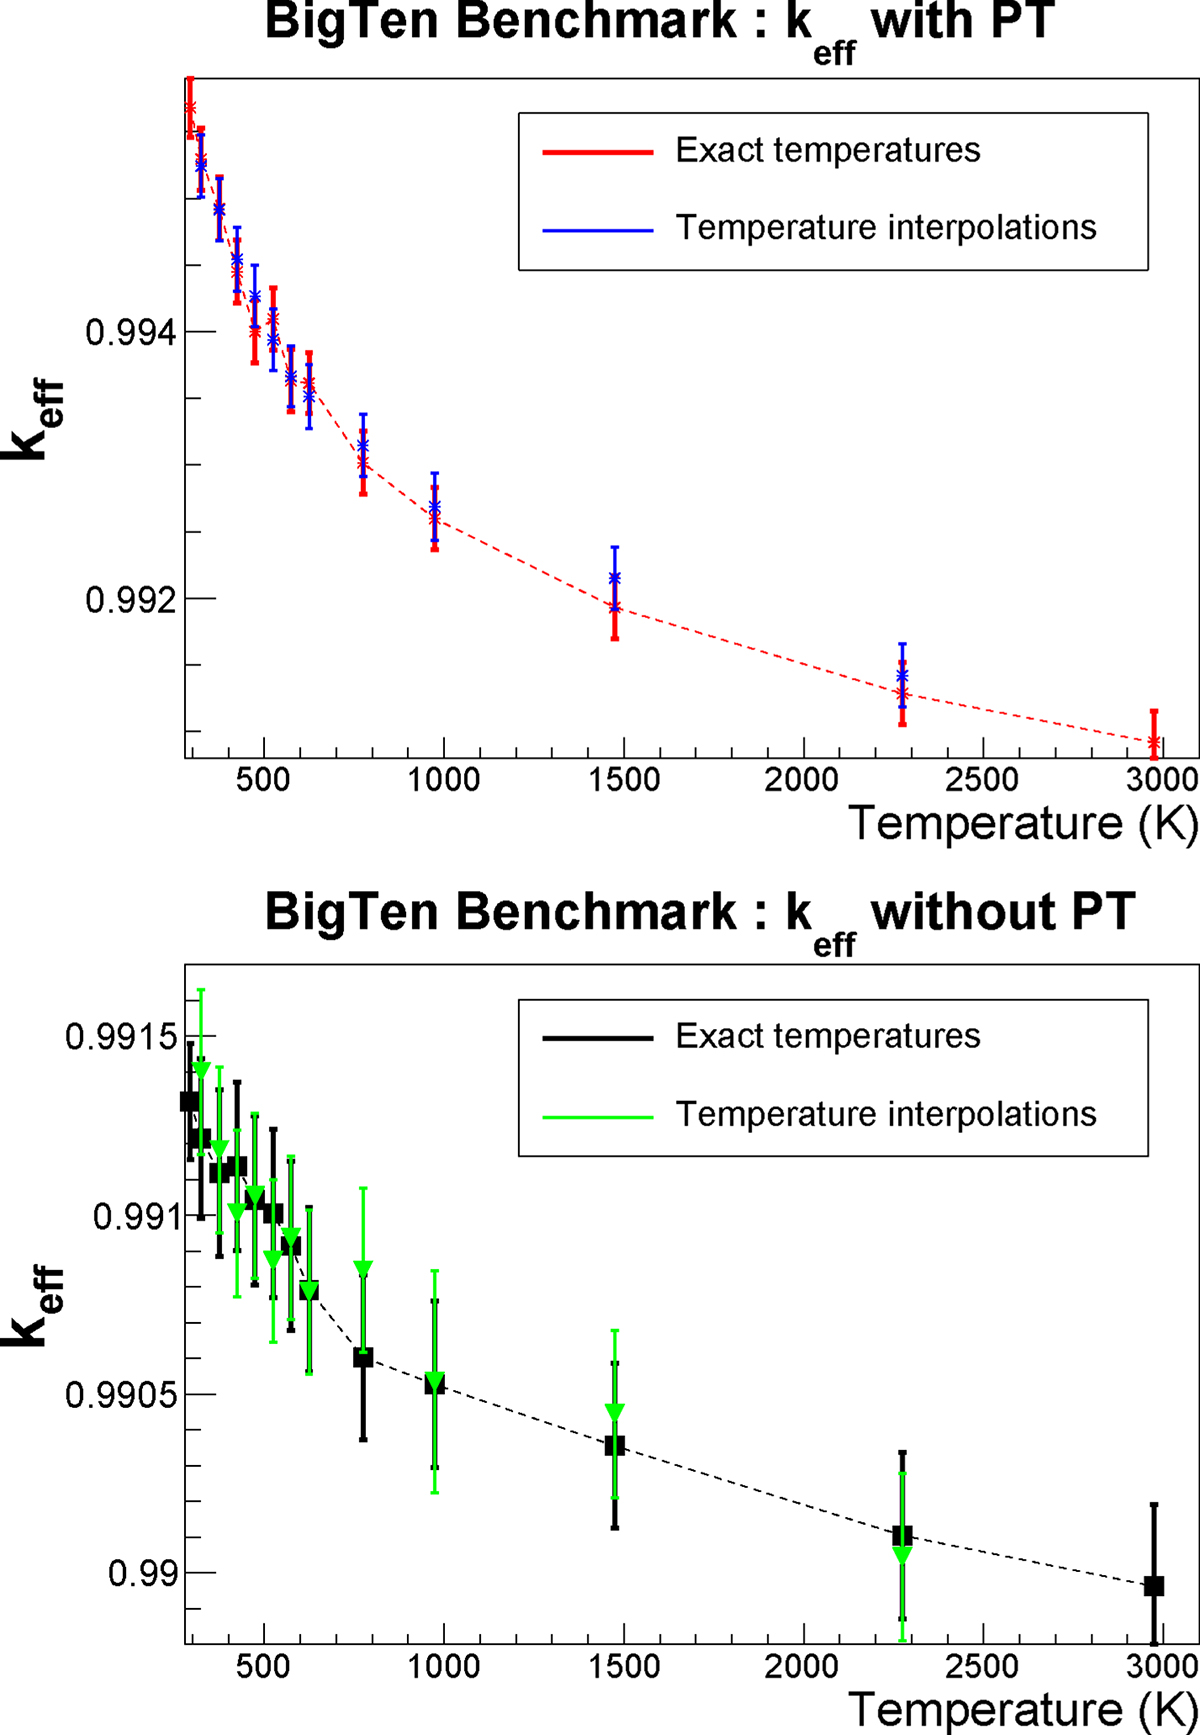
Fig. 8.
Download original image
Comparison of the multiplication factors k eff obtained for the BigTen benchmark configuration, using (linear) stochastic interpolation or exact cross sections at a given temperature. Top: with probability tables (PT); bottom: without probability tables (PT). Dashed lines are drawn through the results using exact cross-sections, to guide the eye. Figure adapted from reference [55] (SNA+MC, 2020).
Current usage metrics show cumulative count of Article Views (full-text article views including HTML views, PDF and ePub downloads, according to the available data) and Abstracts Views on Vision4Press platform.
Data correspond to usage on the plateform after 2015. The current usage metrics is available 48-96 hours after online publication and is updated daily on week days.
Initial download of the metrics may take a while.