Open Access
Fig. 2
Download original image
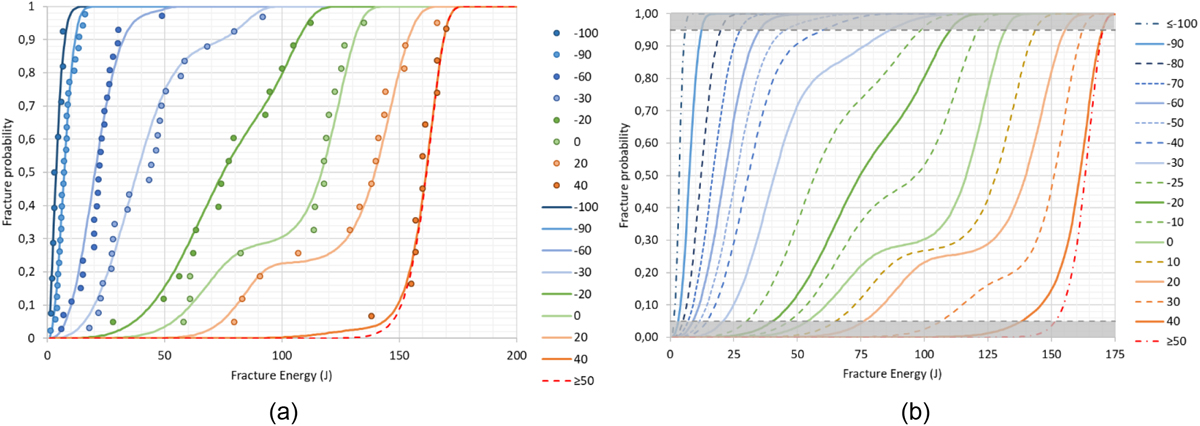
Data base from lower shelf (T < ‑100 °C) to upper shelf (T > 50 °C). (a) Fittings of equation (1) at different temperatures. (b) Data distributions for the modelling of uncertainties. The parts of these distributions below 5% and above 95% (grey zones) are not used in the modelling of uncertainties.
Current usage metrics show cumulative count of Article Views (full-text article views including HTML views, PDF and ePub downloads, according to the available data) and Abstracts Views on Vision4Press platform.
Data correspond to usage on the plateform after 2015. The current usage metrics is available 48-96 hours after online publication and is updated daily on week days.
Initial download of the metrics may take a while.