| Issue |
EPJ Nuclear Sci. Technol.
Volume 6, 2020
INSIDER
|
|
|---|---|---|
| Article Number | 16 | |
| Number of page(s) | 7 | |
| DOI | https://doi.org/10.1051/epjn/2020006 | |
| Published online | 30 March 2020 | |
https://doi.org/10.1051/epjn/2020006
Regular Article
Development of a user-friendly guideline for data analysis and sampling design strategy
1
Geovariances, 49bis avenue Franklin Roosevelt, 77210 Avon, France
2
SCK•CEN ǀ Belgian Nuclear Research Centre, Boeretang 200, 2400 Mol, Belgium
* e-mail: This email address is being protected from spambots. You need JavaScript enabled to view it.
Received:
23
October
2019
Received in final form:
20
January
2020
Accepted:
27
January
2020
Published online: 30 March 2020
Abstract
Within the H2020 INSIDER project, the main objective of work package 3 (WP3) is to draft a sampling guide for initial nuclear site characterization in constraint environments, before decommissioning, based on a statistical approach. The second task of WP3 aims at developing a strategy for sampling in the field of initial nuclear site characterization in view of decommissioning, with the most important goal to guide the end user to appropriate statistical methods (including, but not limited to those identified during the first overview task) to use for data analysis and sampling design. To aid the end user in applying this strategy, a user-friendly application for guiding the end user through the contents of the strategy and the initial characterization process is also developed.
© Y. Desnoyers and B. Rogiers, published by EDP Sciences, 2020
 This is an Open Access article distributed under the terms of the Creative Commons Attribution License (https://creativecommons.org/licenses/by/4.0), which permits unrestricted use, distribution, and reproduction in any medium, provided the original work is properly cited.
1 Introduction
The EURATOM work program project INSIDER was launched in June 2017 (18 partners from 10 European countries). It aims at improving the management of contaminated materials arising from decommissioning and dismantling (D&D) operations by proposing an integrated methodology of characterization. The methodology is based on advanced statistical processing and modelling, coupled with adapted and innovative analytical and measurement methods, in line with sustainability and economic objectives.
The overall objective of INSIDER is to develop and validate a new and improved integrated characterization methodology and strategy during the D&D process, based on three main use cases:
-
A nuclear R&D facility: radioactive liquid and sludge in tank at JRC Ispra (Italy)
-
A nuclear power plant: activated bio-shield concrete of the BR3 reactor (Belgium)
-
A post accidental site remediation: contaminated soils beneath a CEA building (France).
INSIDER's activities are divided into 7 Work Packages, each targeting a specific objective (Fig. 1).
The main objective of Work Package 3 (WP3) is to draft a sampling guide for initial nuclear site characterization in constraint environments before decommissioning, based on a statistical approach. This is done by selecting state-of-the-art techniques concerning sampling design optimization, using prior information and multiple iterations, testing the approach through different case studies and reviewing the feedback from overall uncertainty calculations. The process followed to meet the main WP3 objective consists of four steps:
-
Status: provide an overview of the available sampling design methods and state-of-the-art statistical techniques.
-
Development: develop a strategy/methodology that makes use of state-of-the-art techniques, and present it in a user-friendly software application.
-
Implementation: apply the methodology to the different test cases considered in order to test its adequacy.
-
Guidance: summarize all the findings in a comprehensive sampling strategy guide.
This paper aims to present and share the mid-term outputs of WP3, in particular for the second task dealing with the development of a user-friendly guideline for data analysis and sampling design strategy.
 |
Fig. 1 INSIDER work package distribution. |
2 Sampling strategy development
This second task of WP3 aims at developing a strategy for sampling in the field of initial nuclear site characterization in view of decommissioning, with the most important goal to guide the end user to appropriate statistical methods (including, but not limited to those identified during the first task [1]) to use for data analysis and sampling design. The first output of this second task is consequently a detailed report [2] that is summarised in the next sections.
2.1 Overall strategy
While the data analysis and sampling design methods that can be applied depend strongly on the situation and specific goals of initial nuclear site characterization, the overall strategy often takes the form of the generic workflow illustrated in Figure 2.
The starting point considered here is the request for initial nuclear site characterization to a radiological characterization team. Such a request can come from different kinds of actors, and can come with different amounts of detail. Following this request, a clear list of all objectives and identification of the constraints is absolutely required, and might ask for some iterations with the applicant to agree on the goals and priorities. The highest-priority objective should be tackled first in most cases, and the cycle along the different objectives is started.
All prior information that is available and relevant for the investigated case should be gathered as a first step. If some data would already be available, a first analysis to check if the objective is achieved is probably very useful, even if the results come with lots of uncertainty. In D&D, such prior information is nearly always available. Work is carried on historical installations and/or sites that have been shut down, or are going to be. Therefore, there is always a history of the exploitation phase, with available data, so this initial data-gathering step is of vital importance.
The data analysis following the data collection consists, in general, of the following steps: pre-processing, exploratory data analysis, the actual data analysis, and potentially a postprocessing step. If the objective is not achieved, a sampling design should be proposed using the most appropriate method(s) given all prior information and the data analysis result. Following the design, the corresponding characterization campaign should be performed. Additional characterization can reveal unexpected issues, and often revisiting the gathering of prior information is then useful. After the additional characterization, the updated dataset is again analysed, and the iterative procedure is continued until the objective is finally reached. The entire process can then be repeated to tackle the remaining objectives. Once all objectives have been achieved, the initial characterization study should be reported in a transparent way, making clear what has been measured, which results were obtained from the data analysis, and how large the corresponding uncertainty is.
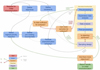 |
Fig. 2 Overall flowchart for sampling strategy and data analysis. |
2.2 Data analysis
For organizing the different data analysis techniques, the Venn diagram presented in Figure 3 is developed. The different categories are based on four aspects of the data, studied in the exploratory data analysis step:
-
the requirement for multivariate methods to account for correlations between variables,
-
the presence of spatial structure (non-randomness of spatial activity distribution),
-
the presence of spatial trends (to be prior modelled possibly),
-
and the requirement for robust methods (in case of small datasets).
The methods that are able to handle two, three or all aspects, are listed in the corresponding intersections. It is also possible none of these aspects apply, in which case the methods are presented outside of the diagram. More details on the individual methods are available in [2].
 |
Fig. 3 Data analysis Venn diagram. |
 |
Fig. 4 Sampling design Venn diagram. |
2.3 Sampling design
If the objective cannot be achieved with the available data, more information is required, and a proper sampling design should be made before collecting new data. There exists a variety of different ways to approach this, and the main drivers here are the available data, the type of problem at hand (revealed by the exploratory data analysis), the outcome of the data analysis, and the reason why the objective cannot be achieved. A similar Venn diagram organizes the selected sampling approaches according to their probabilistic or judgmental basis on the one hand, and an equal or unequal probability of selection on the other (Fig. 4). Note that the list of approaches provided here is non-limitative. Again, more details on the individual approaches are available in [2].
It should be noted here however, that in practice, sampling design consists most often of a combination of these approaches, as objectives and/or sampling targets often have multiple facets in real life.
2.4 Optimisation
Sampling strategy sometimes evolves into an iterative or adaptive approach. Based on a first sampling data set, it can be necessary to collect additional points in order to improve the initial estimation and/or to reduce related uncertainties. This sampling optimization is then strongly impacted by the characterization objective and can follow different rules.
-
Statistics: add random points to improve statistics.
-
Spatial clustering: add points around initial values that exceed a threshold (or any other criterion) to improve delineation.
-
General optimisation: find the best set (number and location) of additional points using computer algorithms (simulated annealing, genetic algorithm…) for a given objective function.
3 Implementation in a user-friendly interface
To aid the end user in applying this strategy, a user-friendly application [3] for guiding the end user through the contents of the strategy and the initial characterization process is available online at https://insider-h2020.sckcen.be/. It has the same objectives:
-
Define requirements for a statistical approach in the field of initial nuclear site characterisation in view of decommissioning combination of various non-destructive and destructive measurement results, sampling representability, multi variate analysis, overall associated uncertainties, accounting for prior knowledge.
-
Help the user to select and develop an optimal statistical approach to be used in constraint environments.
3.1 Used tools
This deliverable is developed using R [4] and RStudio [5] and the following contributed R packages:
-
R Markdown [6]
-
Allows writing in the simple markdown format (almost text files with specific header and easy formatting)
-
Outputs are classical html files + JavaScript for an interactive website
-
-
Flexdashboard [7]
-
Provides a specific output format for the rmarkdown package
-
Nice html + JavaScript dashboard for interactive apps
-
-
svgPanZoom [8]
-
Wrapper for svg-pan-zoom.js (https://github.com/ariutta/svg-pan-zoom)
-
Easily applied to SVGs from within R through the html widgets framework (https://www.htmlwidgets.org/)
-
-
pacman [9] and here [10] for more automated and reproducible setup.
3.2 Source files
The file structure is presented in Figure 5. Input files (*.Rmd) and output files (*.html) are at the same level (both in the main project folder and the “rmds” subfolder). Other JavaScript libraries, widgets and figures are located in additional dedicated subfolders.
An example of source file (*.rmd) is presented in Figure 6.
 |
Fig. 5 File structure of the web-based interface. |
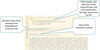 |
Fig. 6 Main *.Rmd file. |
3.3 Overview of the resulting website
The work consisted of the following actions:
-
Convert text and tables of previous WP3 report [2] into R Markdown files
-
Add links and targets to the different elements on the flow charts and Venn diagrams
-
Knit/Render/Compile the *.Rmd files to get *.html output
-
Possibly tweak some things in the resulting html files to get the desired behaviour (in particular additional JavaScript).
Example snapshots are presented in Figures 7 and 8.
 |
Fig. 7 General view of the user-friendly interface to the strategy for data analysis and sampling design. |
 |
Fig. 8 Example of a detailed page for data analysis (Wilks method), with the overview of methods in the Venn diagram. |
4 Conclusions and ongoing work
In WP3 of the H2020 INSIDER project, the second task outlined a generic strategy for handling problem definition, data analysis and sampling design in the field of initial nuclear site characterization. Additionally, an overview of commonly used data analysis and sampling design methods, applicable in this field has been provided. This work served as a blueprint for the web-based application presenting the strategy in a more user-friendly way.
Furthermore, this approach is currently and thoroughly tested in practice within different use cases:
-
Use case 1: decommissioning of a back/end fuel cycle and/or research facility: radioactive liquid and sludge in tank at JRC Ispra (Italy).
-
Use case 2: decommissioning of a nuclear reactor: activated bio-shield concrete of the BR3 reactor (Belgium).
-
Use case 3: post accidental land remediation: contaminated soils beneath a CEA building (France).
The return-of-experience will allow refining the overall methodology for the final guideline developed within INSIDER WP3, describing the statistical approach and taking the uncertainty budget into consideration, potentially allowing further refinement of the web-based application in the final stage.
The INSIDER project received funding from the Euratom Research and Training Programme 2014-2018 under grant agreement No 755554.
Author contribution statement
The task leader within the INSIDER project is Bart Rodgiers. In particular, he worked on the global architecture of the interface and on the workflow diagrams. Yvon Desnoyers was mainly involved in the production of the different interface pages as well as the final compilation with javascript encapsulation.
References
- N. Pérot, Y. Desnoyers, G. Augé, F. Aspe, S. Boden, B. Rogiers, O. Sevbo, O. Nitsche, INSIDER WP3-Sampling strategy − Report on the state of the art, Deliverable 3.1, 2017 [Google Scholar]
- B. Rogiers, S. Boden, N. Perot, Y. Desnoyers, O. Sevbo, O. Nitzsche, INSIDER WP3–Sampling strategy − Report on statistical approach, Deliverable D3.2, 2018 [Google Scholar]
- Y. Desnoyers, B. Rogiers, INSIDER WP3–Sampling strategy − Software of statistical approach, Deliverable D3.3, 2018 [Google Scholar]
- R Core Team, R: A language and environment for statistical computing. R Foundation for Statistical Computing, Vienna, Austria, 2019, available at https://www.R-project.org/ [Google Scholar]
- RStudio Team, RStudio: Integrated Development for R. RStudio, Inc., Boston, MA, 2018, available at http://www.rstudio.com/ [Google Scholar]
- Y. Xie, J.J. Allaire, G. Grolemund, R Markdown: The Definitive Guide (Chapman and Hall/CRC, New York, 2018) [CrossRef] [Google Scholar]
- R. Iannone, J.J. Allaire, B. Borges, flexdashboard: R Markdown Format for Flexible Dashboards. R package version 0.5.1.1, 2018, available at https://CRAN.R-project.org/package=flexdashboard [Google Scholar]
- A. Riutta, J. Tangelder, K. Russell, svgPanZoom: R ‘Htmlwidget’ to Add Pan and Zoom to Almost any R Graphic. R package version 0.3.3, 2016, available at https://CRAN.R-project.org/package=svgPanZoom [Google Scholar]
- T.W. Rinker, D. Kurkiewicz, pacman: Package Management for R. version 0.5.0. Buffalo, New York, 2017, available at http://github.com/trinker/pacman [Google Scholar]
- K. Müller, here: A Simpler Way to Find Your Files. R package version 0.1, 2017, available at https://CRAN.R-project.org/package=here [Google Scholar]
Cite this article as: Yvon Desnoyers, Bart Rogiers, Development of a user-friendly guideline for data analysis and sampling design strategy, EPJ Nuclear Sci. Technol. 6, 16 (2020)
All Figures
|
Fig. 1 INSIDER work package distribution. |
| In the text | |
|
Fig. 2 Overall flowchart for sampling strategy and data analysis. |
| In the text | |
|
Fig. 3 Data analysis Venn diagram. |
| In the text | |
|
Fig. 4 Sampling design Venn diagram. |
| In the text | |
|
Fig. 5 File structure of the web-based interface. |
| In the text | |
|
Fig. 6 Main *.Rmd file. |
| In the text | |
|
Fig. 7 General view of the user-friendly interface to the strategy for data analysis and sampling design. |
| In the text | |
|
Fig. 8 Example of a detailed page for data analysis (Wilks method), with the overview of methods in the Venn diagram. |
| In the text | |
Current usage metrics show cumulative count of Article Views (full-text article views including HTML views, PDF and ePub downloads, according to the available data) and Abstracts Views on Vision4Press platform.
Data correspond to usage on the plateform after 2015. The current usage metrics is available 48-96 hours after online publication and is updated daily on week days.
Initial download of the metrics may take a while.