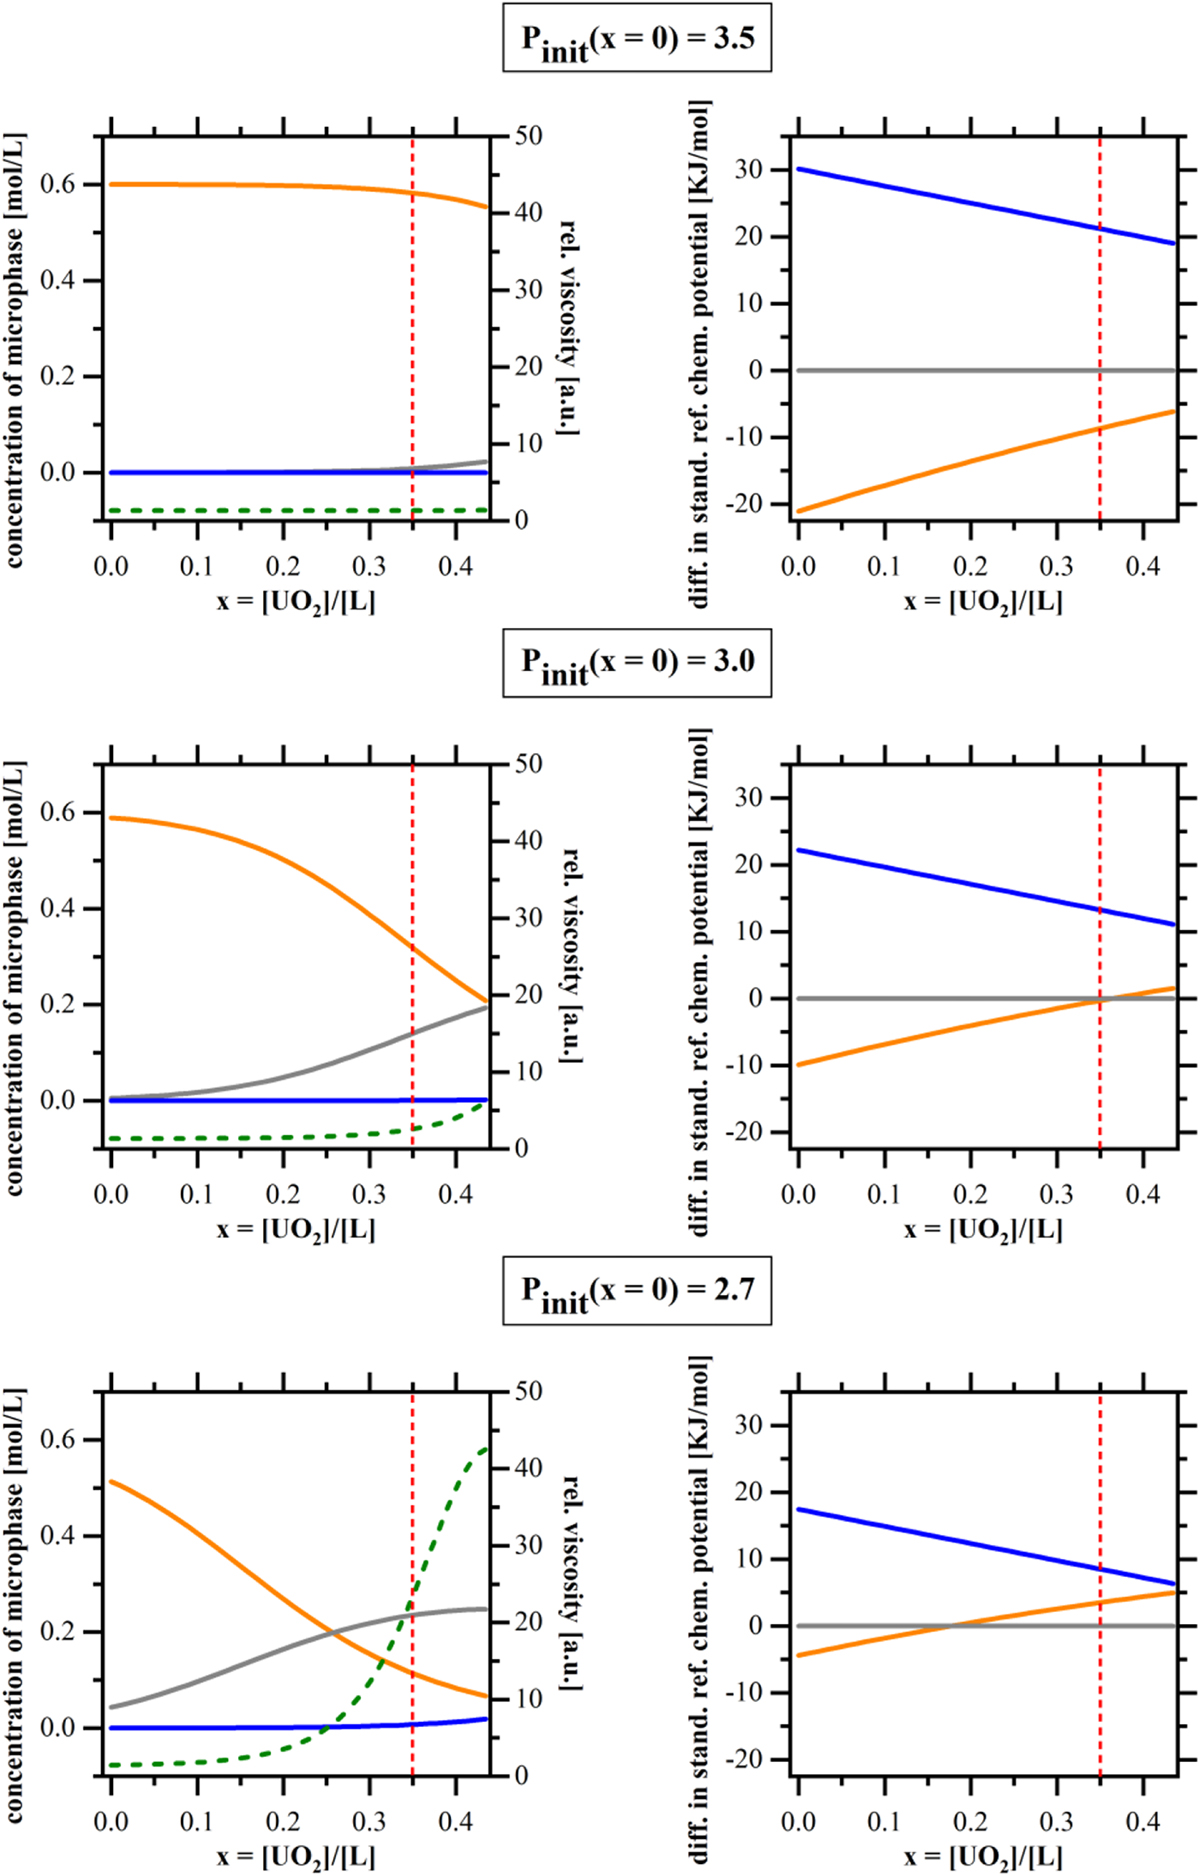
Fig. 14

Download original image
Calculated microphase distribution of endcaps (orange), cylinders (grey) and junctions (blue) as well as the corresponding differences in standard reference chemical potential respective to cylinders dependent on the initial spontaneous packing parameter P init and the uranyl content x. The calculated relative viscosity curve is shown in as dashed green line. The relative decrease of the initial spontaneous packing parameter from x = 0 to x = 0.45 was set to ΔP 0 = 0.7. The total extraction concentration was chosen to be 1.2 M and the bending constant κ* = 2 kT/extractant. The position of the Monte-Carlo-like simulation shown in Figure 15 is indicated by a red dashed line.
Current usage metrics show cumulative count of Article Views (full-text article views including HTML views, PDF and ePub downloads, according to the available data) and Abstracts Views on Vision4Press platform.
Data correspond to usage on the plateform after 2015. The current usage metrics is available 48-96 hours after online publication and is updated daily on week days.
Initial download of the metrics may take a while.


