Fig. 3

Download original image
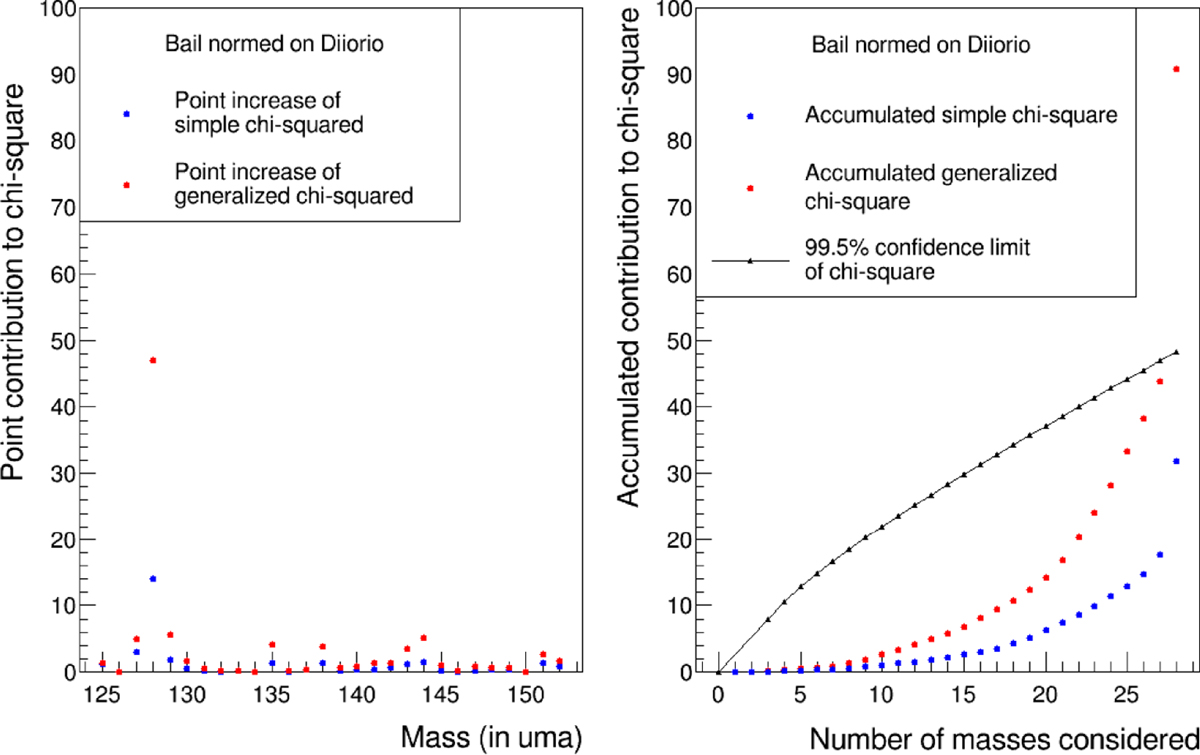
Contribution to the χ2 and ![]() values for the Bail measurements compared to the Diiorio data. (left) The mass 128 corresponds to the largest contribution to the χ2 or
values for the Bail measurements compared to the Diiorio data. (left) The mass 128 corresponds to the largest contribution to the χ2 or ![]() . For this plot, blue dots present simple χ2 calculations and red dots correspond to generalized
. For this plot, blue dots present simple χ2 calculations and red dots correspond to generalized ![]() calculations. (right) Cumulative contributions of χ2 and
calculations. (right) Cumulative contributions of χ2 and ![]() as a function of the number of masses considered. Only one mass induced a cumulative
as a function of the number of masses considered. Only one mass induced a cumulative ![]() value (red points) larger than the
value (red points) larger than the ![]() limit for 99.5% confidence level (black dots). It is clear that the second calculations (
limit for 99.5% confidence level (black dots). It is clear that the second calculations (![]() ) are expressly needed for a relevant mass test.
) are expressly needed for a relevant mass test.
Current usage metrics show cumulative count of Article Views (full-text article views including HTML views, PDF and ePub downloads, according to the available data) and Abstracts Views on Vision4Press platform.
Data correspond to usage on the plateform after 2015. The current usage metrics is available 48-96 hours after online publication and is updated daily on week days.
Initial download of the metrics may take a while.


