Fig. 6

Download original image
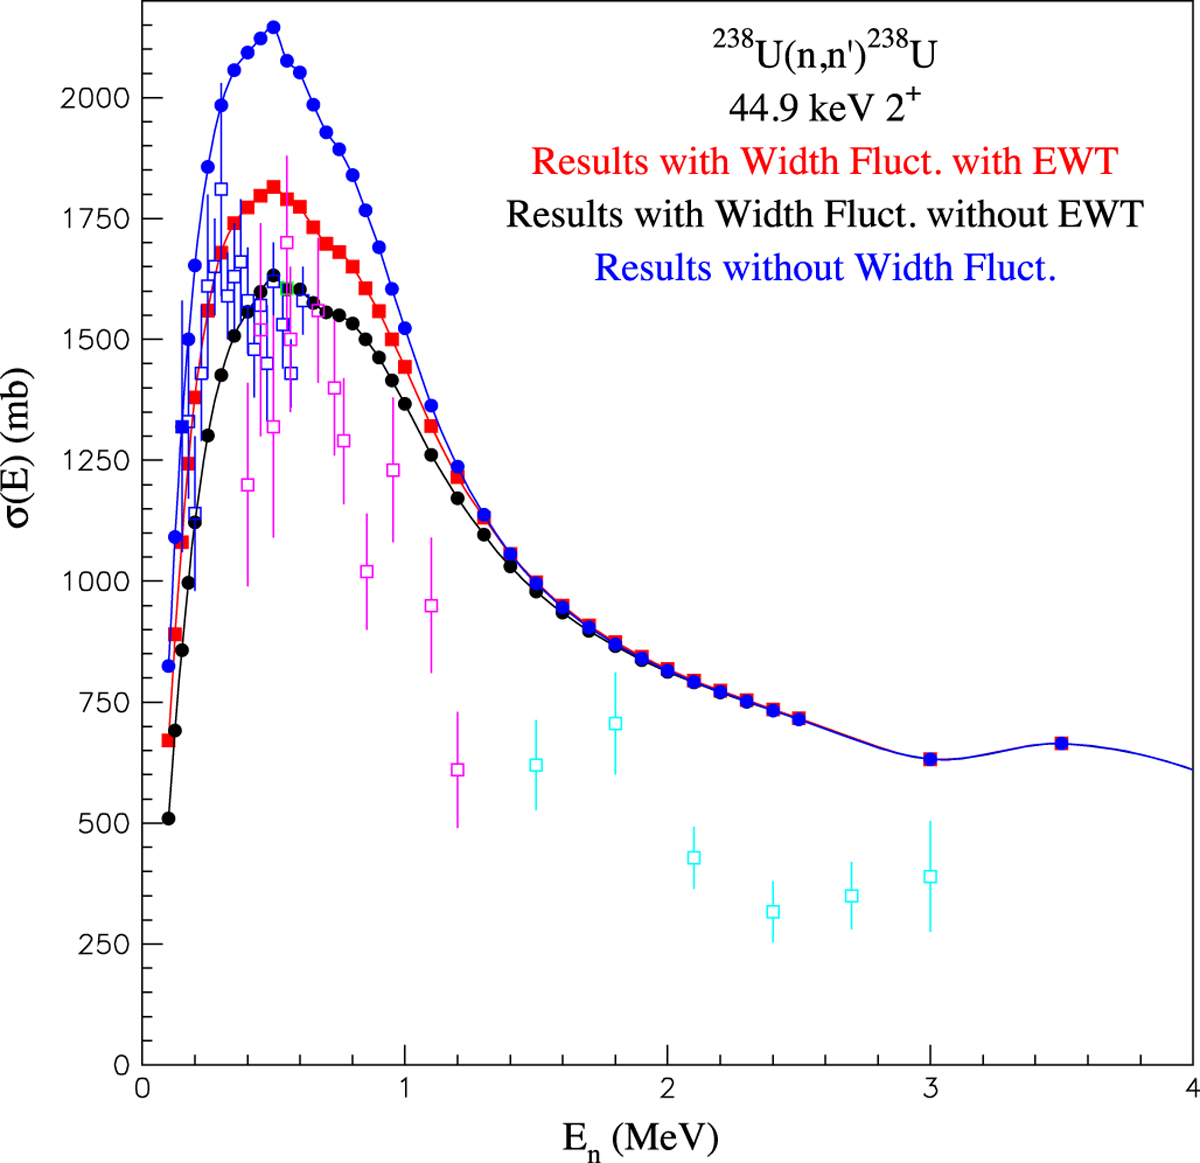
Inelastic cross-section off the first 2+ level of 238U as function of the excitation energy En. The red (resp. black) line shows the theoretical prediction obtained using (resp ignoring) the EWT with the Soukhovitski![]() optical model potential [26]. The blue line shows the predictions obtained ignoring width fluctuation corrections. Experimental data are taken from the EXFOR database [29].
optical model potential [26]. The blue line shows the predictions obtained ignoring width fluctuation corrections. Experimental data are taken from the EXFOR database [29].
Current usage metrics show cumulative count of Article Views (full-text article views including HTML views, PDF and ePub downloads, according to the available data) and Abstracts Views on Vision4Press platform.
Data correspond to usage on the plateform after 2015. The current usage metrics is available 48-96 hours after online publication and is updated daily on week days.
Initial download of the metrics may take a while.


