Fig. 4
Download original image
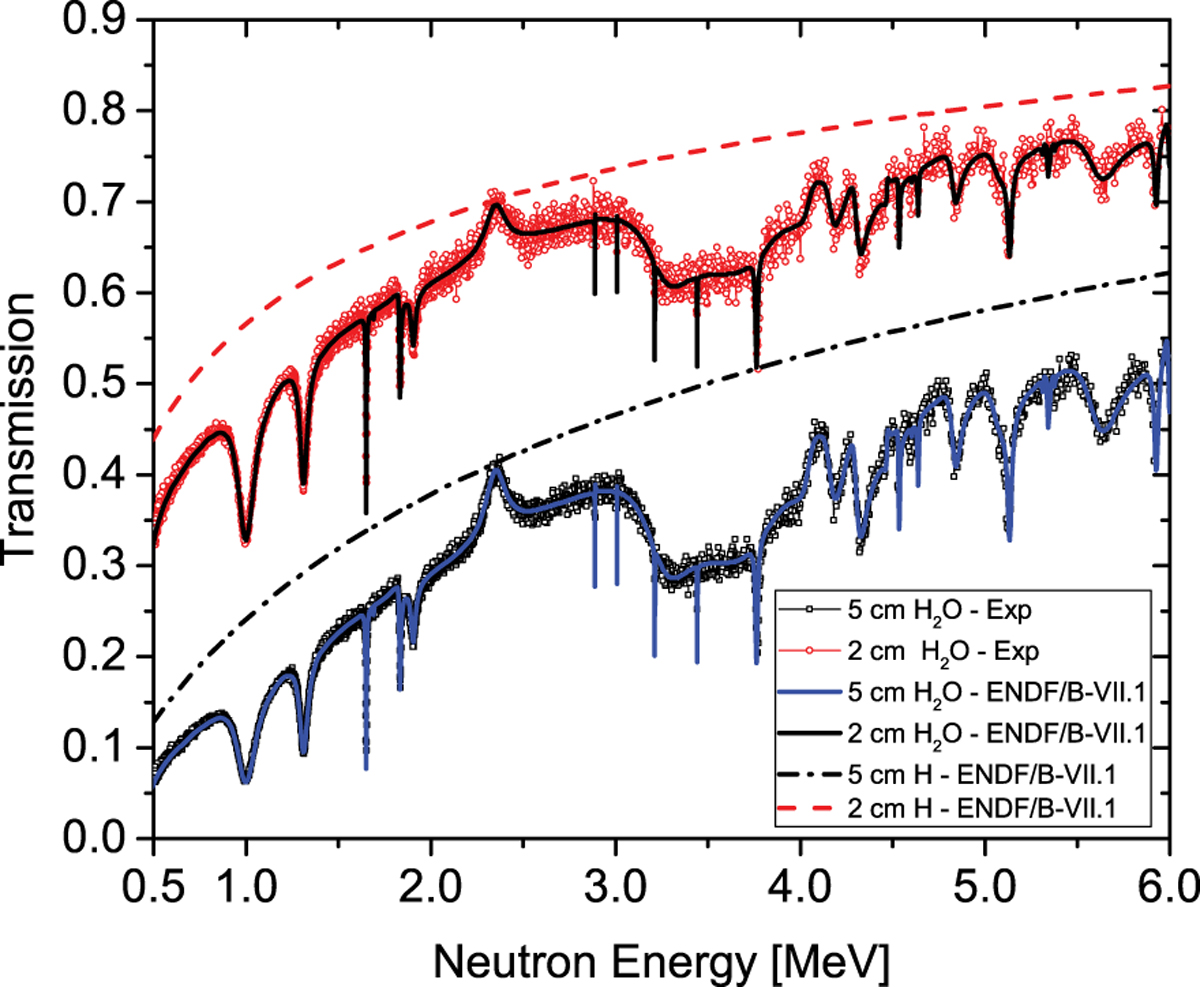
Measured transmission for two thicknesses of water samples are shown. Also plotted are calculations using the ENDF/B-VII.1 [8] cross sections for H2O and for only H in the sample. The agreement of the H2 transmission serves as verification of the normalization.
Current usage metrics show cumulative count of Article Views (full-text article views including HTML views, PDF and ePub downloads, according to the available data) and Abstracts Views on Vision4Press platform.
Data correspond to usage on the plateform after 2015. The current usage metrics is available 48-96 hours after online publication and is updated daily on week days.
Initial download of the metrics may take a while.