| Issue |
EPJ Nuclear Sci. Technol.
Volume 3, 2017
|
|
|---|---|---|
| Article Number | 3 | |
| Number of page(s) | 5 | |
| DOI | https://doi.org/10.1051/epjn/2016040 | |
| Published online | 30 January 2017 | |
https://doi.org/10.1051/epjn/2016040
Regular Article
Positron annihilation spectroscopy study of lattice defects in non-irradiated doped and un-doped fuels
Nuclear Energy and Safety Department, Paul Scherrer Institut,
5232
Villigen PSI, Switzerland
⁎ e-mail: This email address is being protected from spambots. You need JavaScript enabled to view it.
Received:
23
September
2015
Received in final form:
17
June
2016
Accepted:
5
December
2016
Published online: 30 January 2017
Abstract
Fission gas behavior within the fuel structure plays a major role for the safety of nuclear fuels during operation in the nuclear power plant. Fission gas distribution and retention is determined by both, micro- and lattice-structure of the fuel matrix. The ADOPT (Advanced Doped Pellet Technology) fuel, containing chromium and aluminum additives, shows larger grain sizes than standard (undoped) UO2 fuel, enhancing the fission gas retention properties of the matrix. However, the additions of such trivalent cations shall also induce defects in the lattice. In this study, we investigated the microstructure of such doped fuels as well as a reference standard UO2 by positron annihilation spectroscopy (PAS). Although this technique is particularly sensitive to lattice point defects in materials, a wider application in the UO2 research is still missing. The PAS-lifetime components were measured in the hotlab facility of PSI using a 22Na source sandwiched between two 500-μm-thin sample discs. The values of lifetime at the center and the rim of both samples, examined to check at the radial homogeneity of the pellets, are not significantly different. The mean lifetimes were found to be longer in the ADOPT material, 220 ps, than in standard UO2, 190 ps, which indicates a larger presence of additional defects, presumably generated by the dopants. While two-component decomposition (bulk + one defect component) could be performed for the standard material, only one lifetime component was found in the doped material. The absence of the bulk component in the ADOPT sample refers to a saturated positron trapping (i.e., all positrons are trapped at defects). In order to associate a type of lattice defect to each PAS component, interpretation of the PAS experimental observations was conducted with respect to existing experimental and modeling studies. This work has shown the efficiency of PAS to detect lattice point defects in UO2 produced by Cr and Al oxides. These additives create lattice irregularities, which are acting as sinks for fission products on one hand and trapping positrons on the other hand. Fitting of the obtained experimental data with a suitable theoretical model can provide a valuable qualitative assessment of these defects. At this stage of the research, some of the existing models were used for this purpose.
© M. Chollet et al., published by EDP Sciences, 2017
 This is an Open Access article distributed under the terms of the Creative Commons Attribution License (http://creativecommons.org/licenses/by/4.0), which permits unrestricted use, distribution, and reproduction in any medium, provided the original work is properly cited.
1 Introduction
It is well established that the addition of chosen dopants in UO2 fuel, the most popular being Cr2O3, enlarges grain sizes contributing to a better fission gas retention and improves pellet-cladding interaction behavior [1]. While the oxidation state of Cr has been recently assessed to be +3 only [2], the mechanism of accommodation of such cation in the face centered cubic (f.c.c.) structure of the UO2 is still not entirely understood: is Cr accommodated in substitution? Of oxygen? Uranium? In interstitials? In vacancies or clusters of vacancies already present in the lattice? Whatever the mechanism, dopants are likely to induce point defects. In this study, we have investigated the occurrence of such lattice defects by positron annihilation spectroscopy (PAS).
PAS is a powerful technique to probe defects and has already widely been used for nuclear structural materials [3,4]. However, the number of published works on UO2 is small. Even less papers have addressed the issue of radiation effects [5–9] and there is only one study on doped-material by PAS where dopants were actinides [10]. The present study focuses for the first time on PAS characterization of UO2 fuel with a microstructure modified by dopants.
2 Experimental
The doped UO2 ADOPT (Advanced Doped Pellet Technology) and conventional UO2 Standard Optima2 (Std Opt2) fuels manufactured under similar conditions by Westinghouse (Västeras, Sweden) have been investigated in this study. Details of the fabrication process are given in Arborelius et al. [11]. Both initial powders were pressed into green pellets with a force of 50 kN and then sintered in a H2/CO2 gas mixture at 1800 °C during 14 h. Additives of Cr and Al are limited to 1000 ppm in the ADOPT material. The pellet densities are respectively 10.67 and 10.60 g/cm3, corresponding to 97.3% and 96.7% of the theoretical values, showing the effect of additives.
For both materials, two thin slices of the pellets of 8.36 cm in diameter were cut and one face polished to obtain discs of 500 μm thickness.
We used the decay of 22Na generating positrons as a source, described as following: 22Na → 22Ne + β+ + νe + γ. This source of 3.7 MBq, obtained from an evaporated drop of aqueous solution containing 22Na salt, has an effective diameter of 2 mm and is embedded between Kapton foils. Thanks to the small size of the source relative to the pellet slices, two separate measurements could be performed, i.e., in the center and at the rim of the pellets to investigate the radial homogeneity. The source is sandwiched between the two pieces of each sample and detectors are placed at each side of the set-up (Fig. 1).
The positron lifetime measurements were performed using a conventional two-detector spectrometer with a resolution of 195 ps. Contribution of positrons annihilating within the source was determined by calibration measurements to have 20% intensity and 390 ps lifetime. A typical lifetime spectrum, as obtained for the both UO2 materials, calibration Fe sample and calibration 60Co source, can be seen in Figure 2. A minor uncertainty could be introduced by not considering the effect of backscattered positrons in the calibration Fe sample. This uncertainty was considered negligible due to using of “fast” unmoderated positrons from radioisotope source.
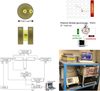 |
Fig. 1 Schematic drawings of the experimental setup (top and bottom left) and picture of the positron lifetime spectrometer facility (right). In this case, the spectrometer was used in 2-detector mode [3]. |
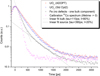 |
Fig. 2 Positron lifetime spectrum of the two investigated UO2 materials, defect-free Fe sample and calibration 60Co source. |
3 Results
Analytical data processing was performed using the LT 9.0 program [12] and two-component decomposition of the spectra (bulk + defect component) according to the standard trapping model [13]. The lifetime spectra were fitted with a variance of fit (FV) ranging better than 1.06 (Tab. 1). In the case of the ADOPT sample, the bulk component could not be identified, which means that the positron trapping at defects reached its saturation (i.e., all positrons trapped). All experimental data are listed in Table 1. Two different values (250 and 300 ps) fixed for the defect component have been selected based on the previously published studies [9,10] to examine scenarios with different types of defects.
Mean lifetimes are homogeneous at the center and the rim of the pellet at 190 and 220 ps for both materials ADOPT and Std Opt2, respectively. It means that the microstructure along the pellet radius is not affected by the production process from a point defect perspective. Both pellets are radially isotropic. Mean lifetimes were found to be higher in the ADOPT material than in Std Opt2, indicating a higher number of point defects in the doped material. This is very likely due to the incorporation of trivalent cations (Cr3+) in the structure.
As mentioned above, the spectra have been decomposed into two lifetimes τ1 and τ2. Two lifetime components are generally reported for UO2 [5,9,10]. Such decomposition enables to calculate the lattice lifetime τbulk. For the Std Opt2 sample, τbulk = 180 ps was obtained. The first measured component τ1 of the Std Opt2 sample is by 10 ps slightly lower than τbulk, which is in agreement with the standard trapping model. This component could correspond either to a reassessment of a defect-free bulk or a mix of bulk and some shallow defects. In addition to this component, 15–33% of the positrons are trapped in defects with a lifetime of 250–300 ps. The nature of this trapping site will be discussed in the next section. Larger defect structures as clusters with higher lifetimes (e.g., porosity) are not observed in either of the samples.
In the ADOPT fuel, positrons are trapped at defects (saturated positron trapping). Table 1 shows also some proposed fits with a fixed τ2 value at 250 or 300 ps. As can be seen, these fits result in a significantly reduced intensity of this component (as compared to the Std Opt2 sample) and suggest that such defects, are present in lower concentration than in the reference material or, if existent, are less attractive to positrons (so called shallow traps).
Mean lifetimes τ, first and second components τ1 and τ2 and their associated intensity Ii. Italic values of τ2 indicate fixed parameters during the decomposition. Reduced chi-squares F.V. are given for each fit. Bulk lifetimes were calculated from the experimentally measured data according to the standard trapping model [13].
4 Discussion − interpretation of the PAS components
The PAS signals of the standard and doped material are material-specific and indicate different microstructures. The few PAS-studies on UO2 material are too limited to establish a straightforward identification of the nature of the positron-trapping sites. In this section, we compare and discuss the results in the perspective of the previous experimental and modelling studies [5,7,9,10]. It is worth noting that these three available valuable studies stem from the same research group (CEA/CNRS, France). In particular, Wiktor et al. [9] have performed DFT + U calculations to obtain the positron lifetimes of uranium and oxygen vacancies in UO2 as well as combination of vacancies (Shottky defect, etc.). They did not consider interstitial defects in their calculations.
The value of the lattice τbulk of 180 ps compares well with the previous experimental values of 170–180 ps in Roudil et al. [10] and 169 ps in Barthe et al. [5]. It is possible that our value is slightly enhanced by a polishing effect or other intrinsic defects as no annealing was performed prior to measurements. Roudil et al. noticed a reduction of the bulk component from 180 to 170 ps for increasing annealing temperature, showing hence the recovering and removal of the bulk defects in the materials.
As already evoked, the τ1 at 170 ps component in the standard material is probably a mix of the bulk component lowered by oxygen interstitial which is the most stable interstitial defect in the structure.
The τ2 component is higher than the mean value τ, indicating positron trapping at vacancy-type defects (e.g., [9]). Several interpretations are possible for this component, but there is a consensus in the experimental studies [5,10] to attribute the annihilation time between 250 and 300 ps to a displacement of U atoms (U-vacancies). The test-fits for the PAS signal with these imposed and fixed values at 250 and 300 ps as τ2 component give good results given the FV values (Tab. 1). However, the formation energy of a uranium vacancy is almost twice that of oxygen [14], and in the literature this kind of point defect was generally detected in irradiated/damaged UO2 [5,10]. In our fresh non-irradiated sample, the mechanism of creation of such defects could again be polishing, as already proposed by Evans et al. [7]. On the other hand, this 2nd lifetime component τ2 is only observed in the standard sample, whereas both standard and doped samples have been polished; thus it should have also been detectable in the doped sample. Other mechanisms of formation are likely (e.g., intergranular misfits). Nevertheless, one can notice that fits including a fixed τ2 at 250 or 300 ps for the doped fuel data yield better or comparable variance of fit FV than those without τ2 (Tab. 1), so that the possibility of the occurrence of such U-vacancies should not be excluded in the doped material either. Other types of vacancies could also correspond to this τ2 component. Wiktor et al. determined that the well-stable Schottky defect (VU + 2VO) (neutral charge) shows lifetimes varying between 301 and 316 ps depending of the lattice direction arrangement. Moreover, their energies of formation calculated by GGA + U at 4.2 eV are comparable to the one of oxygen vacancies [15], such that these defect clusters could also be considered for the τ2 lifetime component.
The nature of the lifetime at 220 ps recorded for the doped material is more disconcerting than the one found in the standard sample, first because the trapping sites capture the totality of positrons up to saturation, second because this value was never reported in previous studies as a specific lifetime component. This component could be a signature of the defects created by the incorporation of additives in the UO2 lattice. Indeed, Riglet-Martial et al. [2] have shown by X-ray absorption near edge structure (XANES) that the oxidation state of soluble Cr is 3+ only in UO2, creating obvious charge defects. According to the experimental and calculation work of Cardinaels et al. [16], the most favorable site for Cr satisfying the observed variation of lattice parameter of doped UO2 is the substitution of uranium combined with a bonding with a U+5 or one oxygen vacancy in neutral cluster. Oxygen vacancies, the most stable point defects in stoichiometric UO2 [9], are formally expected to be positively charged, and should therefore in principle be invisible to PAS. However, Vathonne et al. [15] has shown by DFT + U method that VO charged −2 could also be stable for Fermi levels lying close to the middle of the band gap, so that the presence and detection of this very-stable defect should not be absolutely excluded. In order to provide a solid interpretation of the experimental data, more theoretical calculations are needed. Recently, collaboration with the Institute of Nuclear and Physical Engineering, Slovak University of Technology was established aiming to obtain an accurate theoretical interpretation.
5 Conclusion and perspectives
The PAS technique obviously highlights the microstructural particularity of doped vs. undoped UO2. We identified the bulk lifetime at 180 ps in a quite good agreement with previous studies. A second component most probably corresponding to either U-vacancies or Schottky defects has been detected in the undoped material. In the ADOPT UO2, the defects created by the addition of dopants lead to a strongly localized trapping sites up to saturation. If the origin of this 220 ps component remains unclear, the PAS signal evidences the specific lattice particularities of this material. A modeling work using DFT + U approach is ongoing in order to support assumptions and interpretation of the PAS signal. First calculations on 4 × UO2 supercell for U-vacancy result in a good accordance with the present interpretation. The effect of Cr+3 incorporation will be studied in larger supercell (32 × UO2).
We believe this technique, up to now scarcely used for nuclear fuel, provides new valuable data on the UO2 lattice-microstructure and can be used as a quality assessment tool for fresh fuel. This is of particular interest, as the doped fuel seemingly exhibits a structural contradiction, i.e., higher general density (i.e., less pores), but also a higher density of point defects. However, the one does not exclude the other; and the higher density is beneficial for the thermo-physical properties whereas the point defects are trapping sites for volatile fission products (i.e., fission gas) atoms. The point defects quantification is well accessible by PAS. Unfortunately, although the analysis of defects in irradiated fuel would be of utmost interest, today PAS cannot be used for this case due to the strong activity of the fuel which affects the detector.
Acknowledgments
The authors are very grateful to the financial support of swissnuclear and Westinghouse for providing the samples. The authors also would like to acknowledge useful discussions with Eva Vitkovska and Peter Ballo from the Institute of Nuclear and Physical Engineering, Slovak University of Technology as well as with Claude Degueldre from PSI. Finally they deeply appreciate the sample preparation performed by Andrej Bullemer, PSI.
References
- L. Bourgeois, P. dehaudt, C. Lemaignan, A. Hammou, J. Nucl. Mater. 297, 313 (2001) [CrossRef] [Google Scholar]
- C. Riglet-Martial, P. Martin, D. Testemale, C. Sabathier-Devals, G. Carlot, P. Matheron, X. Iltis, U. Pasquet, C. Valot, C. Delafoy, R. Largenton, J. Nucl. Mater. 447, 63 (2014) [CrossRef] [Google Scholar]
- V. Krsjak, J. Kuriplach, T. Shen, V. Sabelova, K. Sato, Y. Dai, J. Nucl. Mater. 456, 382 (2015) [CrossRef] [Google Scholar]
- V. Krsjak, V. Grafutin, O. Ilyukhina, R. Burcl, A. Ballesteros, P. Hähner, J. Nucl. Mater. 421, 97 (2012) [CrossRef] [Google Scholar]
- M.-F. Barthe, H. Labrim, A. Gentils, P. Desgardin, C. Corbel, S. Esnouf, J.P. Piron, Phys. Status Solidi C 4, 3627 (2007) [CrossRef] [Google Scholar]
- N. Djourelov, B. Marchand, H. Marinov, N. Moncoffre, Y. Pipon, P. Nédélec, N. Toulhoat, D. Sillou, J. Nucl. Mater. 432, 287 (2013) [CrossRef] [Google Scholar]
- H.E. Evans, J.H. Evans, P. Rice-Evans, D.L. Smith, C. Smith, J. Nucl. Mater. 199, 79 (1992) [CrossRef] [Google Scholar]
- H. Labrim, M.-F. Barthe, P. Desgardin, T. Sauvage, G. Blondiaux, C. Corbel, J.P. Piron, Appl. Surf. Sci. 252, 3256 (2006) [CrossRef] [Google Scholar]
- J. Wiktor, E. Vathonne, M. Freyss, G. Jomard, M. Bertolus, MRS Proc. 1645 (2014) [CrossRef] [Google Scholar]
- D. Roudil, M.F. Barthe, C. Jégou, A. Gavazzi, F. Vella, J. Nucl. Mater. 420, 63 (2012) [CrossRef] [Google Scholar]
- J. Arborelius, K. Backman, l. Hallstadius, M. Limbäck, J. Nilsson, B. Rebensdorff, G. Zhou, K. Kitano, R. Löfström, G. Rönnberg, J. Nucl. Sci. Technol. 43, 967 (2006) [CrossRef] [Google Scholar]
- J. Kansy, Nucl. Instrum. Methods Phys. Res. Sect. Accel. Spectrometers Detect. Assoc. Equip. 374, 235 (1996) [CrossRef] [Google Scholar]
- A. Vehanen, P. Hautojärvi, J. Johansson, J. Yli-Kauppila, P. Moser, Phys. Rev. B 25, 762 (1982) [CrossRef] [Google Scholar]
- B. Dorado, M. Freyss, B. Amadon, M. Bertolus, G. Jomard, P. Garcia, J. Phys. Condens. Matter 25, 333201 (2013) [CrossRef] [Google Scholar]
- E. Vathonne, J. Wiktor, M. Freyss, G. Jomard, M. Bertolus, J. Phys.: Condens. Matter 26, 325501 (2014) [CrossRef] [Google Scholar]
- T. Cardinaels, K. Govers, B. Vos, S. Van den Berghe, M. Verwerft, L. de Tollenaere, G. Maier, C. Delafoy, J. Nucl. Mater. 424, 252 (2012) [CrossRef] [Google Scholar]
Cite this article as: Mélanie Chollet, Vladimir Krsjak, Cédric Cozzo, Johannes Bertsch, Positron annihilation spectroscopy study of lattice defects in non-irradiated doped and un-doped fuels, EPJ Nuclear Sci. Technol. 3, 3 (2017)
All Tables
Mean lifetimes τ, first and second components τ1 and τ2 and their associated intensity Ii. Italic values of τ2 indicate fixed parameters during the decomposition. Reduced chi-squares F.V. are given for each fit. Bulk lifetimes were calculated from the experimentally measured data according to the standard trapping model [13].
All Figures
|
Fig. 1 Schematic drawings of the experimental setup (top and bottom left) and picture of the positron lifetime spectrometer facility (right). In this case, the spectrometer was used in 2-detector mode [3]. |
| In the text | |
|
Fig. 2 Positron lifetime spectrum of the two investigated UO2 materials, defect-free Fe sample and calibration 60Co source. |
| In the text | |
Current usage metrics show cumulative count of Article Views (full-text article views including HTML views, PDF and ePub downloads, according to the available data) and Abstracts Views on Vision4Press platform.
Data correspond to usage on the plateform after 2015. The current usage metrics is available 48-96 hours after online publication and is updated daily on week days.
Initial download of the metrics may take a while.