| Issue |
EPJ Nuclear Sci. Technol.
Volume 11, 2025
|
|
|---|---|---|
| Article Number | 35 | |
| Number of page(s) | 11 | |
| DOI | https://doi.org/10.1051/epjn/2025033 | |
| Published online | 17 July 2025 | |
https://doi.org/10.1051/epjn/2025033
Regular Article
Study of radiolysis bubbles in bitumen used for nuclear waste management with ultrasounds and X-Ray microtomography
1
IES, Univ Montpellier, CNRS Montpellier France
2
Autorité de Sûreté Nucléaire et de Radioprotection (ASNR), PSN-RES/SCA/LECEV F-91400 Saclay France
3
Autorité de Sûreté Nucléaire et de Radioprotection (ASNR), PSE-ENV/SPDR/USDR F-92260 Fontenay-aux-Roses France
4
Université Paris Cité, CNRS, MSC 75013 Paris France
* e-mail: This email address is being protected from spambots. You need JavaScript enabled to view it.
Received:
2
April
2025
Received in final form:
10
June
2025
Accepted:
13
June
2025
Published online: 17 July 2025
Abstract
In the realm of nuclear waste management, an ultrasonic investigation of radiolysis bubbles in bitumen has been carried out. Mechanical waves are very sensitive to gas cavities in matter, therefore ultrasonic velocity was measured in a straight-run distillation bitumen labelled AZALT 70/100 irradiated with 60Co (gamma irradiation) at dose rates between 5 and 1200 Gy/h and total integrated doses ranging from 2 to 100 kGy in IRMA and PAGURE French irradiation facilities. A comparative study of ultrasonic velocity and X-Ray microtomography measurements shows that ultrasonic velocity is linked to the concentration of bubbles within the material. A first attempt to deduce the volume fraction of hydrogen bubbles created by irradiation at ambient conditions with ultrasonic velocity measurements are proposed and discussed. This method constitutes an interesting approach dedicated to the monitoring of radiolysis bubbles formation and their evacuation mechanisms. It is particularly promising as ultrasonic sensors can operate effectively in high radiative and high temperature environments. Thus, real time application can be envisaged during irradiation and temperature increase for future experiments.
© D. Laux et al., Published by EDP Sciences, 2025
 This is an Open Access article distributed under the terms of the Creative Commons Attribution License (https://creativecommons.org/licenses/by/4.0), which permits unrestricted use, distribution, and reproduction in any medium, provided the original work is properly cited.
1. Introduction
Since 1960s, the bitumen has been chosen by the French nuclear industry as a matrix for conditioning low- and intermediate-level long-lived waste. This choice is attributed to its high agglomerating power, high chemical inertness, non-permeability, low solubility in water, high confining power, and moderate processing temperature [1]. Aqueous effluents, generated during the reprocessing of nuclear spent fuel, contain radionuclides that are treated through a co-precipitation process, which involves insolubilizing the radionuclides by adding co-precipitation salts, such as BaSO4, Cu(OH)2, and others, that have a specific chemical affinity for the radionuclides [2]. The sludge is then concentrated through filtration, and the solid phase containing the radionuclides is encapsulated in bitumen through a co-extrusion process at around 160 °C. This results in Bituminized Waste Products (BWPs), which are stored in steel drums to form BWPs packages and consist of a dispersion of inorganic salts within a bitumen matrix. In France, the bitumen used is a straight-run distillation bitumen. For this study, a bitumen labelled AZALT with a penetration grade of 70/100 was selected as a simulant for the bitumen used in the industrial process. This choice is based on the similarity of its chemical composition and physical properties with those of the bitumen used in the French nuclear industry since 1968.
A significant number (∼42000) of BWPs packages, classified as intermediate-level long-lived waste (MA-VL) are intended for disposal at the Industrial Centre for Geological Disposal (CIGEO project). In the context of nuclear safety, it is essential to investigate the thermal and irradiation behaviour of these BWPs. Indeed, their thermal behaviour, from production to long-term disposal, could potentially trigger exothermic chemical reactions, increasing the risk of ignition and radionuclides dispersion. Moreover, during storage and operational period of disposal, the bitumen matrix undergoes structural modifications due to self-irradiation. As bitumen is a continuum of predominantly unsaturated and polycyclic organic compounds, it is sensitive for self-irradiation [3], leading to the generation of radiolysis gases. The primary gas produced is hydrogen (between 75 and 95% depending on the type of bitumen) [4] which can elevate the fire and explosion risk when released. More information concerning the radiolysis of bitumen and bituminous radioactive waste can be found in a comprehensive review recently published [5]. Consequently, the role of these bubbles needs to be determined. More precisely, a good understanding of the formation and evacuation mechanisms of radiolysis gases as the temperature increases is crucial to optimize calculation codes dedicated to long-term thermal behaviour of waste packages simulation. Obviously, direct optical observation of the bubbles is not feasible due to bitumen opacity. In the literature [3–8], the rheology of pure bitumen as well as the properties of non-radioactive model-BWP samples that were externally irradiated to form H2 bubbles with various radii and volume fractions were largely investigated. This external irradiation with high dose rates, simulates, in short times, the apparition of radiolysis bubbles by self-irradiation on very long periods. Even if X-Ray tomography is the actual accurate tool to visualise bubble clouds, it is not possible to perform in-line measurements during irradiation to monitor bubble formation and evolution. Furthermore, to date, no study at high temperature (namely 100−180 °C) to evaluate bubble rising in the event of fire is available.
To address this issue, refine existing results regarding bubbles properties as a function of irradiation dose rate, integrated dose, and temperature, and improve understanding of BWPs’ thermal behaviour, an extensive program (ARISE) has been initiated by CNRS/Montpellier University (Acoustic Team of the Institute of Electronics and Systems, IES) and French Nuclear Safety and Radiation Protection Authority ASNR (LECEV and USDR laboratories) in 2023.
In the present study, the influence of bubble clouds generated in pure bitumen by external irradiation in the range of 2−100 kGy on ultrasonic velocity is investigated. This is a first step before studying model-BWP samples. Further, to better interpret ultrasonic results, X-Ray microtomography is used. Firstly, irradiation characteristics in IRMA and PAGURE irradiation facilities will be given. In the second part, X-Ray microtomography and ultrasonic methods will be described along with some theoretical elements concerning the models describing the propagation of ultrasonic waves in bubble clouds. Then, results concerning ultrasonic velocity versus irradiation dose will be presented, discussed and interpreted regarding void fraction obtained by X-Ray microtomography. Lastly, an attempt to deduce the volume fraction of hydrogen bubbles with the measured ultrasonic velocity will be proposed by using the theoretical models that are previously presented.
2. Materials and methods
2.1. Bitumen sample
The bitumen used in this study is a straight-run distillation bitumen, labelled AZALT 70/100, with a penetration grade of 70/100, provided by Total Energies. The characteristics of pure 70/100 bitumen are reported in [4].
2.2. Bitumen sample holder
In this study, Duran Borosilicate square bottles with a capacity of 250 mL and dimensions of 64×64×143 mm (Length × Width × Height) were used as sample holder. These bottles were filled with 180 mL of pure bitumen (except one, only filled with 90 mL), which was heated to 100 °C to achieve sufficient fluidity, facilitating the filling process. It should be highlighted that these flasks are used in this study as a first step to investigate the potential of ultrasound to detect and investigate the radiolysis bubbles within the bitumen.
2.3. 60Co gamma facilities and irradiation characteristics
Irradiation tests were carried out with γ60Co sources at room temperature in air at IRMA facility (operated by the French Nuclear Safety and Radiation Protection Authority “ASNR”) and PAGURE facility (operated by the French Alternative Energies and Atomic Energy Commission “CEA”). To achieve these tests and prior to irradiation, a preparatory phase test “approach dose-rate measurement” was conducted by using the empty Duran bottles to determine the appropriate sources, test geometries and, if necessary, the type of screen plate to be used. The first irradiation campaign was carried out in IRMA at dose rates around 15, 300, 600 and 1200 Gy/h. Total doses around 6, 50 and 100 kGy were reached. The second test was carried out in PAGURE at dose rate around 5.5 Gy/h and total doses around 2, 4 and 6 kGy. Photographs of bitumen bottles in the irradiation cells are displayed in Figure 1. Table 1 summarizes the reported doses and dose rates for all the samples investigated in this study. In Figure 1, one can notice that 12 bottles have been irradiated in PAGURE. Only 6 bottles were containing pure bitumen. The others were filled with bi-salt bitumen mixture and are not studied in this communication. For the 6 bottles of bitumen, 2 samples were irradiated for a same dose and dose rate. After X-Ray microtomography analysis, no difference was observed between the two samples. That is the reasons why only three samples have been selected for ultrasonic investigations. Concerning irradiation in IRMA, 5 samples have been irradiated but one sample was only filled with 90 mL of bitumen. Such a volume being not sufficient for ultrasonic measurements, this sample was excluded from the study. Consequently, 7 samples were analysed: 4 from IRMA and 3 from PAGURE facilities.
 |
Fig. 1. Bitumen samples irradiated in IRMA and PAGURE facilities. |
Doses and dose rates of selected irradiated bitumen samples.
2.4. X-Ray microtomography measurements
2.4.1. Methodology
A Bruker Skyscan 1173 micro-CT system, equipped with a high-resolution X-Ray source, was used to visualize the samples at 125 kV and 61 μA. The system features a 40−130 kV, 8W X-Ray source with a <5 μm spot size and a high-resolution distortion-free flat-panel CMOS X-Ray detector (2240 × 2240 pixels) for both 2D and 3D imaging. It captures high-resolution 2D cross-sectional images, which are then reconstructed into 3D models to visualize internal structures. With a spatial resolution of 6.5 μm and detail detectability of <4−5 μm, the system can scan objects up to 200 mm in length and 140 mm in diameter. A sample manipulation stage with a vertical rotation axis allows multiple translations and rotations to align the rotation axis, detector, and sample. The scan lasts approximately 225 min, completing a 360° rotation and capturing 1800 scans with an angular increment of 0.2°. In our setup, the resolution achieved is about 30 μm, ensuring detailed visualization of the internal structure of the samples.
2.4.2. Data analysis
In order to determine the void fraction as well as radius distribution of bubbles within the material, a Python code was developed. The following steps were used for the 3D analysis of bubbles characteristics: image resizing, thresholding using Otsu's segmentation method [9], removal of artefacts, labelling bubbles and finally calculating their properties (volume area in 2D, volume in 3D, equivalent diameter, void fraction).
2.4.3. Void fraction calculation
The void fraction or volume fraction of bubbles Φ, representing the volumetric fraction of hydrogen bubbles relative to the total bitumen volume, is defined as:
 (1)
(1)
where Vbubbles is the volume of hydrogen bubbles and Vtotal is the total volume of bitumen.
Thanks to repeatability tests and sensitivity analysis on thresholding evaluation, we estimated that the error on the void fraction is ±1.5% with our Python code.
For the moment, we do not have a calibration sample with characteristics similar to irradiated bitumen. So, to validate our code, the results obtained with the Python code were then compared to those provided by the commercial Software VgStudio, developed by GE-Inspection Technologies, for the IRMA 2a and IRMA 3 samples. VgStudio yielded void fraction values of 7% and 9% respectively, while our Python code gave values of to 7.43% and 11.4%, respectively. Considering that both software have a common error margin of 1.5%, we therefore used our Python code to determine the characteristics of the bubbles within the irradiated bitumen.
2.5. Ultrasonic approach
Following irradiation and X-Ray microtomography analysis, the samples were sent to IES Montpellier University lab for ultrasonic measurements. In detail, samples were stored at 10 °C after irradiation at ASNR and when they were sent to Montpellier, we used a container with ice. They were again stored at 10 °C in Montpellier. At this temperature, the viscosity is around 2.8 MPa.s regarding Mouazen's measurements extrapolation [7]. Repeatability tests during 2 months of experimentations did not reveal any evolution of ultrasonic velocity. Considering bubbles with a radius of 500 μm, the velocity of migration can be estimated at around 1 mm per month. Bubbles displacement is then negligible compared to the size of Duran bottles, sensors (see part 2.5.1) and consequently it can be considered that very few bubbles have been evacuated from irradiation to ultrasonic tests.
After these measurements, 3 samples (IRMA 1, IRMA 2a and IRMA 3) were sent back to ASNR in order to be heated at 130 °C for 30 min. Given the viscosity of bitumen at this temperature [7] and the estimated bubble sizes by microtomography, it is assumed that all bubbles have reached the free surface of bitumen and have been evacuated. Indeed, considering the smallest bubbles (and therefore slowest moving) with a radius of 100 μm (data from tomography) and a viscosity of 0.1 Pa.s, at 130 °C, the distance covered by a bubble in 30 min is around 50 cm, which is far greater than the height of the bitumen in the Duran bottle (∼6 cm). After heating, ultrasonic measurements were then performed in IES to evaluate the evolution of the bitumen matrix after irradiation and without bubbles.
2.5.1. Methodology
The geometry of Duran bottles is not perfectly adapted to obtain accurate results in terms of attenuation assessment as the bottle faces are not perfectly parallel resulting in imperfect contact at the (bottle)/(ultrasonic sensor) interface. Thus, in this study, we only focused on ultrasonic velocity. Future works will be dedicated to the realization of specific metallic cells in aluminium with perfect geometry and thickness of 2 cm: controlled walls thickness, parallel faces, etc. In order to gain thorough knowledge of pure bitumen's acoustic and high frequency rheological properties, we previously employed through transmission method with two 500 kHz transducers and 3D printed cells (with three different thicknesses) filled with 70/100 bitumen. Thanks to the measurement of ultrasonic wave time of flight between a probe acting as emitter and another one acting as receiver, we deduced the ultrasonic longitudinal velocity in bitumen, by adjusting the time of flight versus thickness. Furthermore, with the measurements of ultrasonic attenuation at various temperatures and Time Temperature Superposition (TTS) principle, a master curve describing the evolution of viscosity versus temperature was established on a wide frequency range. All details concerning this former experimental approach and TTS method can be found in our previous study [10]. As in our previous work, in this new study, the measurements were performed with the two 500 kHz transducers for the new set of bitumen samples presented in Table 1. Since only one thickness for pure bitumen and for each irradiated sample was used, the experimental method was modified compared with [10]. In a first time, we used a Duran bottle filled with a liquid perfectly known in terms of ultrasonic velocity (vREF)versus temperature as a reference sample. Two 30 mm diameter (Olympus – V101 RM VISIOSCAN) longitudinal transducers with a wide bandwidth ranging from 250 kHz to 650 kHz according to the manufacturer (in practice this bandwidth is larger) were coupled to the bottle with liquid honey to ensure good transmission of the ultrasonic waves between transducers and glass bottle. Bottle and sensors were mounted on an adjustable bench with two clamping screws to maximize (sensor/glass) contact and avoid signal losses. The bench was placed in a BINDER thermoregulated chamber. These sensors were connected to a JSR Ultrasonics DPR300 pulser/receiver generator and the acoustic signals transmitted through the bottle were then visualized on a LeCroy WaveJet 334 oscilloscope. The acquisition of the acoustic signal was carried out with an in-house LabView software. The ultrasonic signal was transferred from the oscilloscope to the computer using a National Instruments (USB/GPIB HS+) acquisition card. Then, the same procedure was repeated with a Duran bottle filled with the liquid to be studied. After signals through reference and sample acquisition, an intercorrelation procedure was used to estimate the difference of time of flight Δt=tSample−tRef. With the knowledge of bottle internal thickness (e=55 mm) previously measured after one empty bottle destruction, the longitudinal ultrasonic velocity in sample was deduced with relationship (2). This velocity represents the group velocity of the ultrasonic signal on the sensor's bandwidth. All signal processing was performed using a personal Python code developed with the Spyder 5 interface.
 (2)
(2)
In order to validate this new experimental protocol, in a first time, we used water as reference and the sample was pure 70/100 bitumen. The ultrasonic velocity in water at a given temperature was taken from literature [11]. The velocity measured in pure bitumen was then compared to velocity measured in our previous works [10] (see Sect. 3). For irradiated samples, this pure bitumen was then used as reference sample. For irradiated samples investigation, we did not use water as reference because ultrasonic amplitudes between samples and water were so high that signals comparison was more difficult. It should also be noted that relationship (2) is only valid if the ultrasonic velocity in glass bottle is the same between the reference and the sample. With a pulse echo method (not described here because it is out of the scope of this communication), we have checked that irradiation did not modify the ultrasonic velocity in glass. Photographs of the sensors in contact with samples and typical transmitted signals at 10 °C are given in Figure 2.
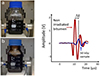 |
Fig. 2. Sensors and bitumen samples in the thermoregulated chamber and corresponding ultrasonic signals. (a) Non-irradiated bitumen sample, (b) 50 kGy irradiated bitumen sample. |
2.6. Ultrasound and bubbles: elements of theory
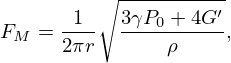
Ultrasonic wave's propagation in bubbly media has been widely investigated in literature especially in liquids with low viscosity. Following the work of Foldy, Commander and Prosperetti [12, 13] have proposed an analytical approach to describe the propagation in liquids containing polydisperse bubble clouds. This approach has been more recently extended to viscoelastic media such as gels and dough [14, 15]. Commander and Prosperetti models, modified to consider the shear properties of the matrix containing bubbles, gave correct results up to a volume fraction of bubbles around 5−10%. For higher bubble concentrations, the ISA approach [16] seems to be very satisfactory regarding recent results obtained in bubbly PDMS. However, the interaction between acoustic waves and bubble clouds can be divided into three zones thanks to the introduction of the Minnaert frequency FM, which corresponds to the resonance frequency of bubbles. For a monodisperse bubble cloud, in a viscoelastic medium, FM is defined as [14, 15, 17]:
 (3)
(3)
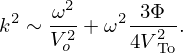
where r is the mean radius of the bubble cloud, γ is the ratio of the specific heat capacities of the gas in the bubbles, P0 is the static pressure of the gas, ρ the mass density of the matrix, and G′ the real part of its shear modulus. For frequencies much lower than the Minnaert frequency, the acoustic velocity does not depend on frequency and the bubbly medium can be considered as an equivalent homogeneous medium, already described by the Wood's model. In this region, a simple expression of acoustic velocity can be obtained. It only depends on the volume fraction of bubbles Φ (also called void fraction), the acoustic longitudinal velocity in the matrix Vo and the shear wave velocity in the matrix VTo. According to [12, 13], if ω is the angular frequency, the longitudinal acoustic velocity is defined as:
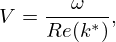 (4)
(4)
where:
 (5)
(5)
In this relationship, NTOT represents the total number of bubbles per meter cube and b can be calculated with expressions given by Commander and Prosperetti in [12, 13]. In case of bitumen, for the frequencies considered in this study,  is very high (108−109 Pa) and consequently:
 (6)
(6)
Furthermore, in low frequency range, calculation shows that the complex term, involving the b factor, is negligible compared to the others. At last, in low frequency range, it is supposed that ω≪2πFM and for a monodisperse distribution of bubbles, NTOT=Φ/(4πr3/3). Consequently, k* becomes a real number k:
 (7)
(7)
Straightforward calculations give relationship (8) for the low frequency (f≪FM) velocity VLF=ω/k:
 (8)
(8)
When the frequency ∼FM, acoustic velocity and attenuation rapidly increase. At last, in the high frequency domain (f≫FM), when the wavelength is smaller than the typical distance between bubbles, acoustic attenuation decreases again and the velocity in the bubbly medium is equal to the longitudinal velocity in the matrix. An illustration is given in Figures 3 and 4 using an in-lab Python code. For this simulation at 10 °C, the bubble cloud (Φ=10%)is described with a log-normal distribution with a median radius of r=500 μm, and a polydispersity parameter ɛ=0.2 following the method presented in [14]. All parameters needed to do the simulation [12–14], namely γ,ρ, matrix viscosity, Vo, thermal conductivity and mass density of hydrogen, were extracted from literature and from our previous study on bitumen 70/100 [10].
 |
Fig. 3. Simulated attenuation in bitumen with Φ=10%, r=500 μm and ɛ=0.2. |
 |
Fig. 4. Simulated velocity in bitumen with Φ=10%, r=500 μm and ɛ=0.2. |
Concerning VTo, a value of 870 m/s was chosen. We will discuss later of this choice in the communication. In this case, the Minnaert frequency is close to 500 kHz. In fact, that is the reason why 500 kHz transducers are suitable for ultrasonic attenuation increase analysis, which will be the aim of future data treatments. In Figure 3 we have plotted the total attenuation which is the sum of the attenuation due to bubbles and the attenuation due to the matrix (calculated with our previous work [10]). Regarding the dimensions of our bitumen cells, if the attenuation is equal to 50 Np/m, the initial signal is divided by 15, and, if the attenuation is equal to 60 Np/m, the initial signal is divided by a factor 30. This means that the bubbly bitumen should act as a low pass filter with a cutting frequency estimated at around 250–300 kHz considering the signal to noise ratio. This was confirmed with Fast Fourier's transforms (FFT) of our signals. Indeed, these FFT showed that transmitted signals bandwidths were between ∼80 to ∼250 kHz resulting from the multiplication of sensors’ bandwidth by ultrasonic attenuation in bubbly bitumen. If we consider Figure 4, it would appear that the ultrasonic velocity measured (mean value of velocity over the frequential zone investigated) is rather equal to the velocity for low frequency regime.
3. Results
3.1. Void fraction
The X-Ray microtomography cross-sections images from the top, middle and bottom of the samples PAGURE 1 and PAGURE 2 did not reveal bubbles. This indicates that the irradiation at 2 and 4 kGy did not lead to bubble formation, or that the formed bubbles are smaller than the chosen pixel for the analysis. The absence of detectable bubbles in the entire sample suggests either that the dose was insufficient for bubble nucleation, the bubbles formed are too small to be detected by the microtomography used or other factors may have influenced bubble formation.
For the samples irradiated at 6, 50 and 100 kGy, the obtained X-ray microtomography images revealed the presence of bubbles within the sample as shown in Figure 5. The void fraction and mean radius were then determined by our Python code and are presented in Table 2. The effect of dose rate, between IRMA 2a and IRMA 2b (dose rate factor = 4) at 50 kGy as well as between PAGURE 3 and IRMA 1 at 6 kGy (dose rate factor = 30), seems to be negligible, unlike previous finding [4], where a decrease in dose rate from 5000 Gy/h to 400 Gy/h (dose rate factor = 12.5) of an irradiated bituminous mixture at 1 MGy led to the formation of more uniform, nearly monodisperse spherical bubbles of smaller size. Conversely, at 5000 Gy/h, they noted a broader bubble size distribution with more irregular shapes. This may indicate that in our study the effect of integrated dose is more dominant than the dose rate. However, it should be noted that the impact of dose rate might not be as pronounced at lower doses, where the formation of small bubbles is already observed. Future studies should focus on repeating these tests to determine the threshold of the integrated dose above which the effect of the dose rate is evident and to validate the observed trends with greater precision. This will improve our knowledge to better understand how dose rates influence the formation of bubbles in bitumen.
 |
Fig. 5. Bubbles observed by X-ray microtomography on slices of irradiated bitumen taken at mid height of the Duran bottle. Gas bubbles (black) and bitumen matrix (grey). |
Calculated void fractions and mean bubble's radius determined with X-Ray microtomography.
On the other hand, if the dose rate is increased by factor of 2 to achieve double the integrated dose, as for samples IRMA 2b and IRMA 3, it is evident that the void fraction almost doubles, from 6.64% for IRMA 2b to 11.4% for IRMA 3, while the mean radius remains around 580 μm. This may suggest the possibility of a linear correlation between dose and void fraction. Moreover, even at 100 kGy, the growth mechanism of these bubbles into larger ones seems not to be yet initiated. This suggest that the integrated doses of the present study are below the threshold for initiating this mechanism. Future tests should be carried out to investigate the threshold of dose and dose rate at which larger bubbles start to form, as well as the correlation of integrated doses as a function of void fraction.
3.2. Ultrasonic velocity
To validate the new experimental approach, we first carried out repeatability tests at 10 °C. Thirty measurements were made on pure bitumen with water used as reference as described in Section 2.5.1, and led to a value of 1990 ± 40 m/s with two standard deviations. This result is totally in line with the result obtained at 10 °C in our previous study [10] in which we have established that  m/s for T=10 °C. The evolution of ultrasonic velocity (calculated with relationship (2) and vREF=1993 m/s) measured at 10 °C versus integrated dose is shown in Figure 6. A decrease of ultrasonic wave velocity is observed as soon as the integrated dose reaches 6 kGy. This is in agreement with tomographic results (see Fig. 5 and Tab. 2) where no bubbles were obtained at integrated dose of 2 and 4 kGy. Unsurprisingly, this indicates that the decrease in ultrasonic velocity is correlated to the increase in the void fraction. Regarding error bars, no significant influence of dose rate is observed on the ultrasonic velocity, between IRMA 2a-IRMA 2b samples and PAGURE 3-IRMA 1 samples. This is consistent with the X-ray microtomographic results reported previously in Section 3.1, where no effect of dose rate was observed on bubbles formation at the integrated doses used in this study.
 |
Fig. 6. Ultrasonic velocity measured at 10 °C in irradiated samples before and after heating. |
Secondly, it was found that after heating to evacuate all bubbles, the ultrasonic velocity in IRMA-irradiated samples returned to the same value as in non-irradiated bitumen (see Fig. 6). This indicates that the bitumen matrix was not influenced by irradiation and the ultrasonic velocity variation is only attributed to bubbles. These results demonstrate the potential of the ultrasonic measurement to detect the presence of bubbles in the bitumen matrix. Hence, theoretical models of ultrasonic wave's propagation in pure bitumen containing bubbles should be able to evaluate the void fraction, using ultrasonic velocity measured versus irradiation dose, as discussed in the following section.
At last, in Figure 7, other experiments (IRMA samples) at 15, 20 and 25 °C are presented except for the sample IRMA 3 for 25 °C. Indeed, the attenuation was too high to obtain accurate results. The results for the irradiated samples in PAGURE are not shown, because for doses 2 and 4 kGy there is no difference compared with non-irradiated bitumen, and for sample PAGURE 3, the values are identical to those obtained for IRMA 1. The decrease observed for 10 °C was confirmed for all temperatures. For each temperature, the sensitivity of total dose was the same leading to the conclusion that temperature only has an impact on bitumen matrix properties. These data can be adjusted with relationship (9) where D represents the dose in kGy:
 (9)
(9)
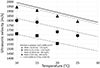 |
Fig. 7. Ultrasonic velocity versus temperature and dose. |
3.3. Void fraction estimation
As already stated in part 2.6, the ultrasonic velocity measured can be, as a first estimation, assimilated to the low frequency velocity. In this case, dispersion is negligible, and the group velocity measured can be assumed to be equal to the phase velocity estimated with equation (8). The bubbly medium is seen as an effective one with no effect of bubble radii. Regarding the simplified equation (8), VTo is the most important parameter to evaluate Φ from the measured ultrasonic velocity. For elastic solids, its evaluation can be performed with pulse echo or through transmission methods with shear ultrasonic transducers. For viscoelastic materials, the problem is more complex because shear ultrasonic attenuation can be very high leading to very small distance of propagation in the material: a few mm to a few μm depending on temperature and frequency. Results are generally obtained for low temperatures when damping decreases. For instance, in [18] results were obtained for a temperature of −10 °C on a 35/50 grade bitumen.
When through transmission methods fail, ultrasonic shear reflectometry can be used: the main principle is to analyse the complex reflection coefficient of a shear ultrasonic wave at an interface solid/viscoelastic material. It has already been successfully applied in our team for honey characterisation [19, 20]. In [21] it was applied on a “non-Newtonian ultra-heavy 6° API hydrocarbon with a room temperature viscosity of 103 Pa.s”. Nevertheless, its application on bitumen is not easy, because bitumen must be heated in order to be deposited on a solid material coupled to a shear wave transducer. That is the reason why this method was not applied in this work. Furthermore, it would totally overpass the main goal of the study. Based on knowledge, in literature, no values of VTo as evaluated by ultrasound, are given for our frequency and temperature ranges. To estimate the shear velocity, it is also possible to perform classical rheological measurements with rheometers for various temperatures and to use Time Temperature Superposition (TTS) principle to deduce, for a chosen temperature, a master curve of the complex shear modulus G* on an enlarged frequency range. Then, it is possible to estimate VTo with G*. Such master curves can be successfully adjusted with analogic models. One of the most important is the 2S2P1D model. In particular, parameters of this model can be found at 10 °C for a 70/100 grade bitumen in [22]. Using this reference and the 2S2P1D model, VTo was calculated for the 70/100 bitumen studied in [22] between 100 and 500 kHz. Unsurprisingly, this revealed that ultrasonic shear velocity depends on frequency. The uncertainty was not given in [22], but as VTo value was estimated by TTS and rheology, we estimate that a reasonable error bar on VTo should be at least ±20%. With [22], VTo(10 °C) was estimated roughly between 600 and 800 m/s.
Then, we have adjusted VTo for each temperature (10, 15, 20, 25 °C) to obtain a good agreement between the void fraction estimated with (8) and with that determined by microtomography. At last, the porosity estimated versus dose with ultrasounds represents the mean value of porosity estimated for the various temperatures. The following evolution of VTo versus temperature was obtained:
 (10)
(10)
Remarks: for T=10 °C, we obtained VTo=870 m/s. Even if this value does not exactly fit with the interval given here above, the fact that we did not find an aberrant value, extremely far from what could be expected, shows that the model proposed is applicable. Furthermore, for various bitumen having the same penetration grades, rheological properties can be different. Thus, this VTo value is just given as an order of magnitude of what might be obtained on our AZALT 70/100 bitumen. At last, it is acknowledged that some discrepancies may exist between ultrasonic velocities measured with ultrasonic sensors and those determined through rheological methods. Nevertheless with  and
and  established in our previous study [10], the Poisson's ratio of the bitumen matrix varied from 0.38 to 0.4. Such values are in agreement with what is generally reported for bitumen [18]. At last, the decrease of
  is also reported in [18].
As a conclusion, using (8), the working equation (11) is proposed to evaluate the void fraction in AZALT 70/100 bitumen from the velocity V(T) measured versus temperature,  and Vo(T)=2099−10.57T. The results are reported in Figure 8.
![Mathematical equation: $$ \Phi =\frac {4}{3}\left [\frac {V_{\mathrm {To}}(T)}{V_{o}(T)} \right ]^{2}\frac {(V_{o}(T)^{2}-V(T)^{2})}{V(T)^{2}}. $$](/articles/epjn/full_html/2025/01/epjn20250024/epjn20250024-eq17.gif) (11)
(11)
The good agreement between ultrasonic void fraction estimated with ultrasounds and tomography as shown in Figure 8, proves the potential of using ultrasound as a novel approach to detect and quantify the radiolysis bubbles within an irradiated bitumen matrix, as well as to assess its rheological behaviour. Moreover, this technique seems to be promising to monitor the nucleation of radiolysis bubbles at room temperature during irradiation, as well as their temperature migration.
4. Discussion
This study demonstrated that bubble nucleation may start to occur at around 6 kGy, lower than integrated dose (30 kGy) reported by the author [8], with a void fraction of about 1% ± 1.5% and a maximum mean bubble radius of approximately 400 ± 40 μm. Although the quantity of bubbles formed remains relatively low, these results may suggest that 6 kGy may represent the threshold dose for bubbles nucleation. To confirm that the observed bubbles were indeed hydrogen and not air trapped in samples, we analysed unirradiated samples with X-Ray microtomography. The experiments revealed no air bubbles trapped during bottles filling. Besides, the authors reported that [8] if the gas concentration exceeds the solubility limit, bubbles might form. They estimated that the solubility of hydrogen at 1 bar vary from 1% to 7%, depending on the type of bi-salt bitumen mixtures. In our study, the quantity of hydrogen formed in pure bitumen at 6 kGy, calculated using [23], is found to be 0.5% at ambient conditions. This may suggest that bubble nucleation can initiate in pure bitumen at doses lower than those required for bi-salt bitumen mixtures. This preliminary conclusion, as well as laws proposed to link ultrasonic velocity to dose, void fraction and temperature will have to be refined with a greater number on samples especially in the range 0−50 kGy. Anyway, results presented in this communication have clearly established the sensitivity of ultrasounds to radiolysis bubbles.
Up to now, we only focused our attention on ultrasonic velocity because the geometry of Duran bottles is not perfectly adapted to obtain accurate results concerning attenuation assessment. Indeed, the bottle's faces are not parallel leading to an imperfect contact at the interface bottle/sensor.
We are currently working on the fabrication of sample cells with a thickness of 2 cm made of aluminium sample holder and equipped with a gas collection system for quantifying the gases released, notably hydrogen, during irradiation or temperature increase. These cells will help us to establish a threshold depending on void fractions, bubbles dimensions, dose and dose rate. With such cells, the contact between sensors and bitumen cells would be better to correctly evaluate the ultrasonic attenuation versus frequency. Signal processing will also be adapted to assess phase velocity of ultrasonic signal over the sensor's bandwidth. Then, the theoretical models presented in this paper should lead (thanks to the adjustment of ultrasonic attenuation and phase velocity) to void fraction, mean size of bubbles and polydispersity. Regarding literature, such an approach should be valuable up to Φ∼10% and bubble sizes not exceeding radii between 600−700 μm. For bigger bubbles, modified models (such as ISA approach) are supposed to be better.
These findings will give insights on how acoustic methods can be applied in the field of nuclear waste management, specifically in the monitoring and assessment of radiolysis processes.
5. Conclusion
This article aims to demonstrate that the radiolysis bubbles within the irradiated bitumen can be investigated with ultrasonic measurements. In this study, X-ray microtomographic analysis showed the absence of radiolysis at integrated doses lower than 6 kGy. The effect of dose rate is found to be negligible at integrated doses up to 100 kGy, in contrast to the literature [3] where the effect of dose rate on bubbles characterisation was strongly marked at 1 MGy. This may indicate that there exists a dose threshold beyond which the impact of dose rate becomes more pronounced. Moreover, in a very first approximation, a linear correlation is suggested between the void fraction and the integrated dose, where doubling the dose almost doubles the void fraction, from 6.64% at 50 kGy to 11.4% at 100 kGy. On the other hand, the bubble growth mechanism does not seem to be initiated at the integrated doses of the present study, as evidenced by the mean radius of around 580 μm at both 50 and 100 kGy. Therefore, future tests should be carried out to investigate the threshold of dose and dose rate at which larger bubbles start to form, as well as the correlation of dose rates and integrated doses as a function of void fraction. The good agreement between void fraction estimated by ultrasound and microtomography method proves the potentialities of this new approach for opaque media investigations. Up to now, tests were only performed after irradiation on pure bitumen. Regarding our previous work [10], it is possible to work with BWP samples (analog material of STE3 real sludge). Furthermore, as pointed out in [24], piezo elements are totally compatible for in line experiments during irradiation for dose rates and cumulative doses that are considered for our future experiments. Thus, we believe that ultrasonic quantitative evaluation of radiolysis bubbles during irradiation will be possible and only constitutes a technical challenge. We are currently working on such evaluation and on preparing in-line experiments at IRMA facility.
Acknowledgments
The authors sincerely acknowledge Mejdi Neji (ASNR/PSE-ENV/SPDR/LETIS), Pascal Lemaitre and Soleiman Bourrous (ASNR/PSN-RES/SCA) for their precious help concerning the Python code dedicated to 3D analysis of X-Ray microtomographic data as well as Gaetan Touzé from the LECBA laboratory at CEA for the 3D reconstructions performed using VgStudio and Total Energies for AZALT 70/100 bitumen samples. Oluwaseyi Miracle Adebola's help during his Master 2 internship was also invaluable in carrying out the experiments. At last, we sincerely acknowledge Lucie Millot for launching ARISE project.
Funding
We received a grant from CNRS through its interdisciplinary programs (MITI) and from ASNR through its exploratory projects. The project (ARISE: Suivi ultrAsonore des gaz de Radiolyse des enrobés bItuméS lors d’incEndie) was selected in the framework of the (CNRS/ASNR) call for proposal “Matériaux, santé et mesures: au cœur des défis du nucléaire”.
Conflicts of interest
The authors declare that they have no competing interests to report.
Data availability statement
All relevant data are given in this paper.
Author contribution statement
D. Laux, J-Y. Ferrandis: Funding acquisition, Conceptualization, Methodology, Investigation, Validation, Modelling, Software, US Formal Analysis, Supervision, Writing-Original Draft. H. Houjeij, C. Monsanglant: ARISE project coordination, Funding acquisition, Investigation, Supervision, Software, Design of the irradiation tests, Irradiation, Writing - Review & Editing. G. Matta: Investigation, Validation, Software, Writing-Review & Editing. S. Poirier: Investigation, Methodology, Validation, Design of the irradiation tests, Irradiation. F. Millet: Writing - Review & Editing. V. Leroy: Modelling, Writing - Review & Editing.
References
- E. Valcke, F. Rorif, S. Smets, Ageing of EUROBITUM bituminised radioactive waste: An ATR-FTIR spectroscopy study, J. Nucl. Mater. 393, 175 (2009), https://doi.org/10.1016/j.jnucmat.2009.06.001 [CrossRef] [Google Scholar]
- V.M. Efremenkov, Radioactive waste management at nuclear power plants, Int. At. Energy Agency Bull., 31, 37 (1989) [Google Scholar]
- M. Mouazen, A. Poulesquen, F. Bart, B. Vergnes, Effect of γ irradiation on nuclear bituminized waste products (BWP): X-ray microtomography and rheological characterization, J. Nucl. Mat. 419, 24 (2011) [CrossRef] [Google Scholar]
- M. Mouazen, A. Poulesquen, F. Bart, J. Masson, M. Charlot, B. Vergnes, Rheological, structural and chemical evolution of bitumen under gamma irradiation, Fuel Process Technol. 114, 144 (2013), https://doi.org/10.1016/j.fuproc.2013.03.039 [Google Scholar]
- L. Millot, H. Houjeij, G. Matta, J.Y. Ferrandis, D. Laux, C. Monsanglant-Louvet, Radiolysis of Bituminous Radioactive Waste: A Comprehensive Review, EPJ Nuclear Sci. Technol. 10, 4 (2024), https://doi.org/10.1051/epjn/2024004 [Google Scholar]
- M. Mouazen, A. Poulesquen, B. Vergnes, Influence of thermomechanical history on chemical and rheological behavior of bitumen, Energy Fuels 25, 4614 (2011) [CrossRef] [Google Scholar]
- M. Mouazen, A. Poulesquen, B. Vergnes, Correlation between thermal and rheological studies to characterize the behavior of bitumen, Rheol. Acta 50, 169 (2011) [CrossRef] [Google Scholar]
- J. Sercombe, F. Adenot, P.P. Vistoli, S. Parraud, C. Riglet-Martial, B. Gwinner, I. Felines, C. Tiffreau, M. Libert, Rapport Technique DTCD/2004/09, Dossier de référence bitume: synthèse des connaissances sur le comportement à long terme des colis bitumés (2004) [Google Scholar]
- N. Otsu, A threshold selection method from gray-level histograms, IEEE Trans. Man Cybern. Syst. 9, 62 (1979), https://doi.org/10.1109/TSMC.1979.4310076 [Google Scholar]
- D. Laux, K. Toulgoat, L. Millot, J.Y. Ferrandis, Rheological investigation of bitumen, used for radioactive waste conditioning, with ultrasonic waves, EPJ Nuclear Sci. Technol. 10, 1 (2024), https://doi.org/10.1051/epjn/2024002 [Google Scholar]
- A. Briggs, O. Kolosov, Acoustic Microscopy: second edition (Oxford University Press, 2009) [Google Scholar]
- K.W. Commander, A. Prosperetti, Linear pressure waves in bubbly liquids: Comparison between theory and experiments, J. Acoust. Soc. Am. 85, 732 (1989), https://doi.org/10.1121/1.397599 [CrossRef] [Google Scholar]
- A. Prosperetti, L.A. Crum, K.W. Commander, Nonlinear bubble dynamics, J. Acoust. Soc. Am. 83, 502 (1988), https://doi.org/10.1121/1.396145 [Google Scholar]
- V. Leroy, A. Strybulevych, J.H. Page, M.G. Scanlon, Sound velocity and attenuation in bubbly gels measured by transmission experiments, J. Acoust. Soc. Am. 123, 1931 (2008), https://doi.org/10.1121/1.2875420 [Google Scholar]
- V. Leroy, Y. Fan, A.L. Strybulevych, G.G. Bellido, J.H. Page, M.G. Scanlon, Investigating the bubble size distribution in Dough using ultrasound, bubbles in food 2, Chapter 5, in American Associate of Cereal Chemists International, editied by G.M. Campbell, M.G. Scanlon, D. Leo Pyle (AACC International Press, 2008), p. 51, https://doi.org/10.1016/B978-1-891127-59-5.50009-2 [Google Scholar]
- K. Zimny, A. Merlin, A. Ba, C. Aristégui, T. Brunet, O. Mondain-Monval, Soft porous silicone rubbers as key elements for the realization of acoustic metamaterials, Langmuir 31, 3215 (2015), https://doi.org/10.1021/la504720f [Google Scholar]
- V.N. Alekseev, S.A. Rybak, Gas bubble oscillations in elastic media, Acoust. Phys. 45, 535 (1999) [Google Scholar]
- N. Larcher, M. Takarli, N. Angellier, C. Petit, H. Sebbah, High frequency shear modulus of bitumen by ultrasonic measurements, in EATA (European Asphalt Technology Association) conference (Braunschweig June 3-5, 2013) [Google Scholar]
- V. Cereser Camara, D. Laux, Moisture content in honey determination with a shear ultrasonic reflectometer, J. Food. Eng. 96, 93 (2010), https://doi.org/10.1016/j.jfoodeng.2009.06.049 [Google Scholar]
- V. Cereser Camara, D. Laux, O. Arnould, Enhanced multiple ultrasonic shear reflection method for the determination of high frequency viscoelastic properties, Ultrasonics 50, 710 (2010), https://doi.org/10.1016/j.ultras.2010.02.007 [Google Scholar]
- A. Rabbani, D.R. Schmitt, Ultrasonic shear wave reflectometry applied to the determination of the shear moduli and viscosity of a viscoelastic bitumen, Fuel 232, 506 (2018), https://doi.org/10.1016/j.fuel.2018.05.175 [CrossRef] [Google Scholar]
- N.I. Yusoff, D. Monieur, G.D. Airey, The 2S2P1D: An excellent linear viscoelastic model, UNIMAS e-J. Civ. Eng. 1, 1 (2010), https://doi.org/10.33736/jcest.76.2010 [Google Scholar]
- M. Mouazen, Évolution des proprités rhéologié ques des enrobés bitume, vers une loi vieillissement/visco- sité, Ph.D. thesis, École Nationale Supérieure des Mines de Paris, 2011 https://pastel.hal.science/pastel- 00628039v1 [Google Scholar]
- M. Faisal Haider, V. Giurgiutiu, B. Lin, L. Yu, P.S. Lam, C. Verst, Effects of Gamma Radiation on Resonant and Antiresonant Characteristics of Piezoelectric Wafer Active Sensors, J. Nondestruct. Eval. Diagn. Progn. Eng. Syst. 2, 1 (2019), https://doi.org/10.1115/1.4041068 [Google Scholar]
Cite this article as: Didier Laux, Georges Matta, Hanaa Houjeij, Céline Monsanglant, Stéphane Poirier, François Millet, Valentin Leroy, and Jean-Yves Ferrandis. Study of radiolysis bubbles in bitumen used for nuclear waste management with ultrasounds and X-Ray microtomography, EPJ Nuclear Sci. Technol. 11, 35 (2025). https://doi.org/10.1051/epjn/2025033
All Tables
Calculated void fractions and mean bubble's radius determined with X-Ray microtomography.
All Figures
|
Fig. 1. Bitumen samples irradiated in IRMA and PAGURE facilities. |
| In the text | |
|
Fig. 2. Sensors and bitumen samples in the thermoregulated chamber and corresponding ultrasonic signals. (a) Non-irradiated bitumen sample, (b) 50 kGy irradiated bitumen sample. |
| In the text | |
|
Fig. 3. Simulated attenuation in bitumen with Φ=10%, r=500 μm and ɛ=0.2. |
| In the text | |
|
Fig. 4. Simulated velocity in bitumen with Φ=10%, r=500 μm and ɛ=0.2. |
| In the text | |
|
Fig. 5. Bubbles observed by X-ray microtomography on slices of irradiated bitumen taken at mid height of the Duran bottle. Gas bubbles (black) and bitumen matrix (grey). |
| In the text | |
|
Fig. 6. Ultrasonic velocity measured at 10 °C in irradiated samples before and after heating. |
| In the text | |
|
Fig. 7. Ultrasonic velocity versus temperature and dose. |
| In the text | |
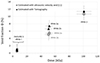 |
Fig. 8. Void fraction estimated with microtomography and with equation (11). |
| In the text | |
Current usage metrics show cumulative count of Article Views (full-text article views including HTML views, PDF and ePub downloads, according to the available data) and Abstracts Views on Vision4Press platform.
Data correspond to usage on the plateform after 2015. The current usage metrics is available 48-96 hours after online publication and is updated daily on week days.
Initial download of the metrics may take a while.